Sell Your HDB Today, Get $0: How Negative Cash Sales Can Still Be Found In Today’s Property Market
January 24, 2023
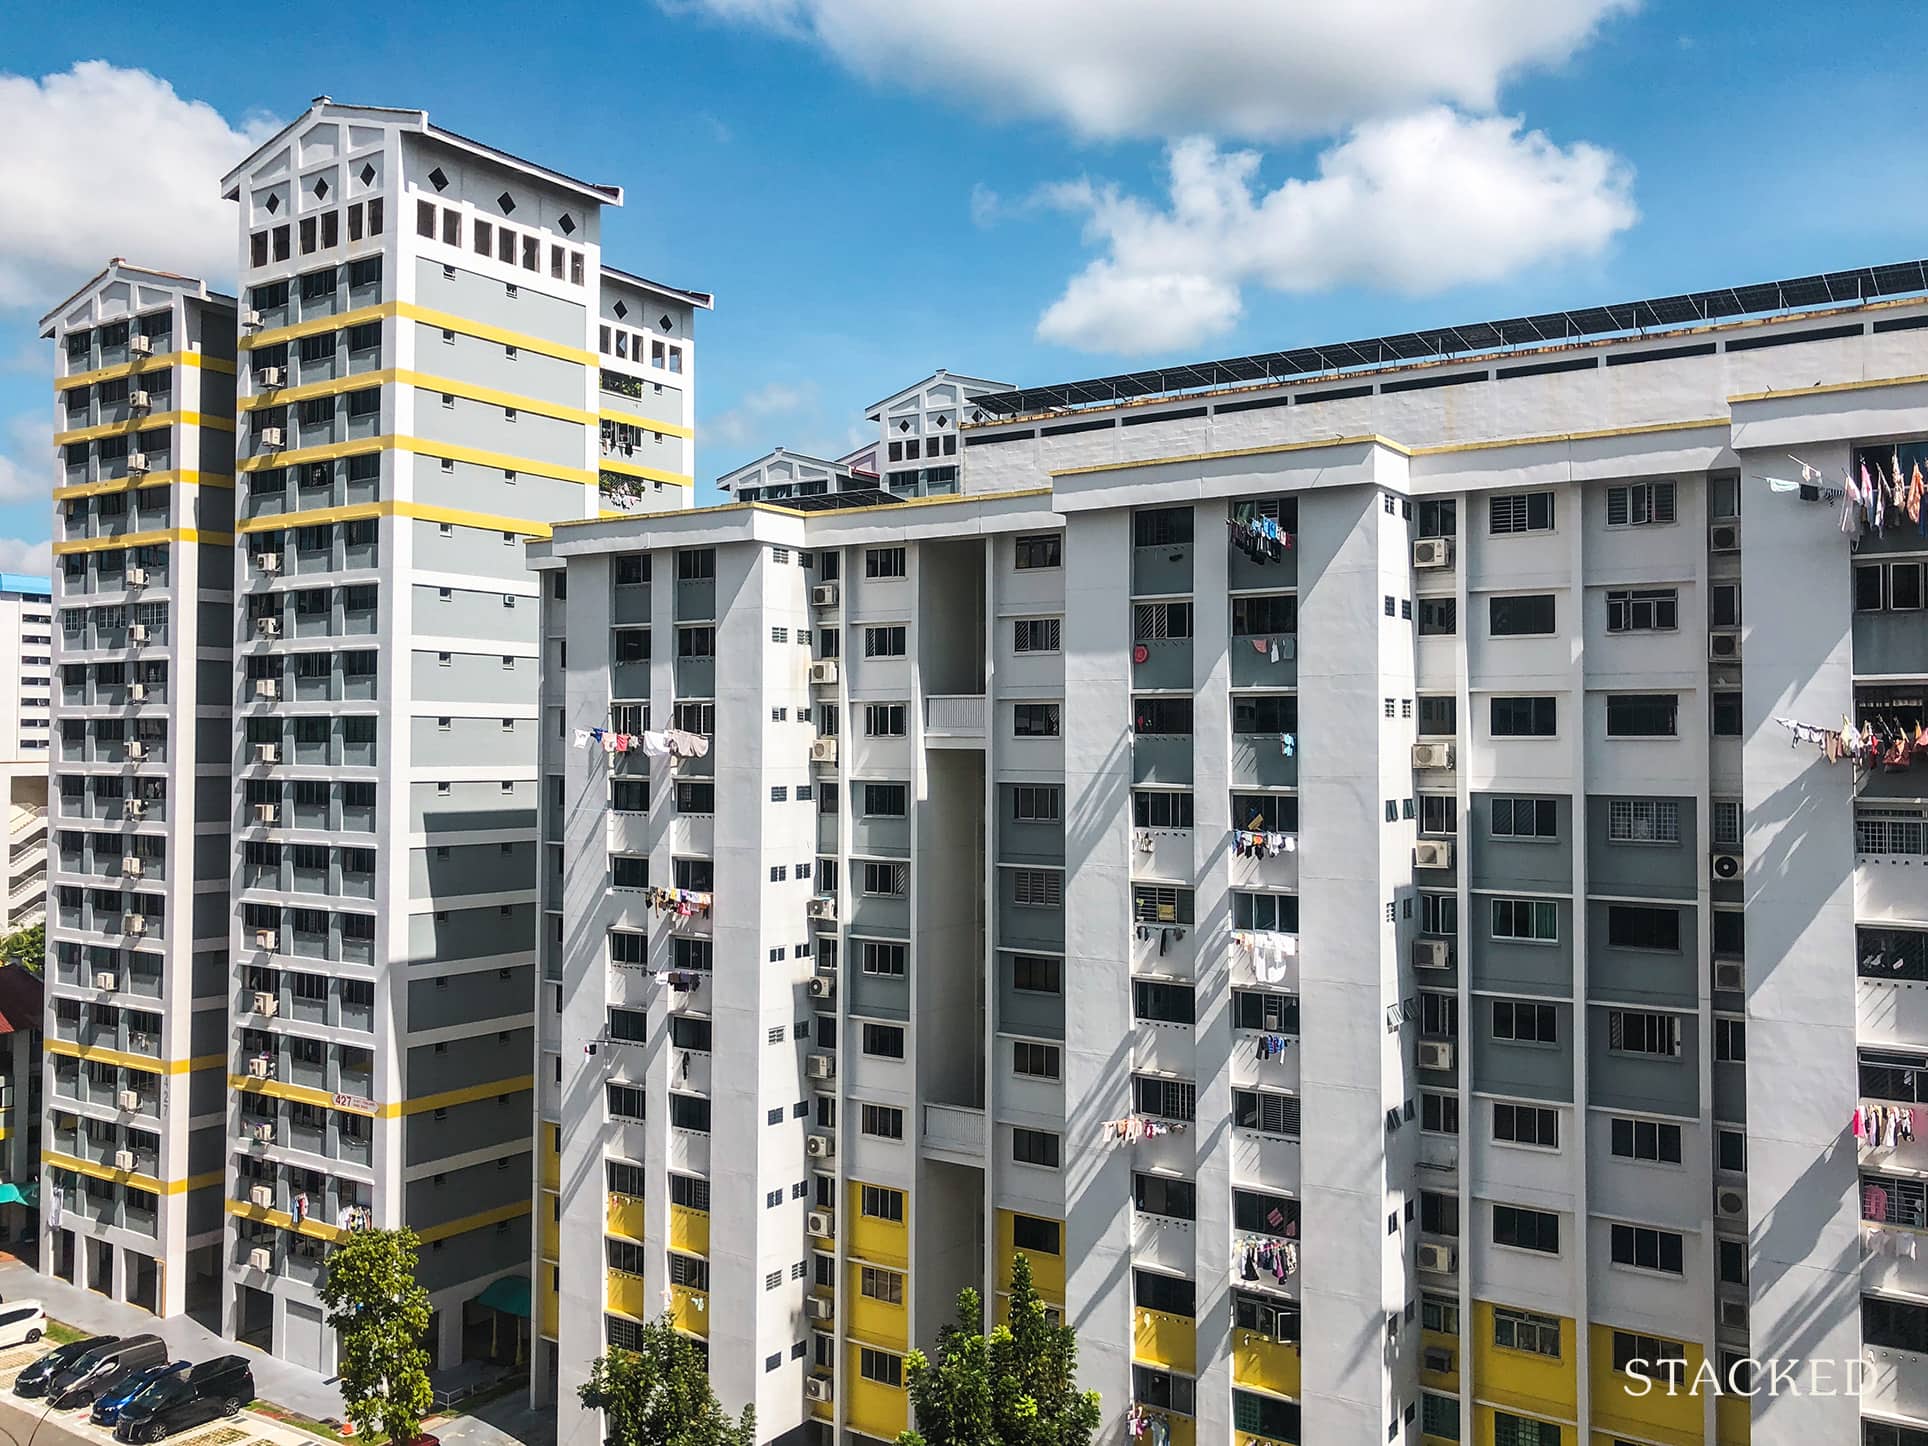
This is a question that has come to the forefront of late. For those looking to upgrade to a condo, there are two counterbalancing factors: higher resale flat prices seem to lower the risk of negative cash sales; but at the same time higher interest repayments might mean drawing on more CPF (and hence needing to refund a larger amount). History is sometimes the best teacher, so we looked to the past to see when negative cash sales most tended to happen:
Important details about the following simulations
For all of the following, we assumed the worst-case scenario. That is, the maximum HDB loan*, coupled with maximum CPF usage (i.e., inclusive of the stamp duties, down payment, and monthly loan repayment).
Next, we assume that the buyer sells after 5 years. We are aware that prior to 2010, the MOP was different – but for simplicity, we’ll keep our simulation to selling from the 5th year onwards.
Do note that scenarios depict an HDB loan of 90 per cent of the flat price, because loan curbs had not yet been implemented. This was changed to 85 per cent after the December 2021 cooling measures, and for HDB flats purchased on or after 30th September 2022, the maximum loan is only 80 per cent.
In addition, you will see from the simulation that it matters when buyers made their sale or purchase along the property cycle. As you might expect, buying during periods of high prices bring the highest risks of negative cash sales as it takes time for the property market to go to greater heights.
*In practice it’s uncommon for anyone to get the maximum HDB loan, as you can only set aside up to $20,000 in your CPF when buying a flat; anything else must be used for the down payment. As such, most buyers pay more than the minimum down payment.
Note: Full data (interactive table) is available here.
Notable points for buyers between 1990 to 2017
We looked at 3-room, 4-room, 5-room, and Executive flats for these years since this is when data is available to us and it stops at 2017 as those who bought in 2018 would only reach their first MOP this year.
For 3-room flats
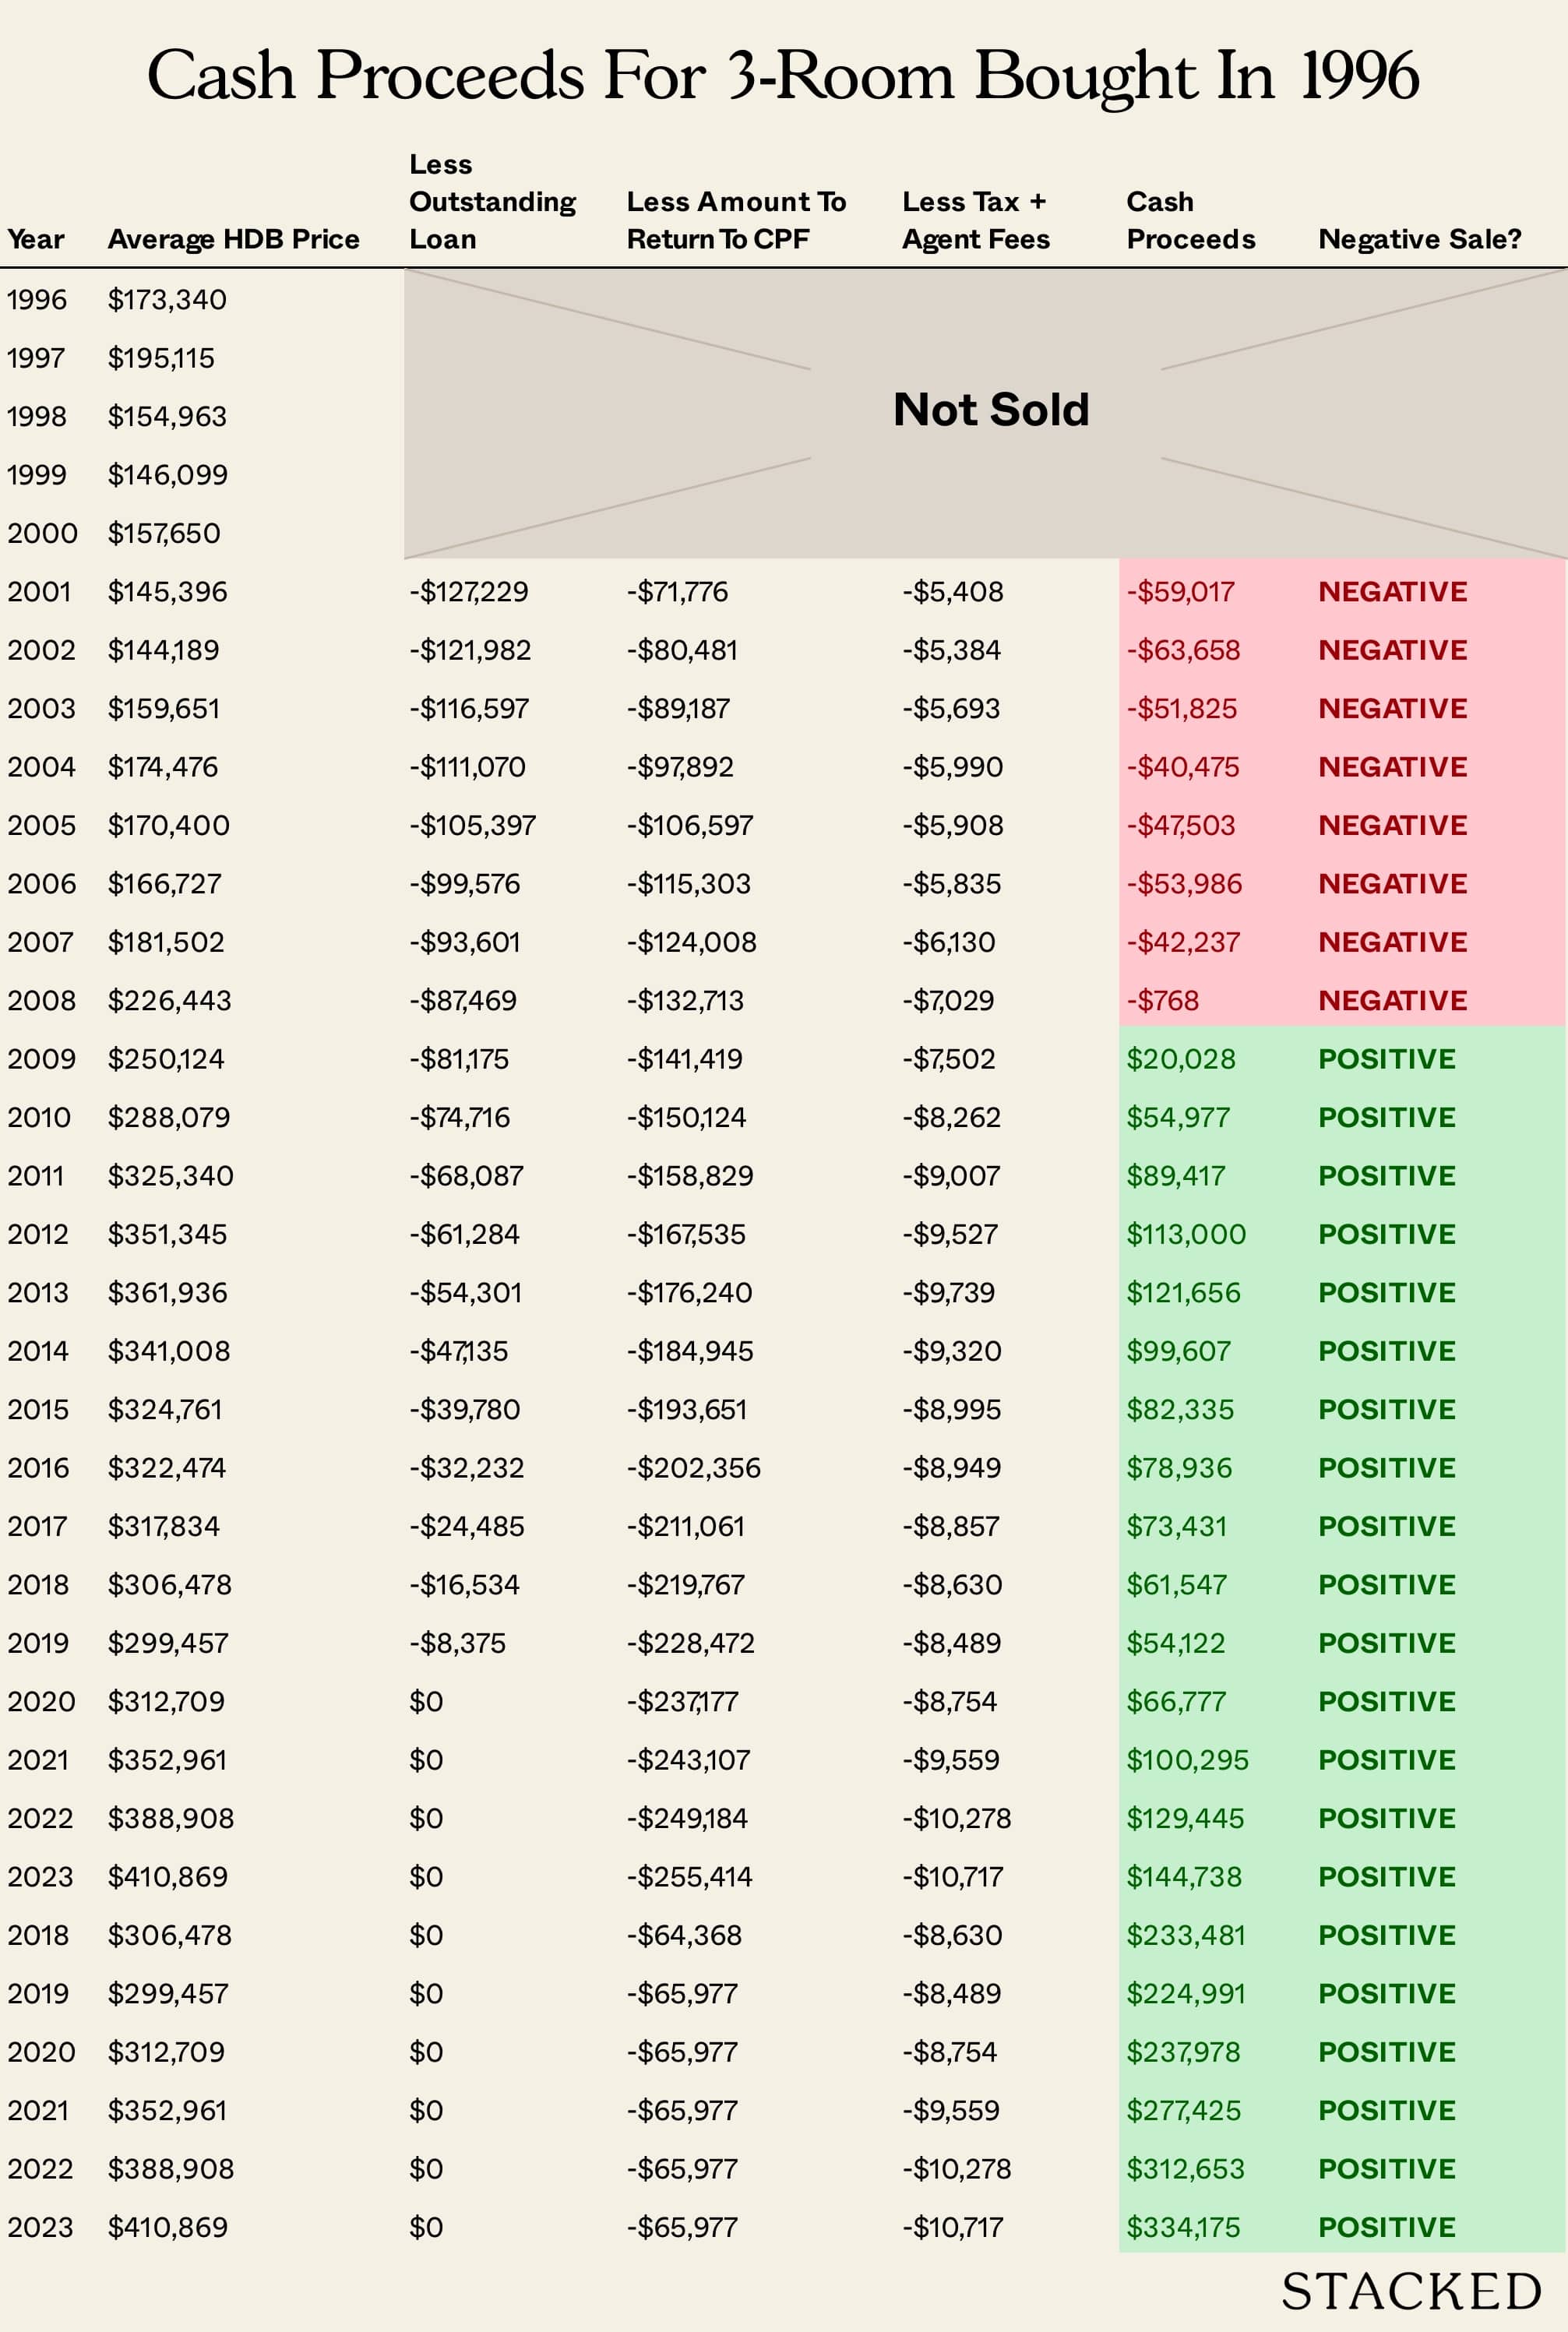
There were two “problem spots” for 3-room flats. These were from 1996 to 1997 (Asian Financial Crisis), and 2012 to 2013 (the last peak for resale flat prices, so they would have bought at a high price).
Here’s what your cash on hand would look like if you had bought around 1996-1997 and sold in the subsequent years (negative cash leftover implies a negative cash sale).
If you had bought a 3-room flat in 2012:
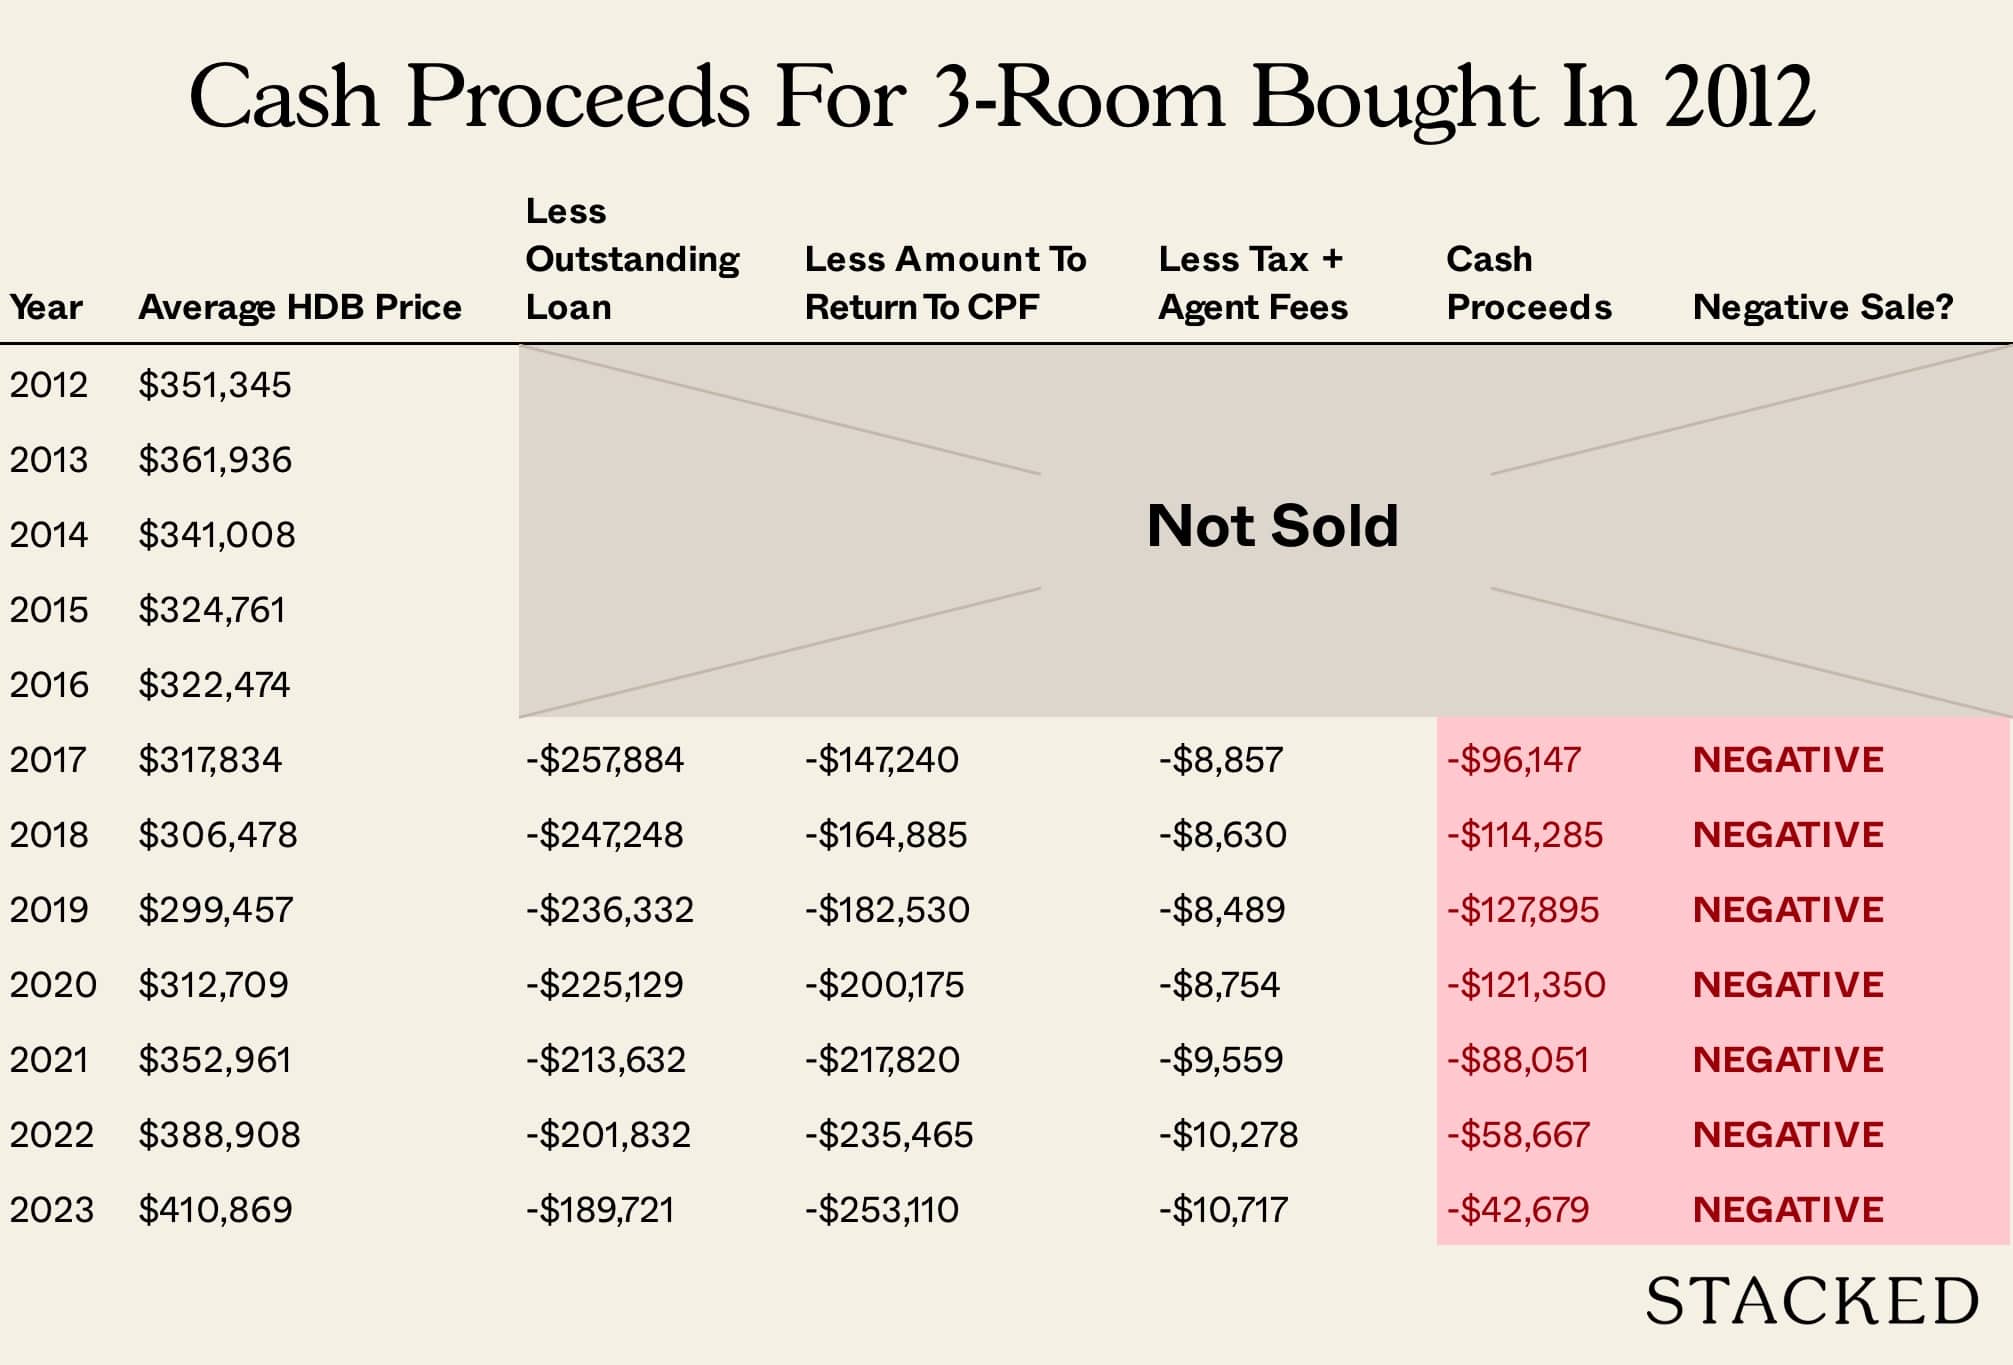
The findings here will probably surprise no one: those who bought just before the Asian Financial Crisis would have to wait around 12 years to escape the risk of negative cash sales, while those who bought between 2011 to 2014 might still face negative cash sales today.
For 4-room flats
With regard to 4-room flats bought in 1995, selling between 2000 to 2007 would have resulted in a negative cash sale. For those bought in 1996, selling between 2001 to 2010 would have resulted in a negative cash sale.
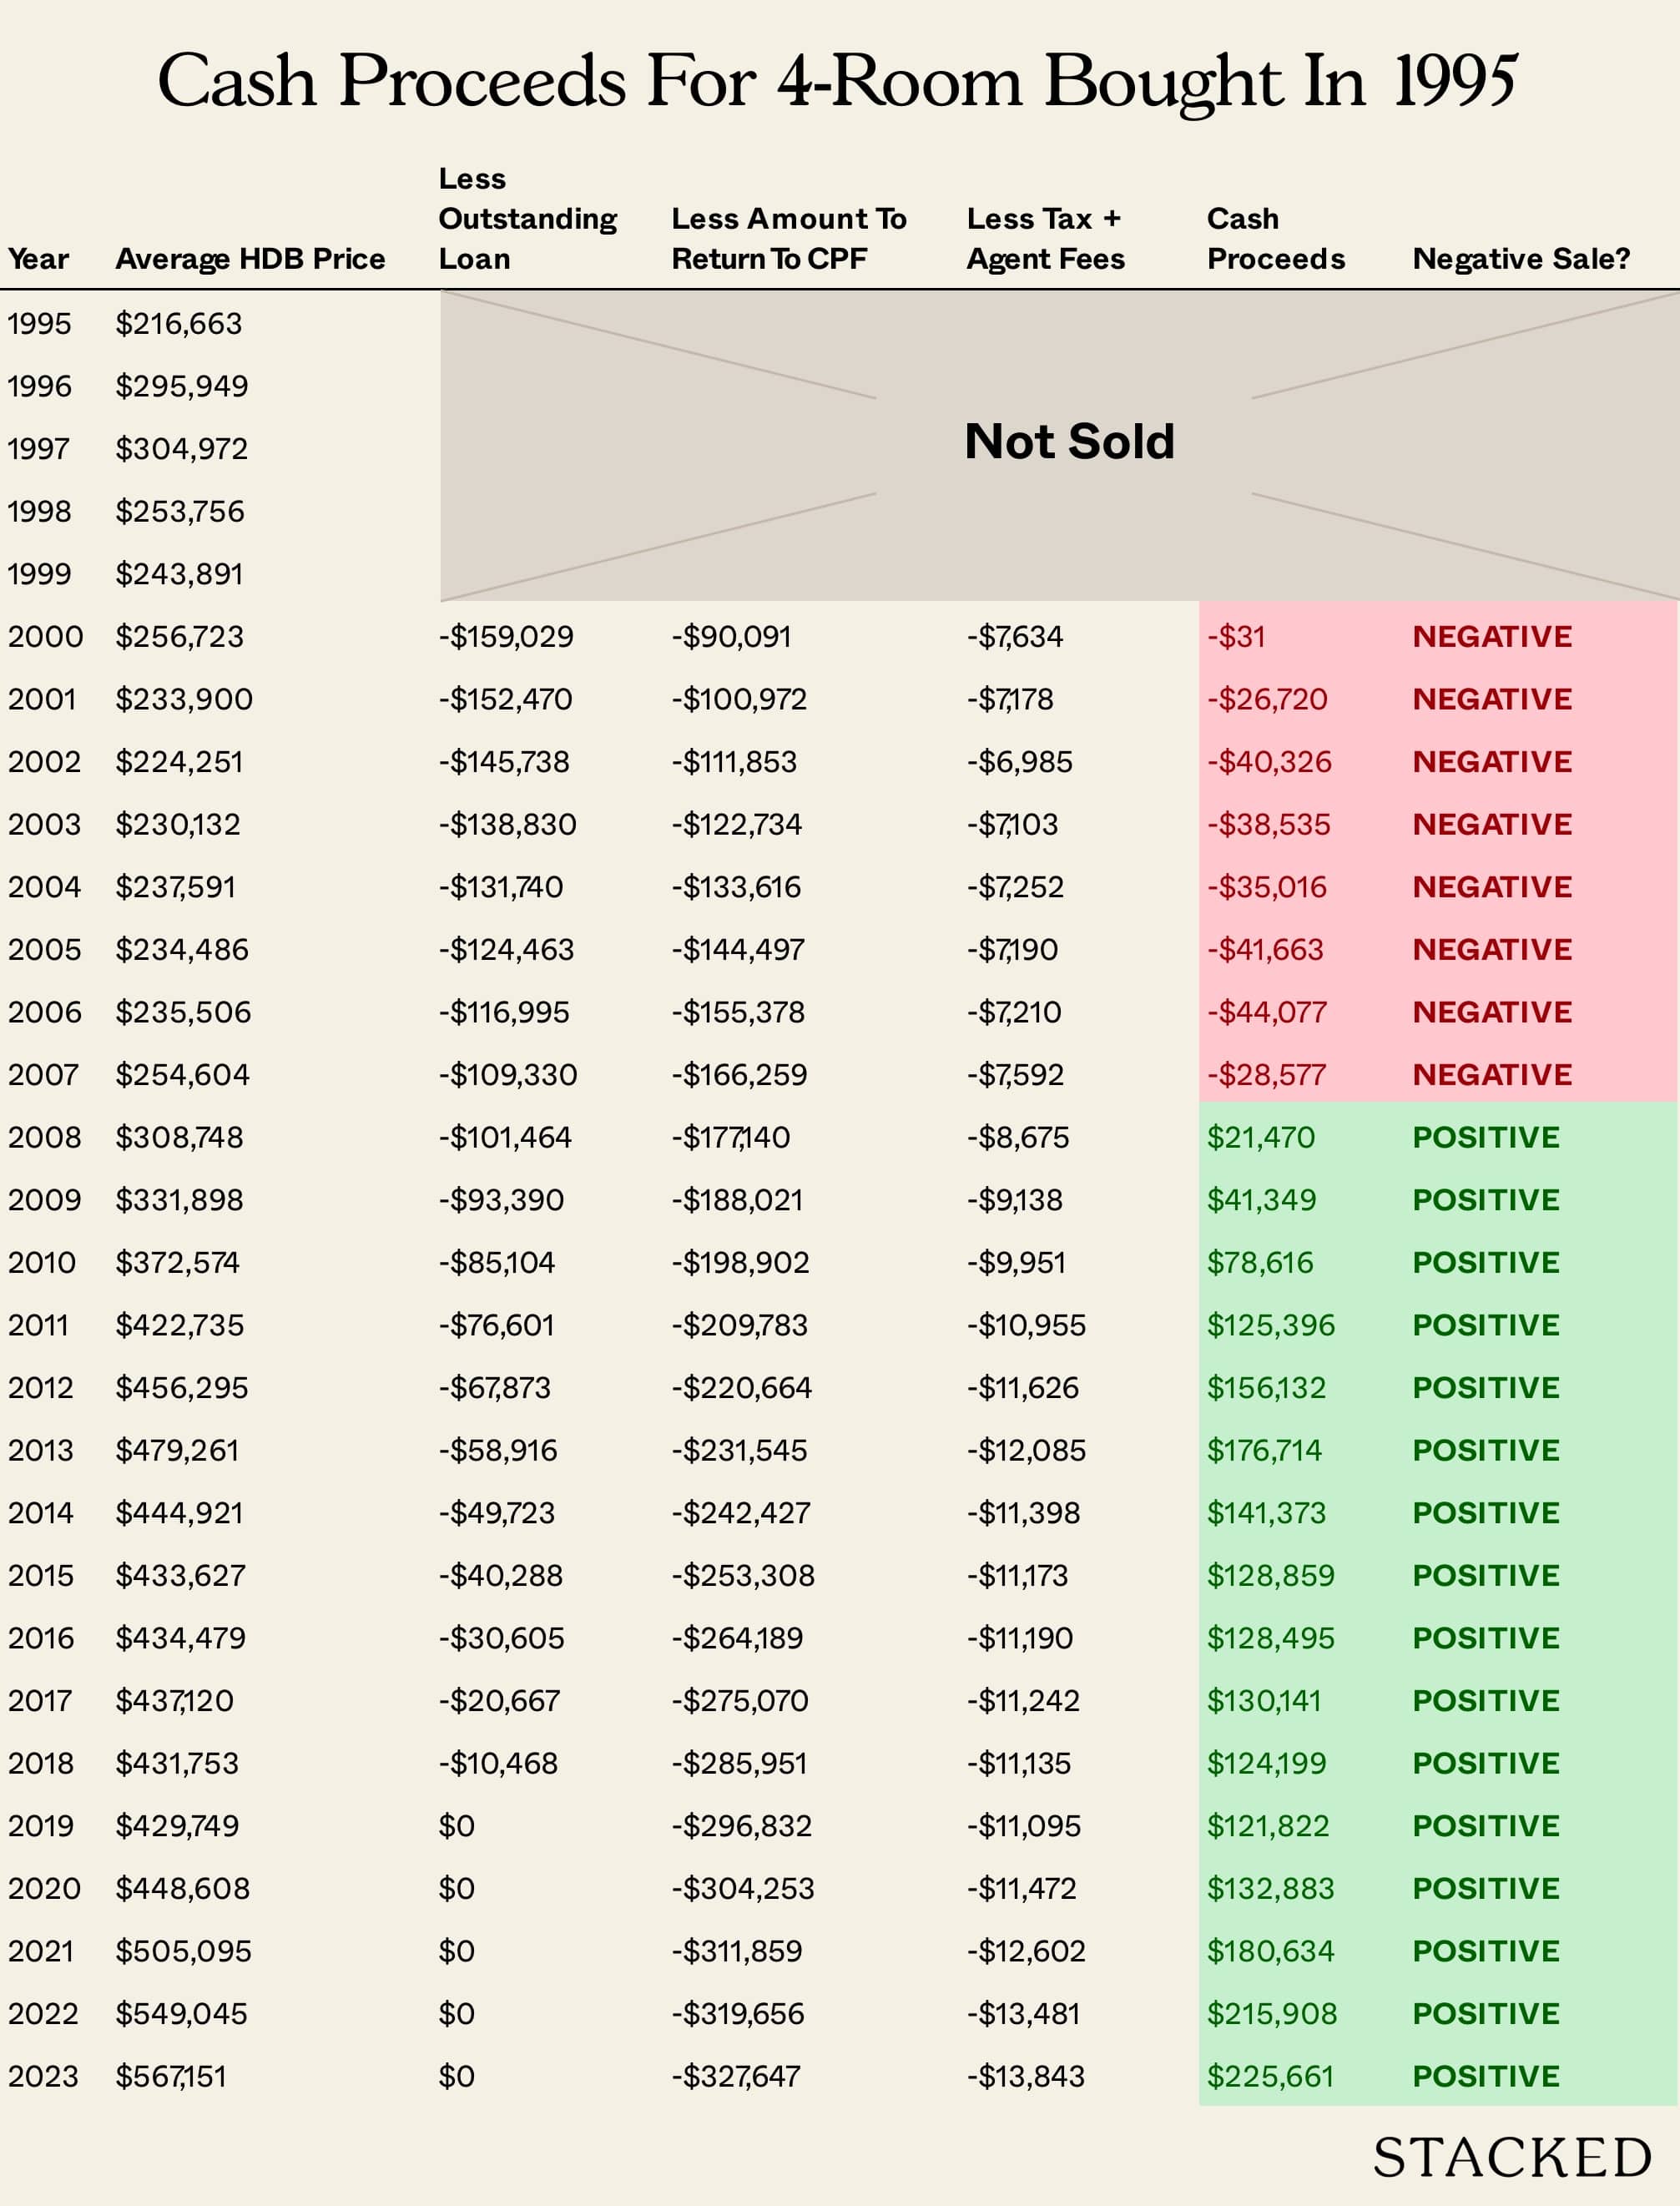
Buying between 2012 and 2017, there was potential for a negative cash sale for at least one of the years:
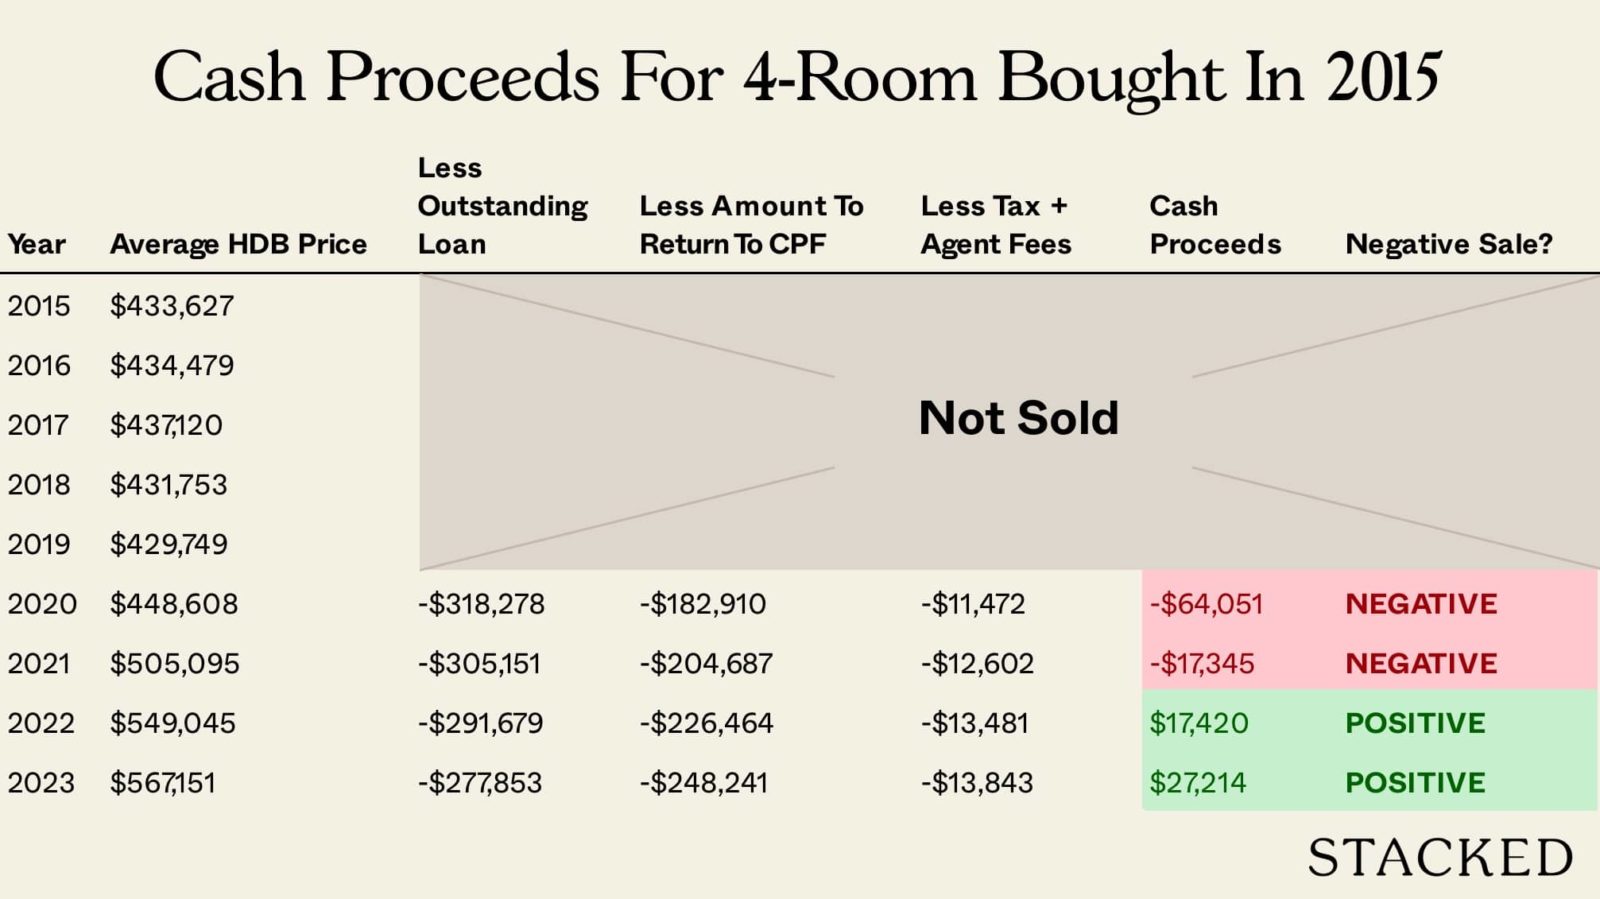
Most negative cash sales were due to the 4-room flats appreciating too slowly, and the sale proceeds being less than what you’d need to refund into your CPF. Do note that the transactions were still profitable though.
2003 to 2009 seems to have been the best period; if you had bought then and waited 5 years before selling, there would be no negative cash sales:
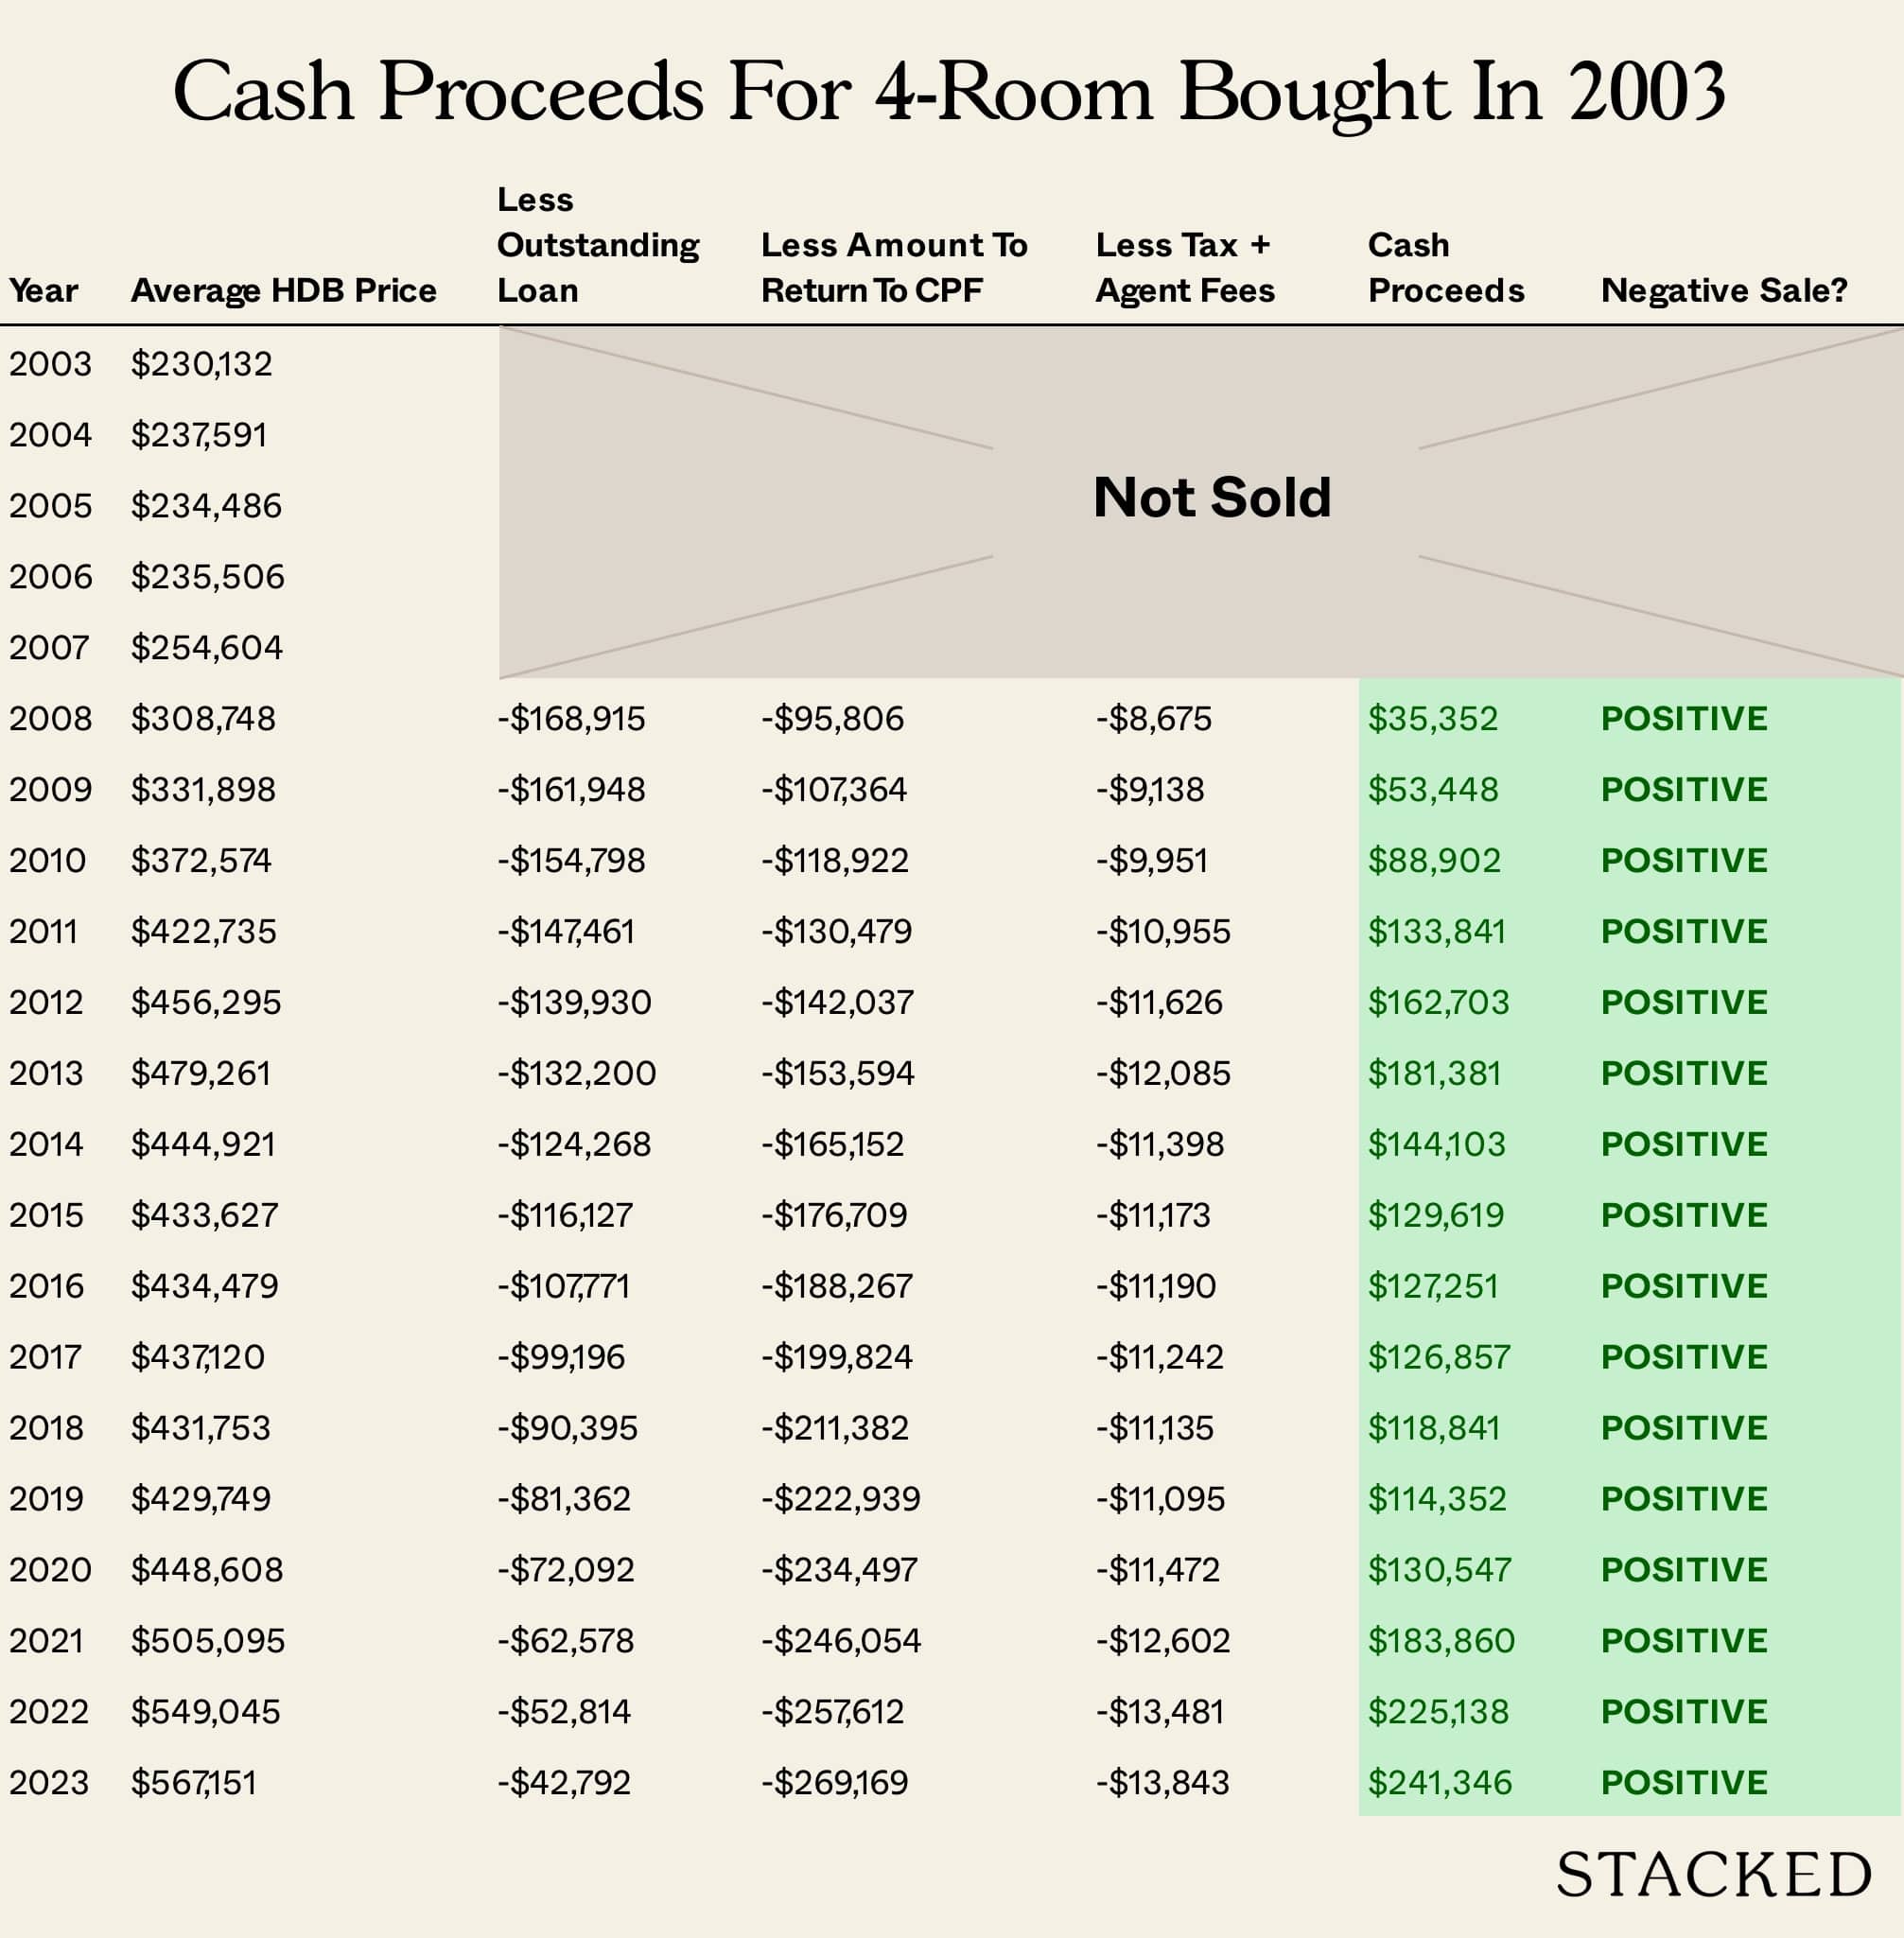
The most important finding could be that those who bought in 2012 or 2013, the last peak for flat prices, could still face negative cash sales despite the high prices today (although the risk steadily decreases as resale flat prices continue to increase).
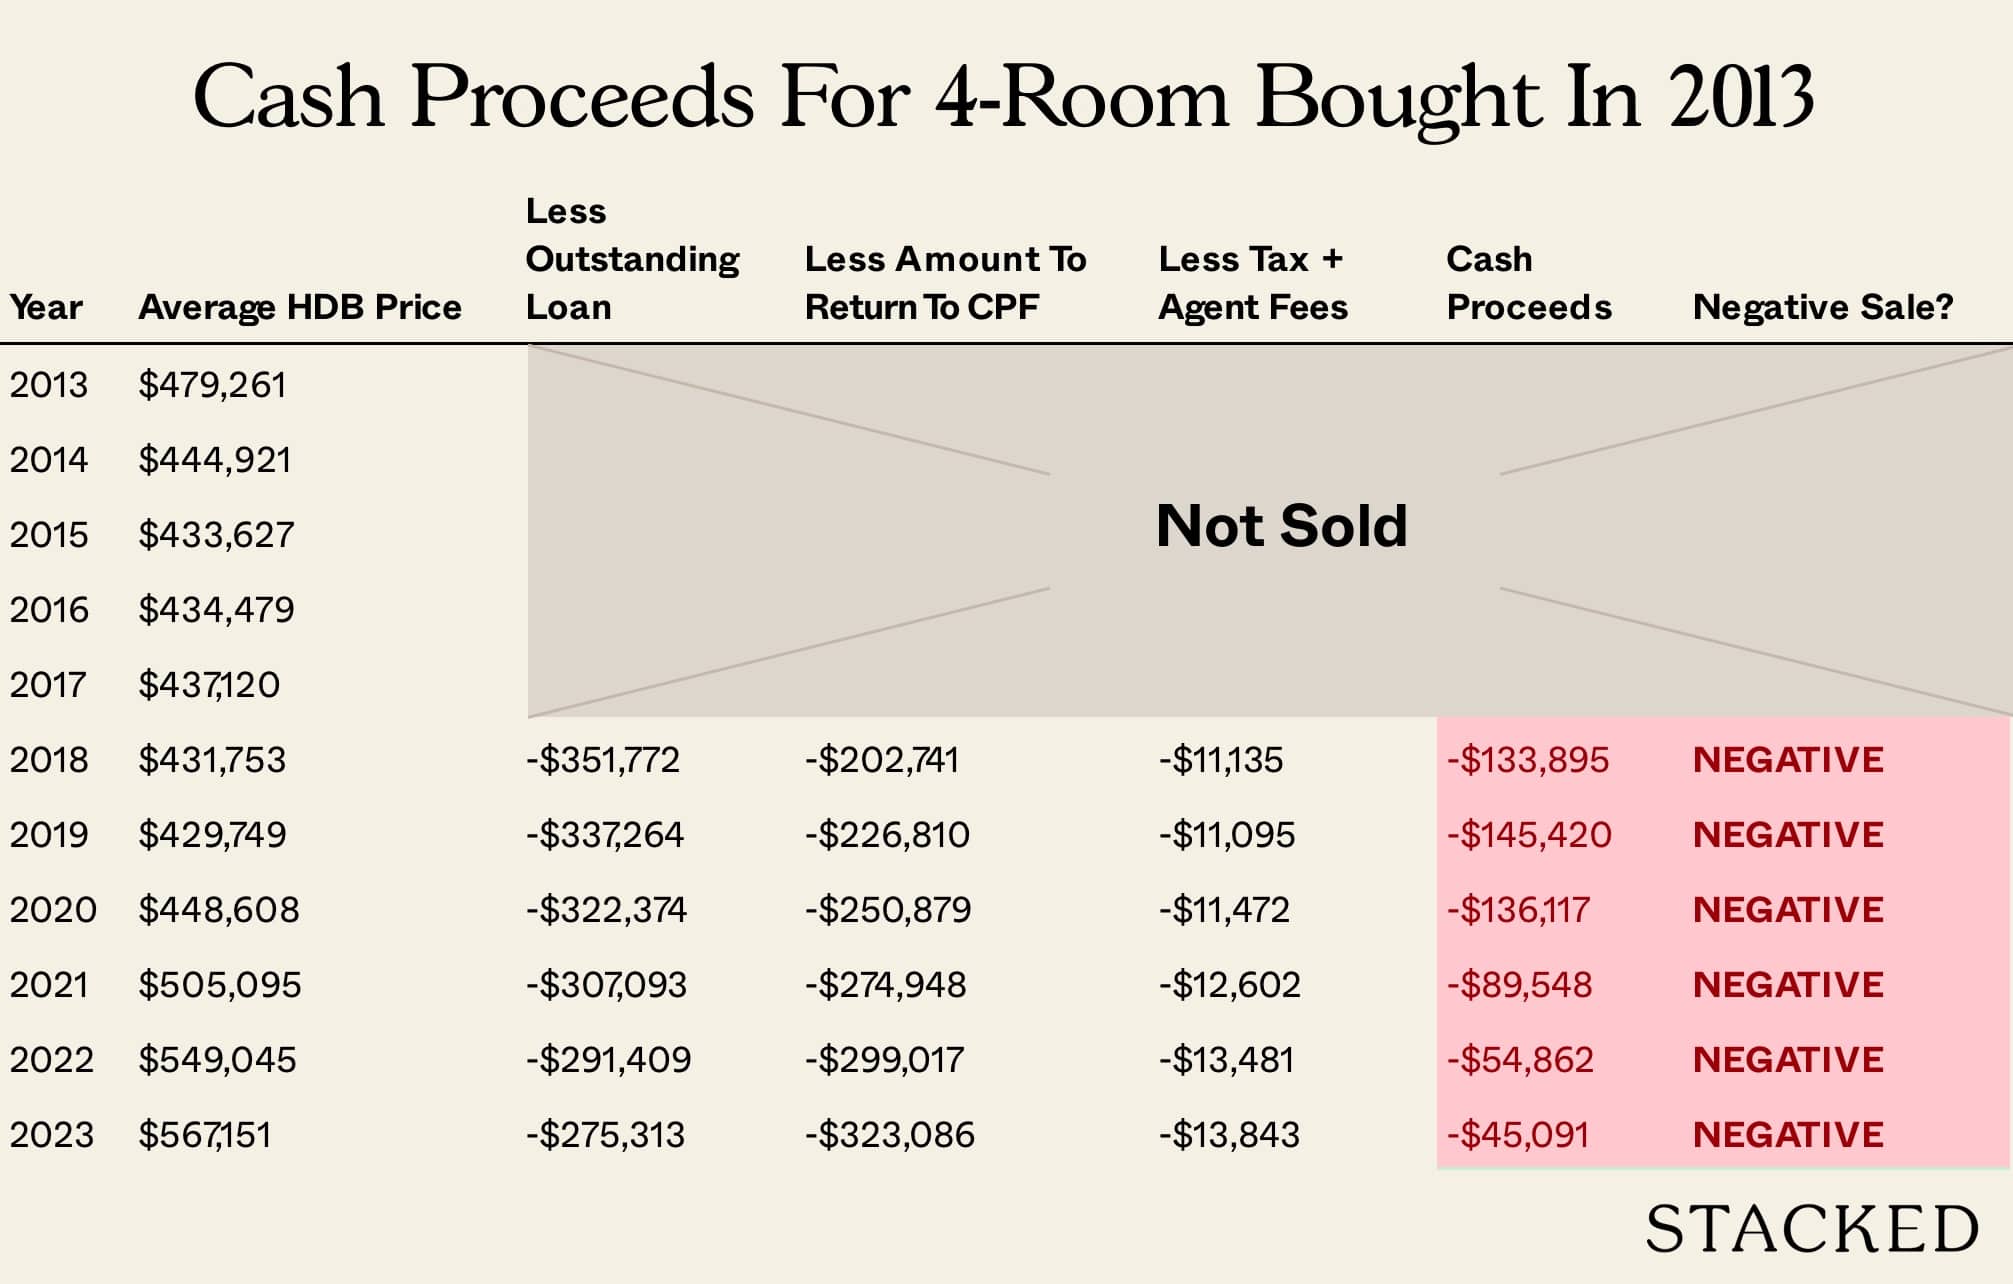
Those who bought their flats in 2014 or later are at low risk of seeing negative cash sales this year.
For 5-room flats
Compared to 4-room flats, there were longer periods in which buyers saw the risk of a negative cash sale. This is likely due to the higher overall prices of 5-room flats, coupled with a lower rate of appreciation.
For example, 4-room flats averaged $216,663 in 1995, while 5-room flats averaged $341,533.
By 2022, 4-room flats averaged $549,045, while 5-room flats averaged $654,330.
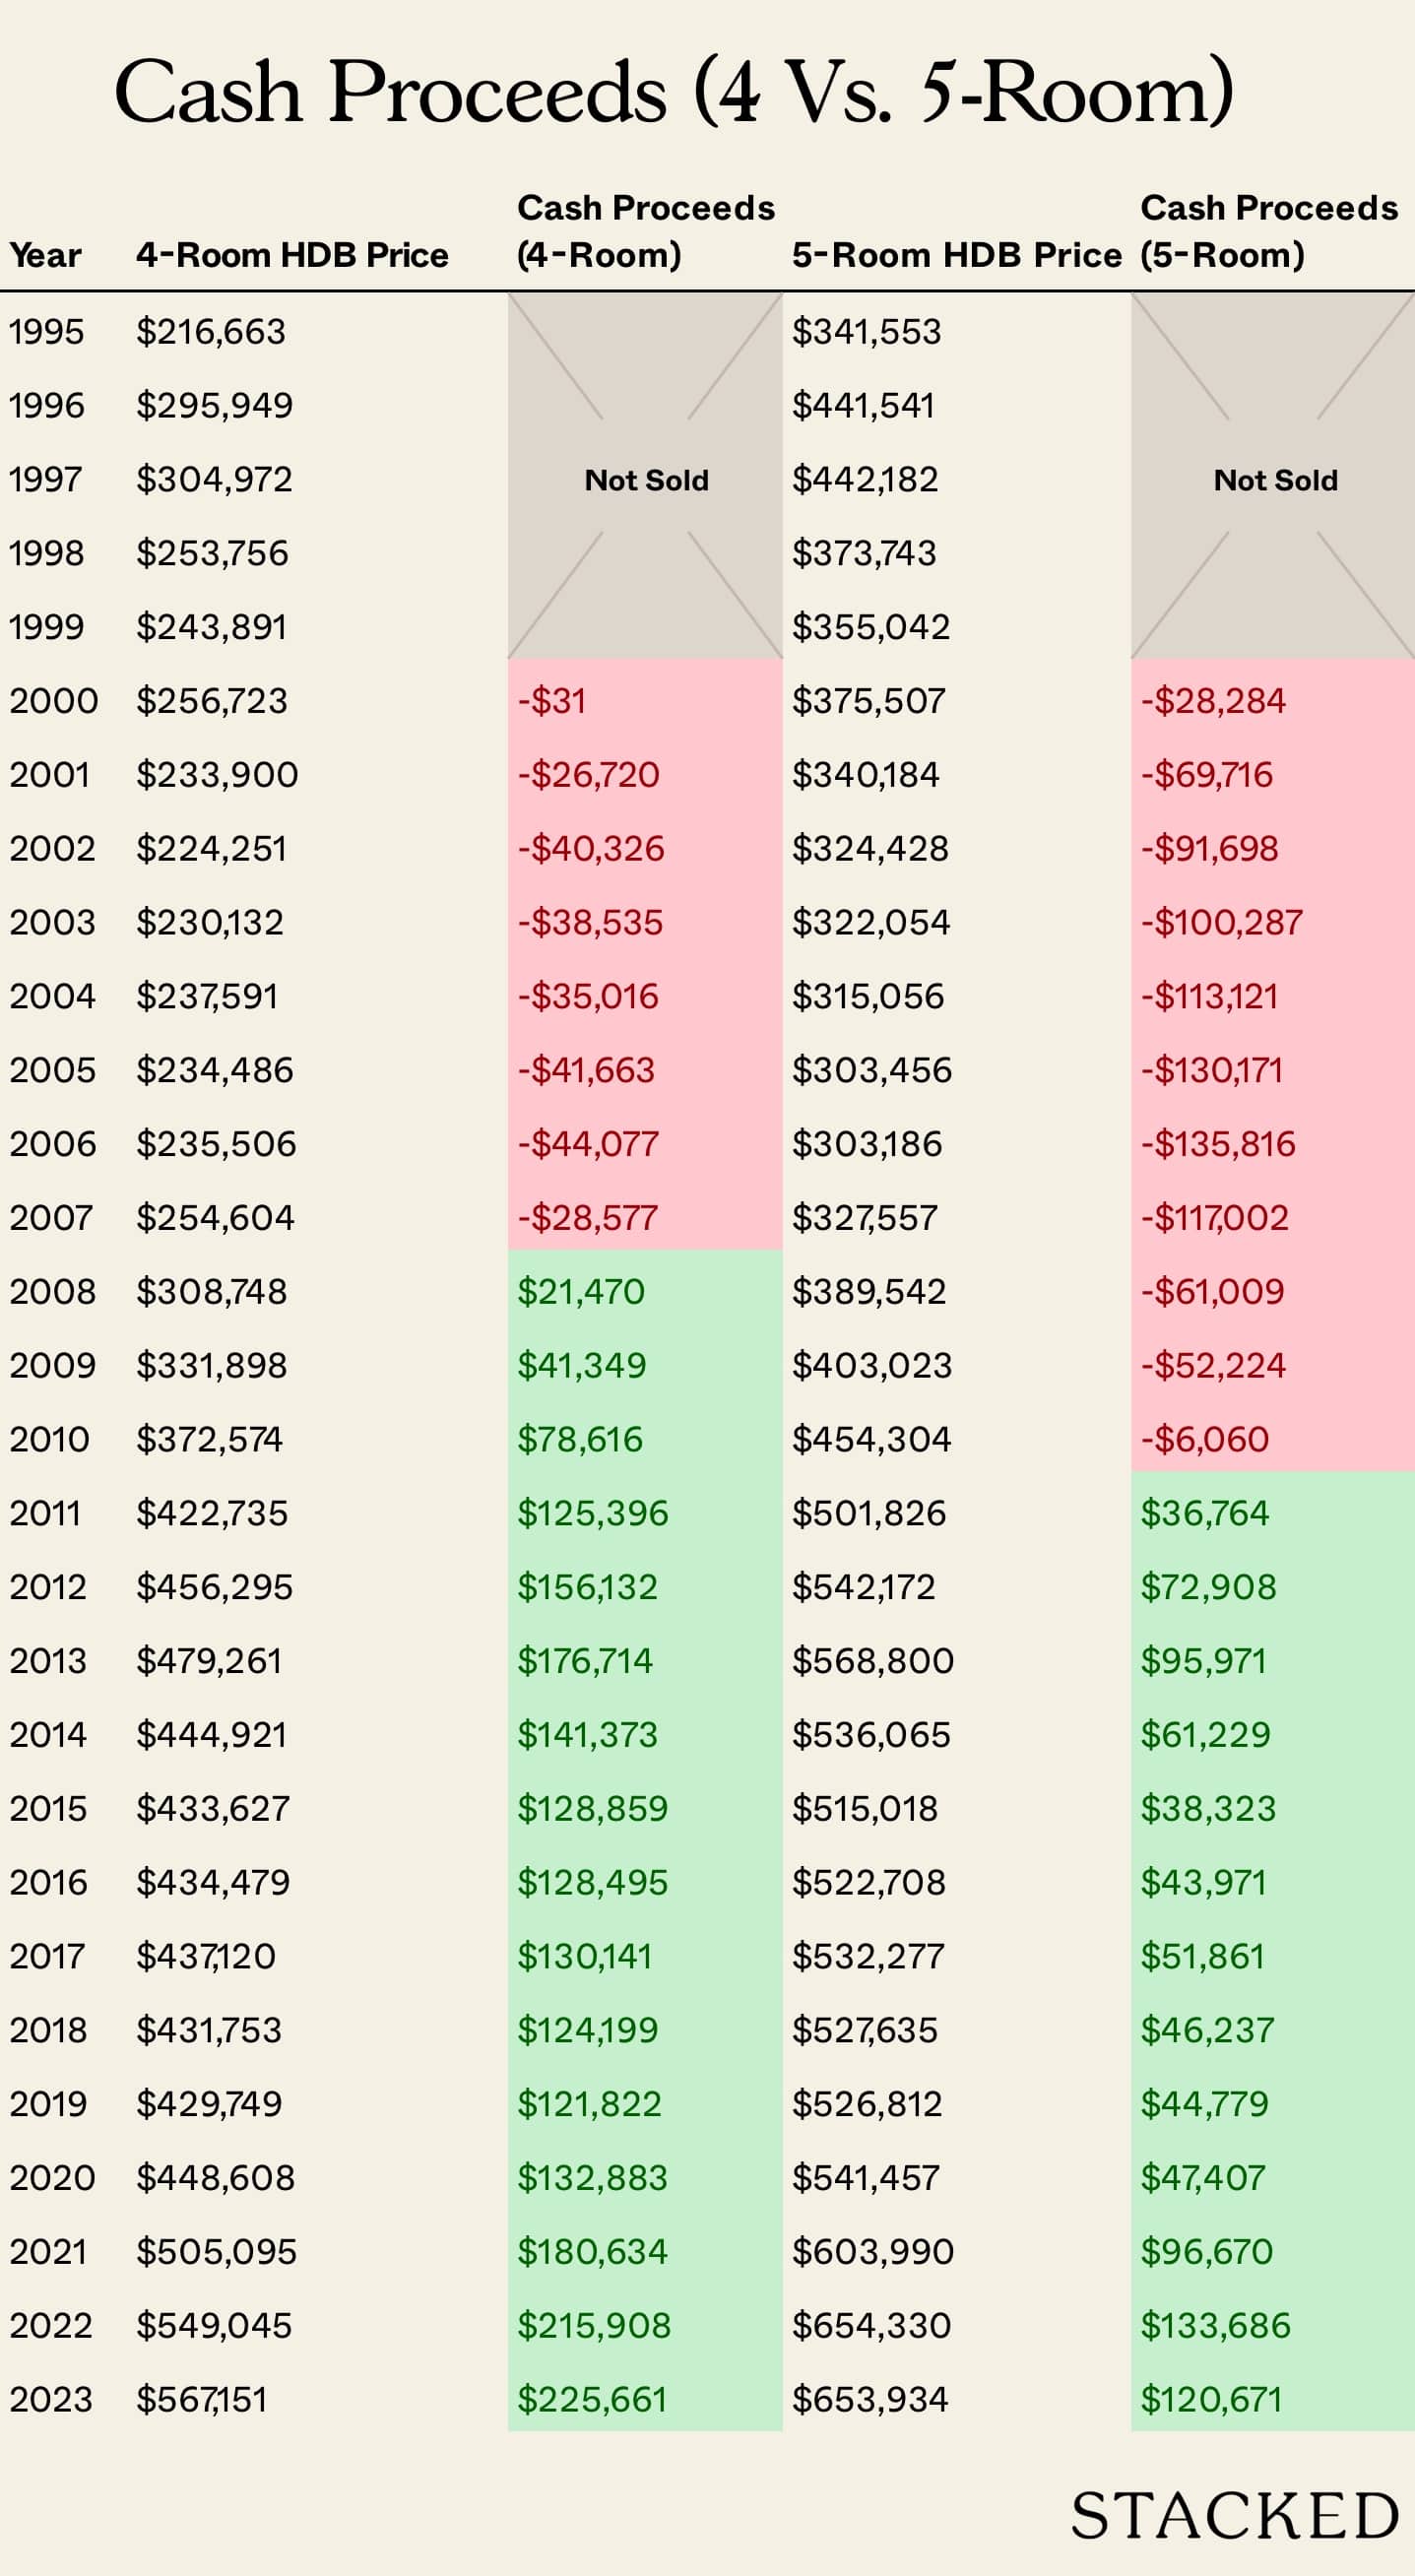
Despite the large price gap between 4-room and 5-room flats, it is 4-room units that show much higher appreciation; note that over this time period, 4-room flats appreciated by around 153 per cent, while 5-room flats appreciated by around 91 per cent.
What a difference a year makes
Notice how the average prices in 1995 were so different from those in 1996?
To put into perspective, average 5-room flat prices in 1996 costs almost 30% more than a year ago!
Due to the Asian Financial Crisis, prices took a long time to recover. 4-room flats also saw a sharp price increase, however due to the greater appreciation and lower quantum, buyers of both flats faced negative cash sales over very different periods.
More from Stacked
We Make $15k Per Month And Own An Executive Apartment In Queenstown: Should We Keep It Or Sell To Upgrade To A Condo?
Hi Stacked Homes! You guys are an amazing trove of information for all things related to home buying/selling, with articles that…
5-room flats bought in 1996 could see negative cash sales up until last year (2022), whereas a 4-room counterpart would probably have stopped seeing negative cash sales from 2011 onward:
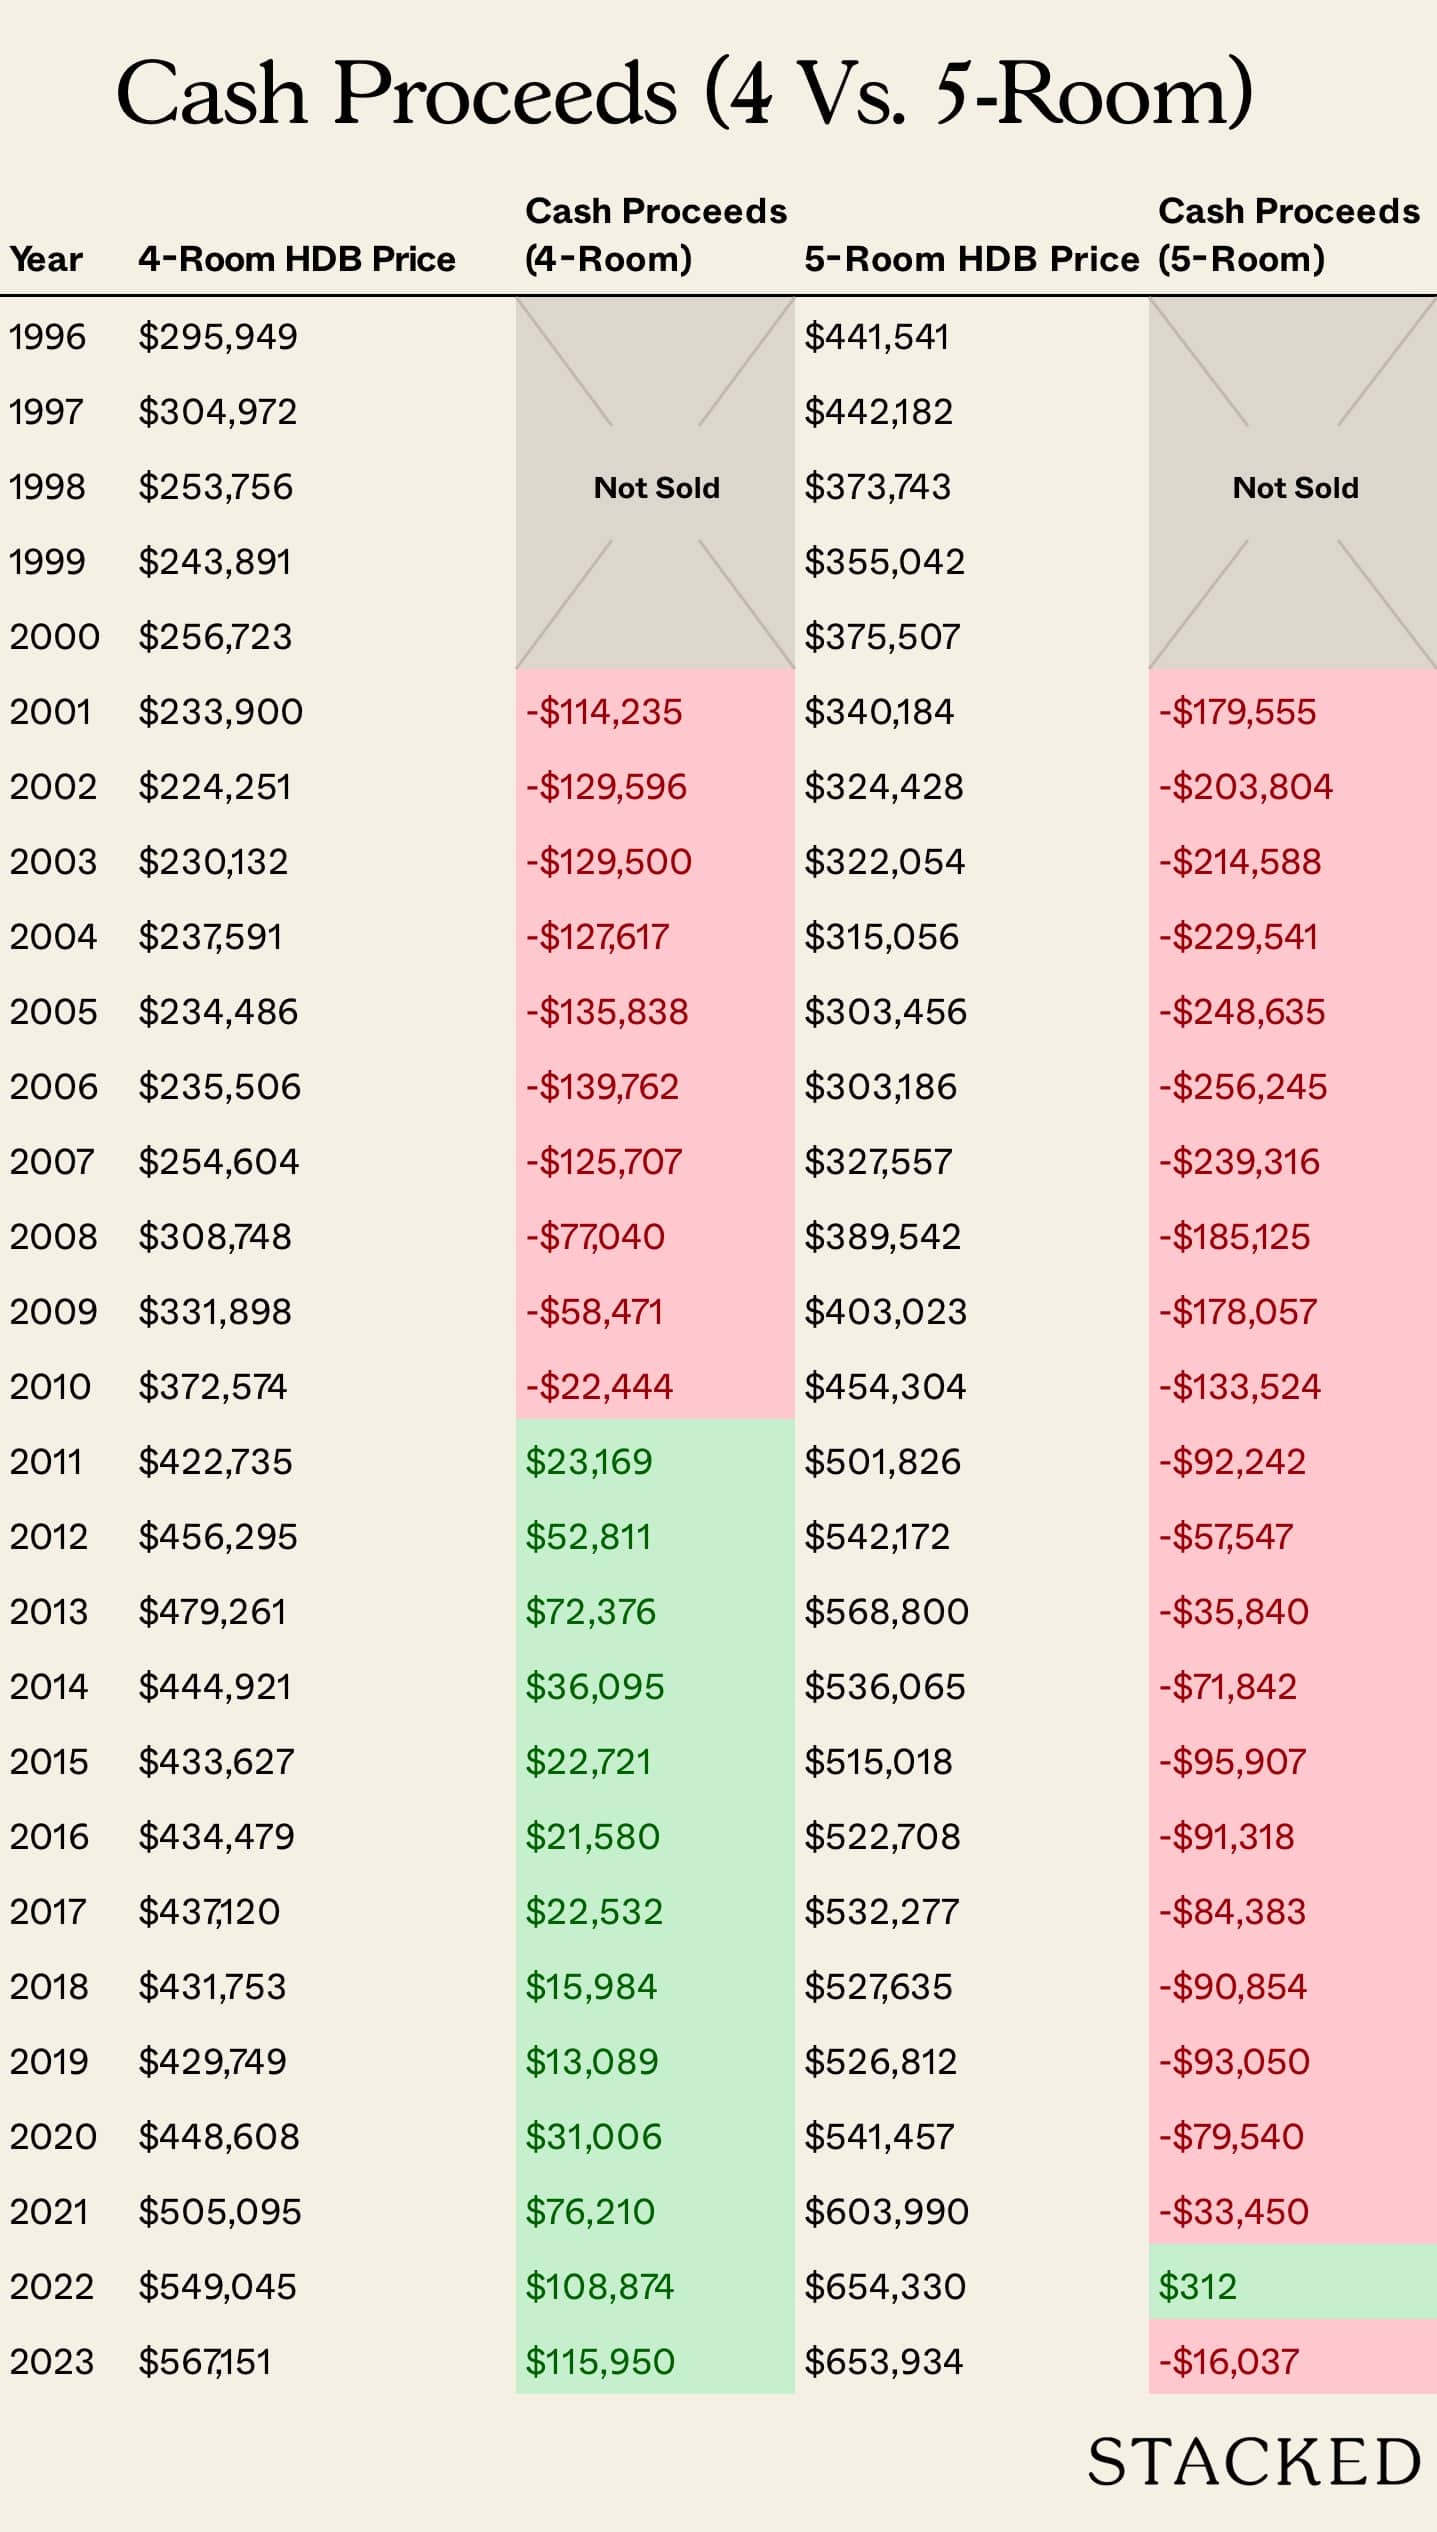
Those who experience negative cash sales for their 5-room flats are thus likely to be those who bought prior to the Asian Financial Crisis, and who made heavy use of CPF for the down payment, servicing monthly loans, etc. The same goes for those who bought on another “bad” year in 2012 (the run-up to the last peak).

For Executive flats
As with 5-room flats, a high quantum is a problem. The average EA unit was around $572,772 in 1996. Buyers at this price, who maxed out on CPF usage, would still be facing negative cash sales today:
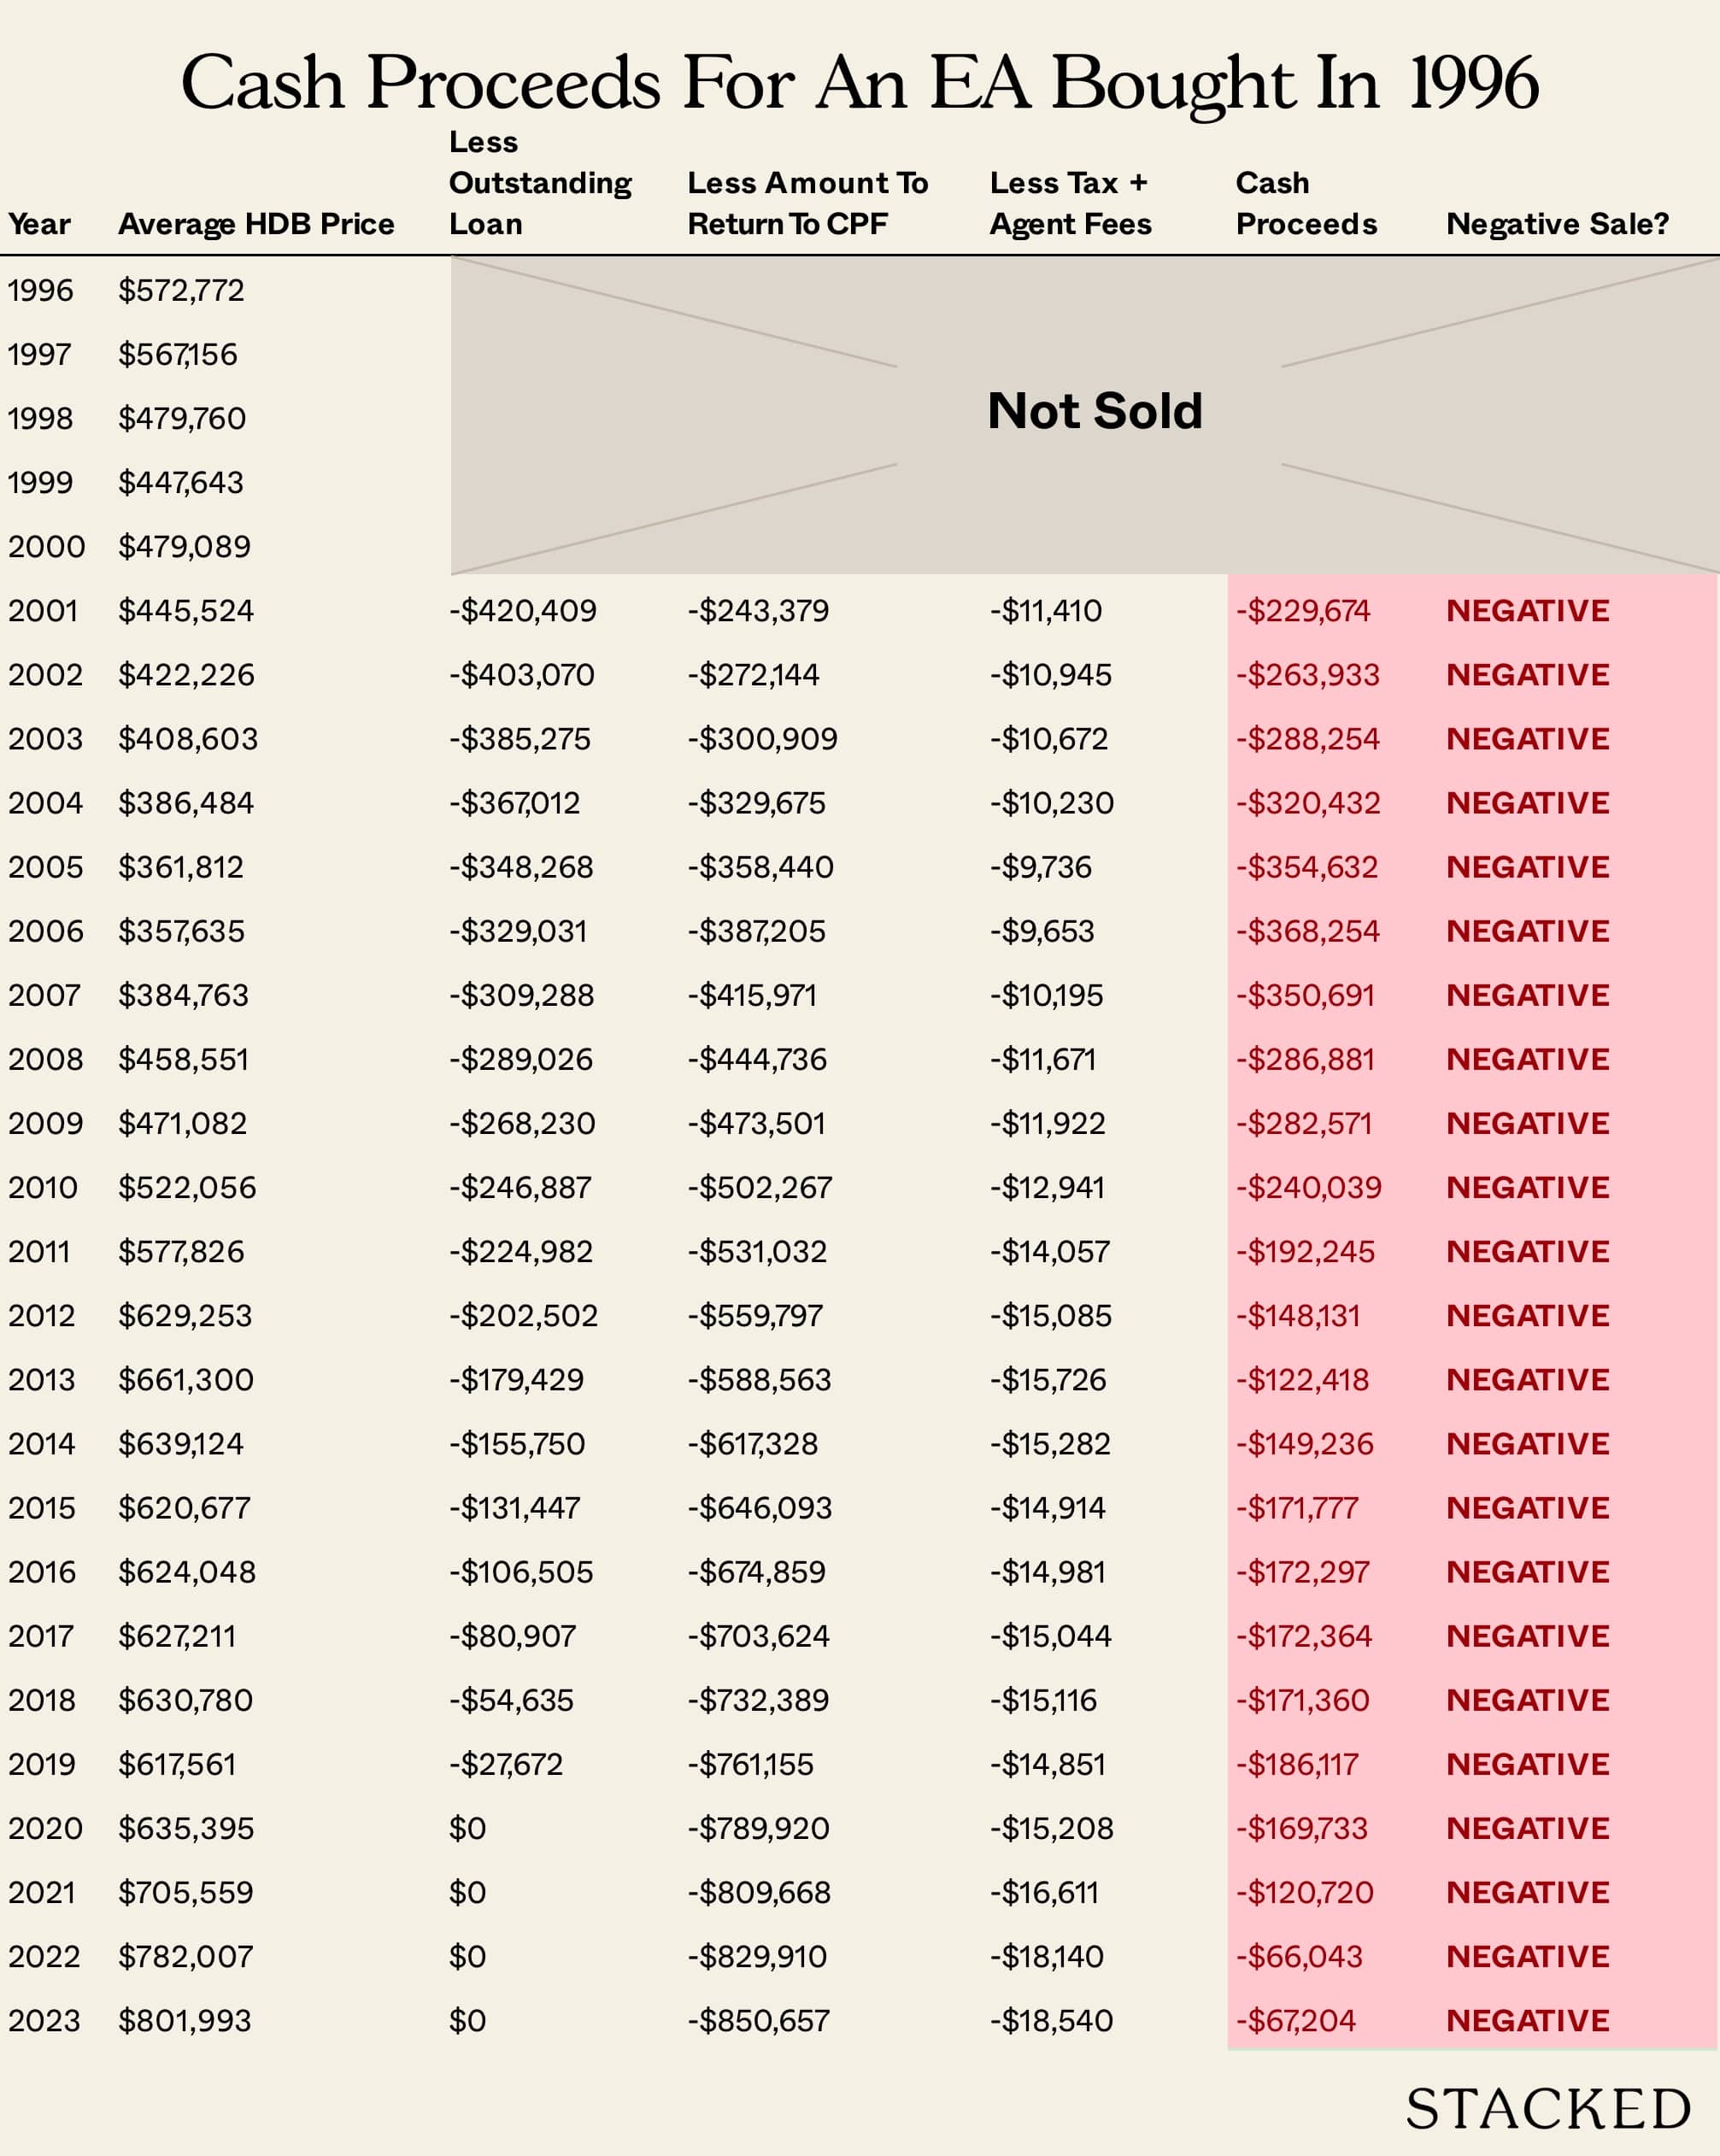
This can also be attributed to EA prices plummeting to an average of around $357,635 back in 2006, a rather large setback for those who bought in the previous decade.
Running the simulation with older flats
Here, we examine the effects of lease decay, with regard to causing a negative cash sale. “Older flats” here were limited to those with a built year of 1992 and earlier (meaning they’re at least 30 years old by now!).
For this simulation, however, note that we have a lower transaction volume to work with, which could slightly skew the results. Also, more of these flats are in mature estates such as Queenstown, Toa Payoh, etc., where demand and appreciation may work differently from other estates.
For older 4-room flats
Like newer counterparts, older flats didn’t escape the Asian Financial Crisis (1996 to 1997). However, things are slightly worse for them:
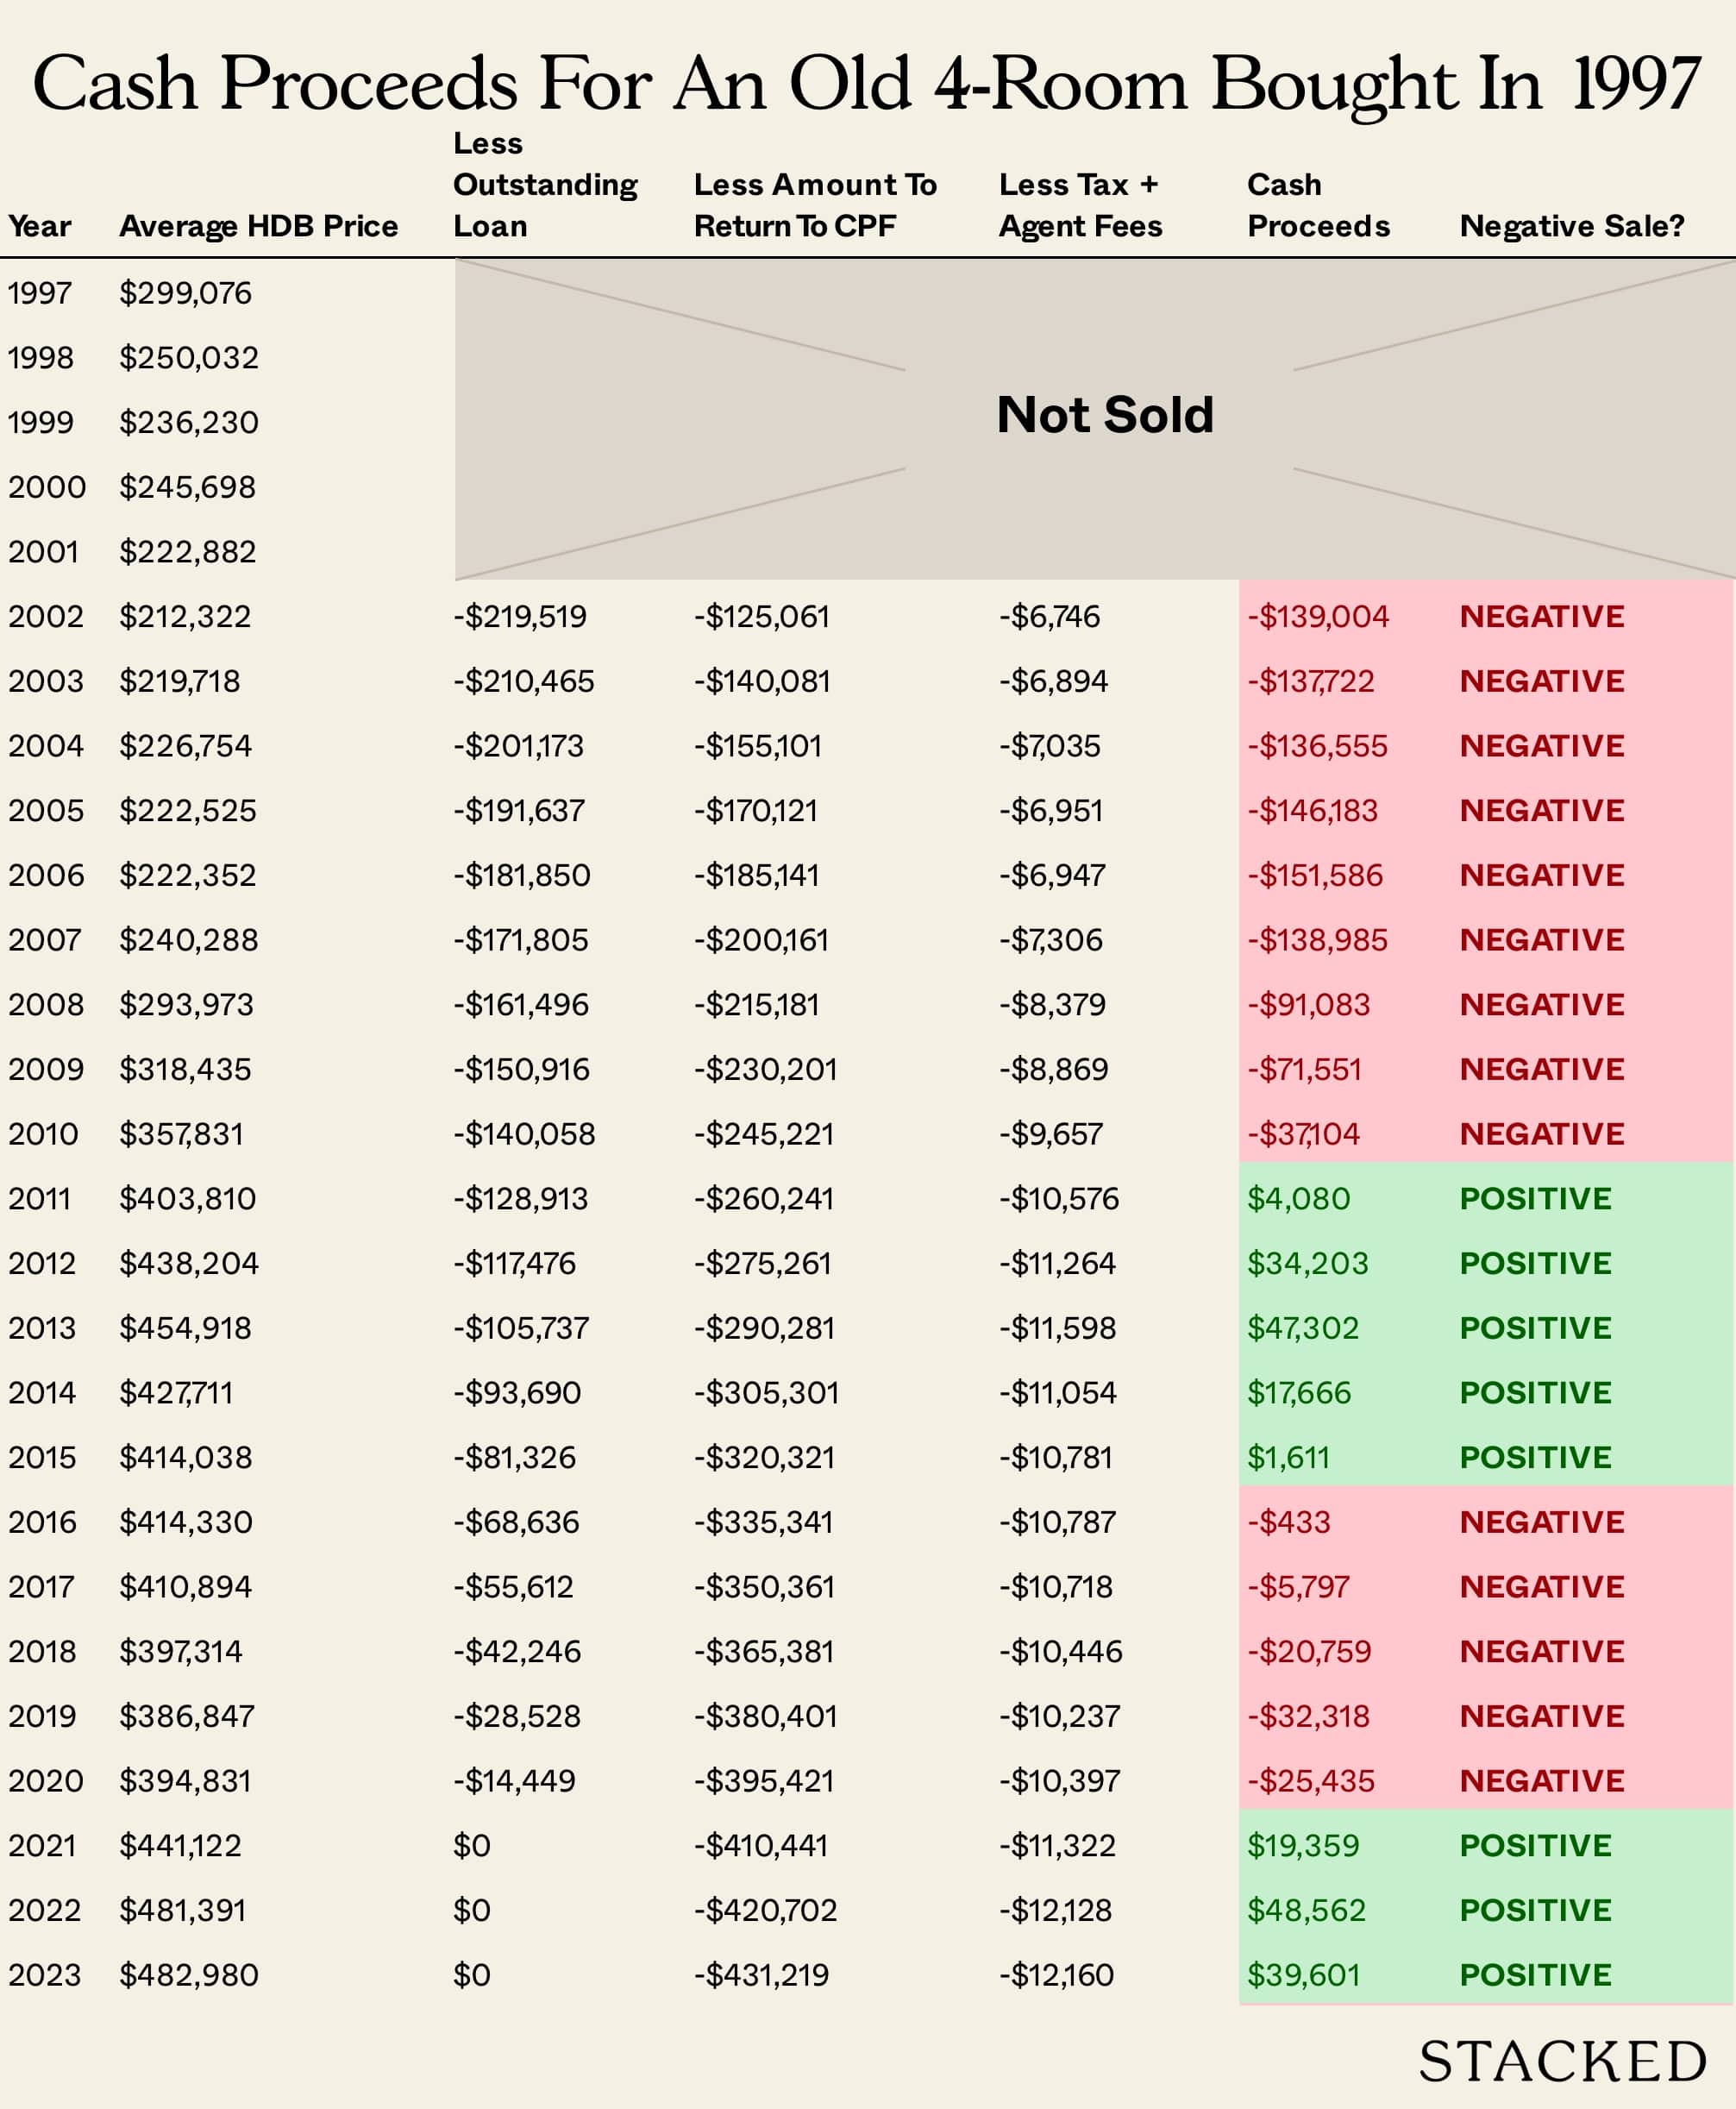
Like newer flats, negative sales were most probable in the stretch from 2002 to 2010. However, older flats would have experienced negative cash sales from 2016 to 2020 as well during the “down” of the property market in that period.
This is not something that we saw with their newer counterparts.
2016 to 2020 saw declining flat prices, which began after measures like the MSR were introduced in 2013 to cool resale prices. If the averages here are true, we might be seeing evidence that during such trough periods, prices of older flats are more adversely affected than newer counterparts.
For buyers from 2011 onward, the bad news is that many may still be in negative cash sale territory up till today. This may indicate that many older flats do not appreciate as well as newer ones:
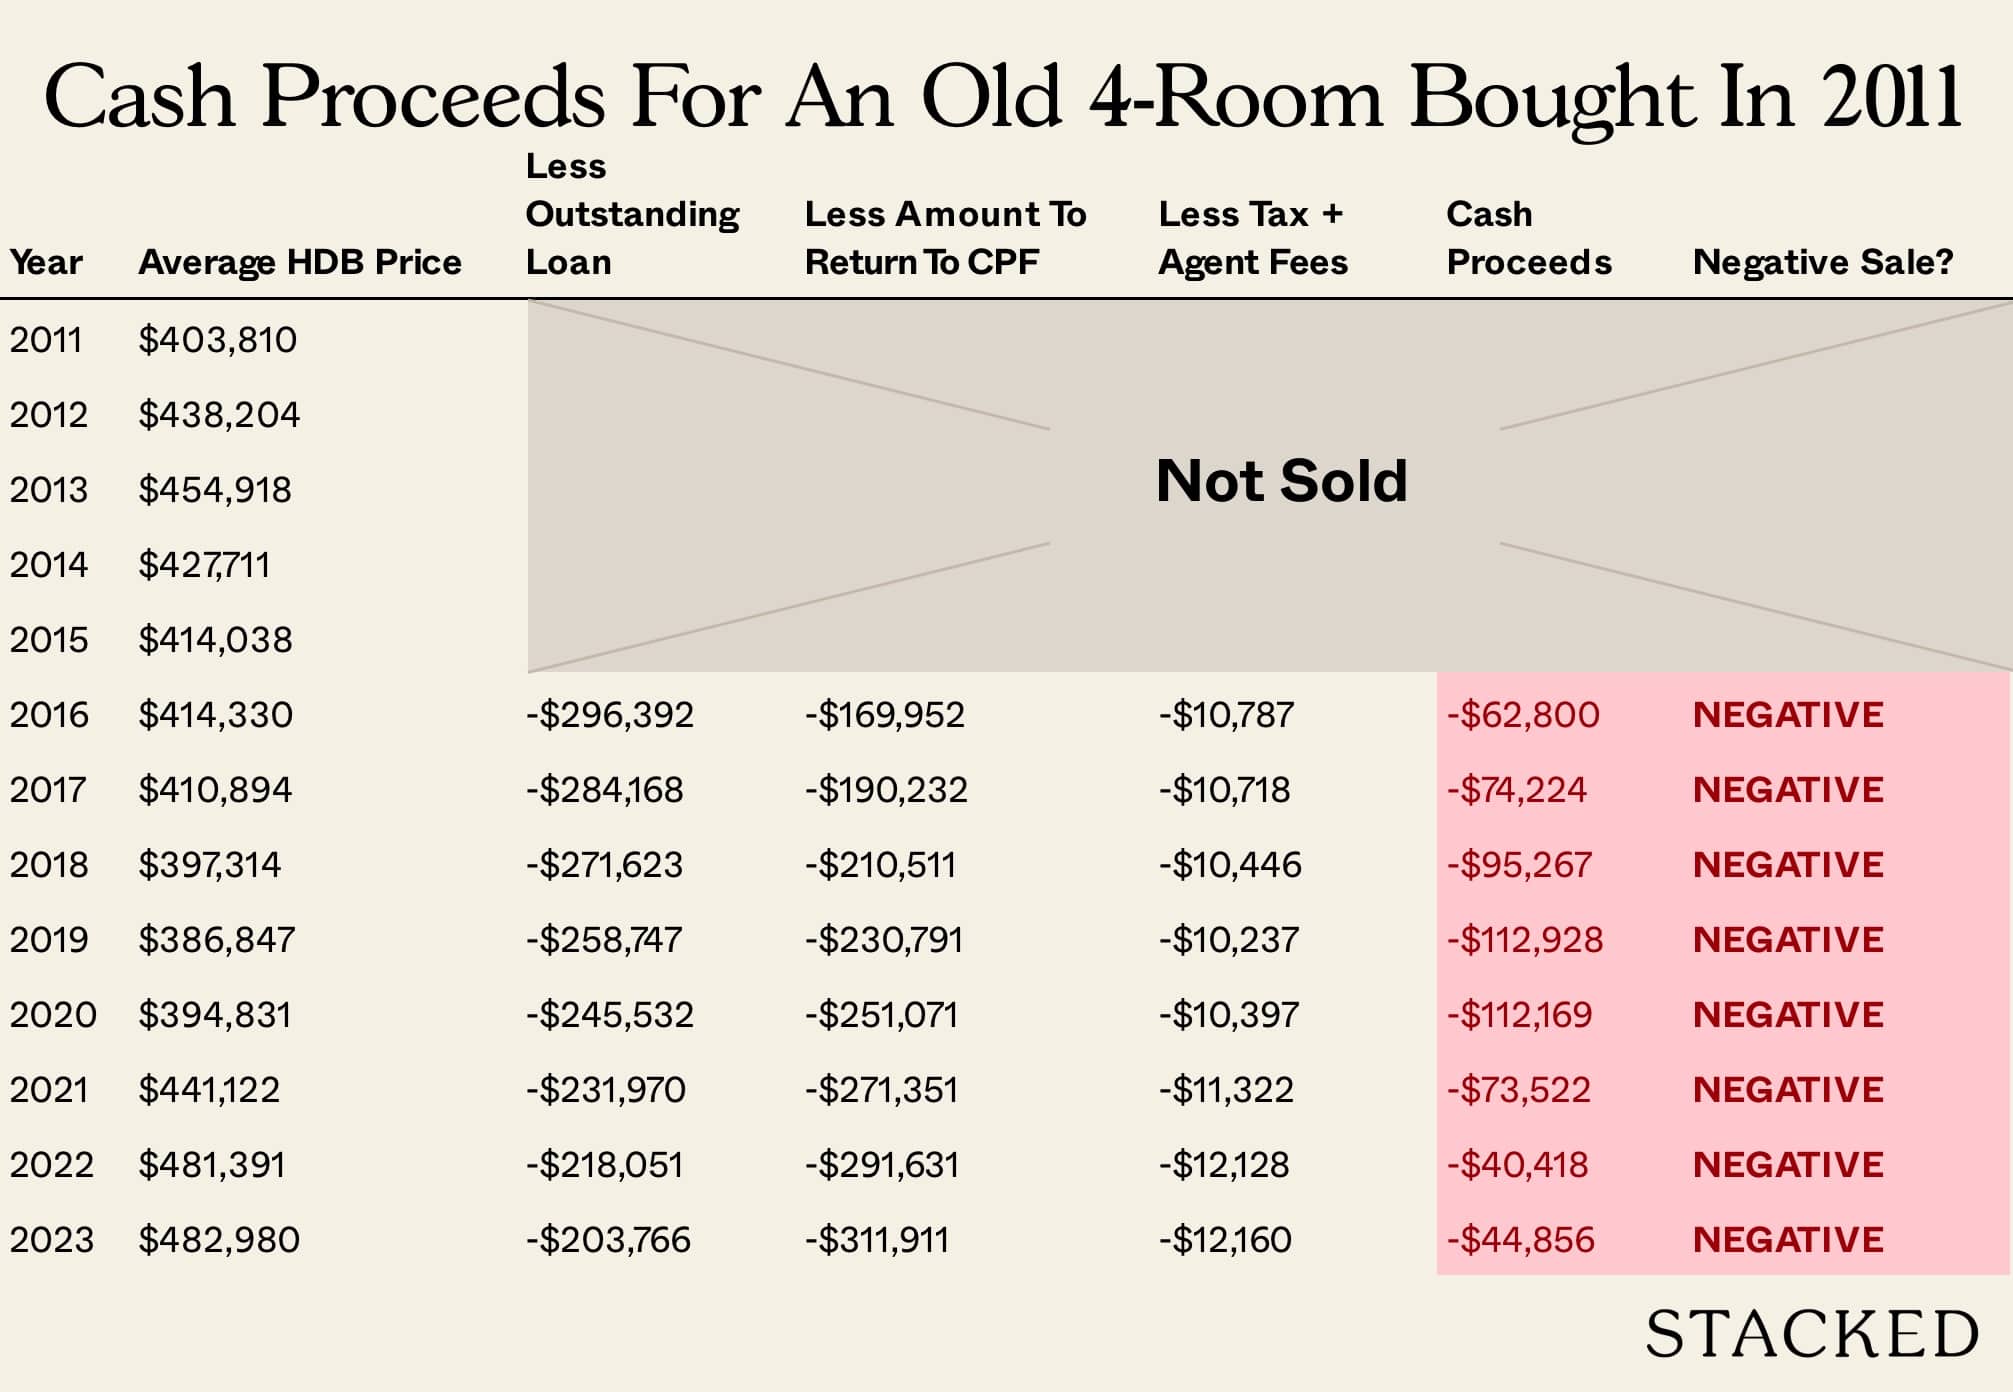
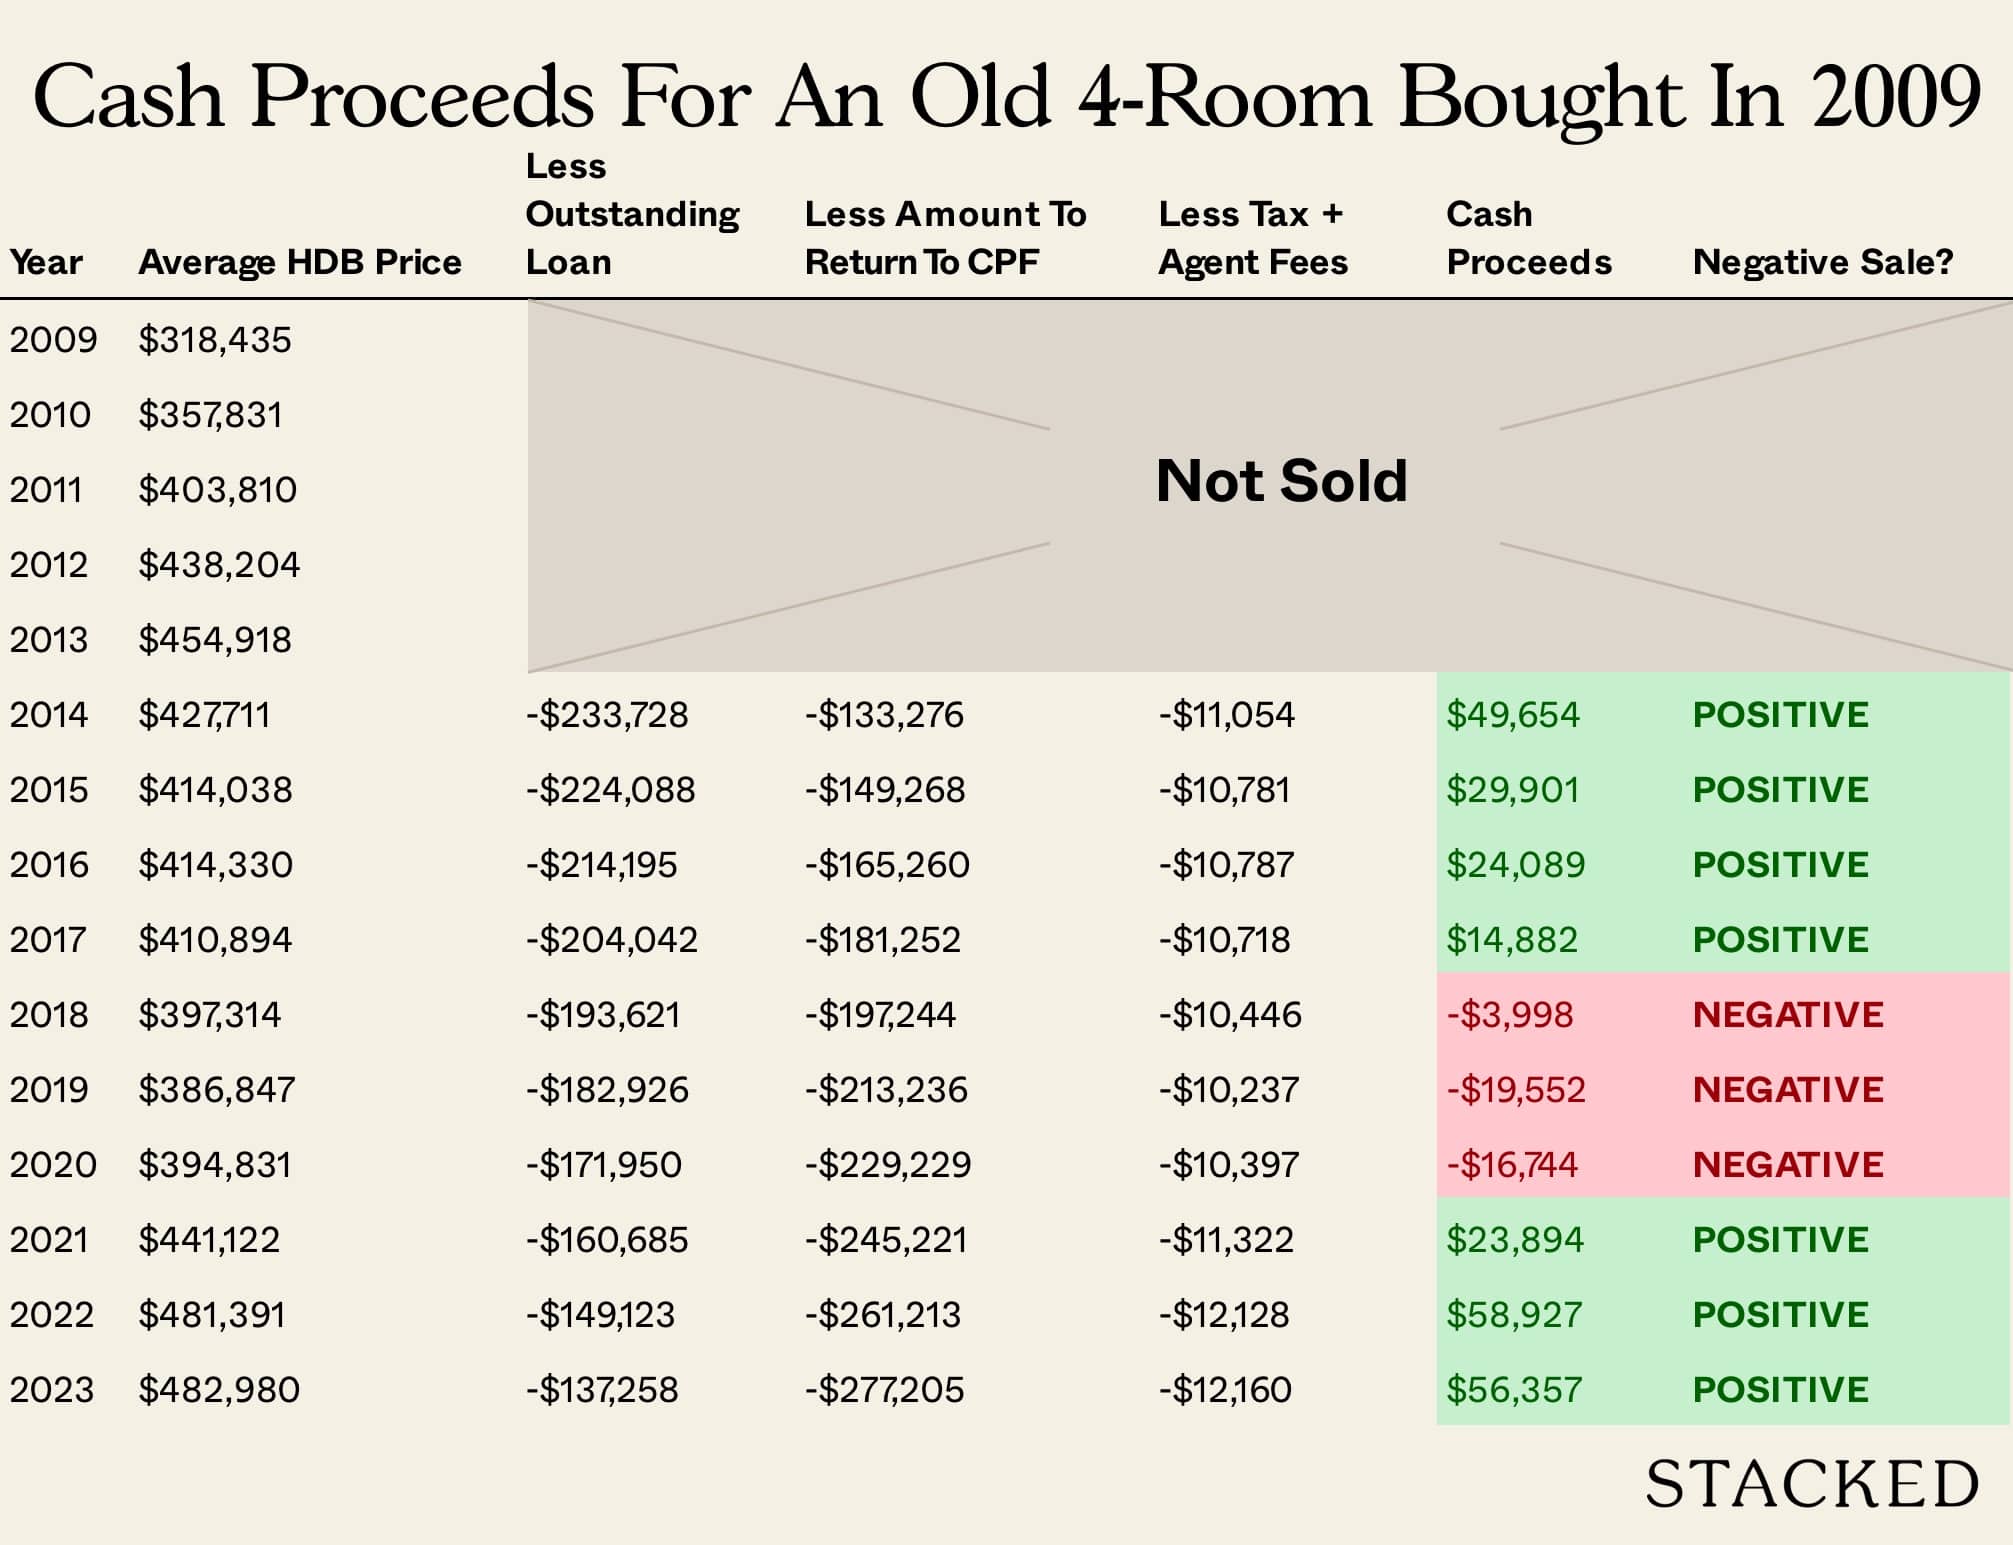
Also note that, for an older flat purchased in 2009, there were greater risks for a negative sale from 2018 to 2020; this was also absent in the simulation for newer flats:
For older 5-room and Executive flats
Among older flats, larger units seem to have performed better. Those who bought an older 5-room or EA unit, despite the higher quantum, are less likely to be in negative sale territory today, as compared to older 4-room units.
For example: the average price for older 4-room flats in 2011 was around $414,000. By 2022, the average was $481,000, which according to the simulation would place our flat in negative cash sale territory (around negative $40,000 after refund).
For EAs, prices in 2011 averaged $586,000. But in 2022, the average had risen to $820,000; an appreciation rate that took it well out of negative cash sale territory:
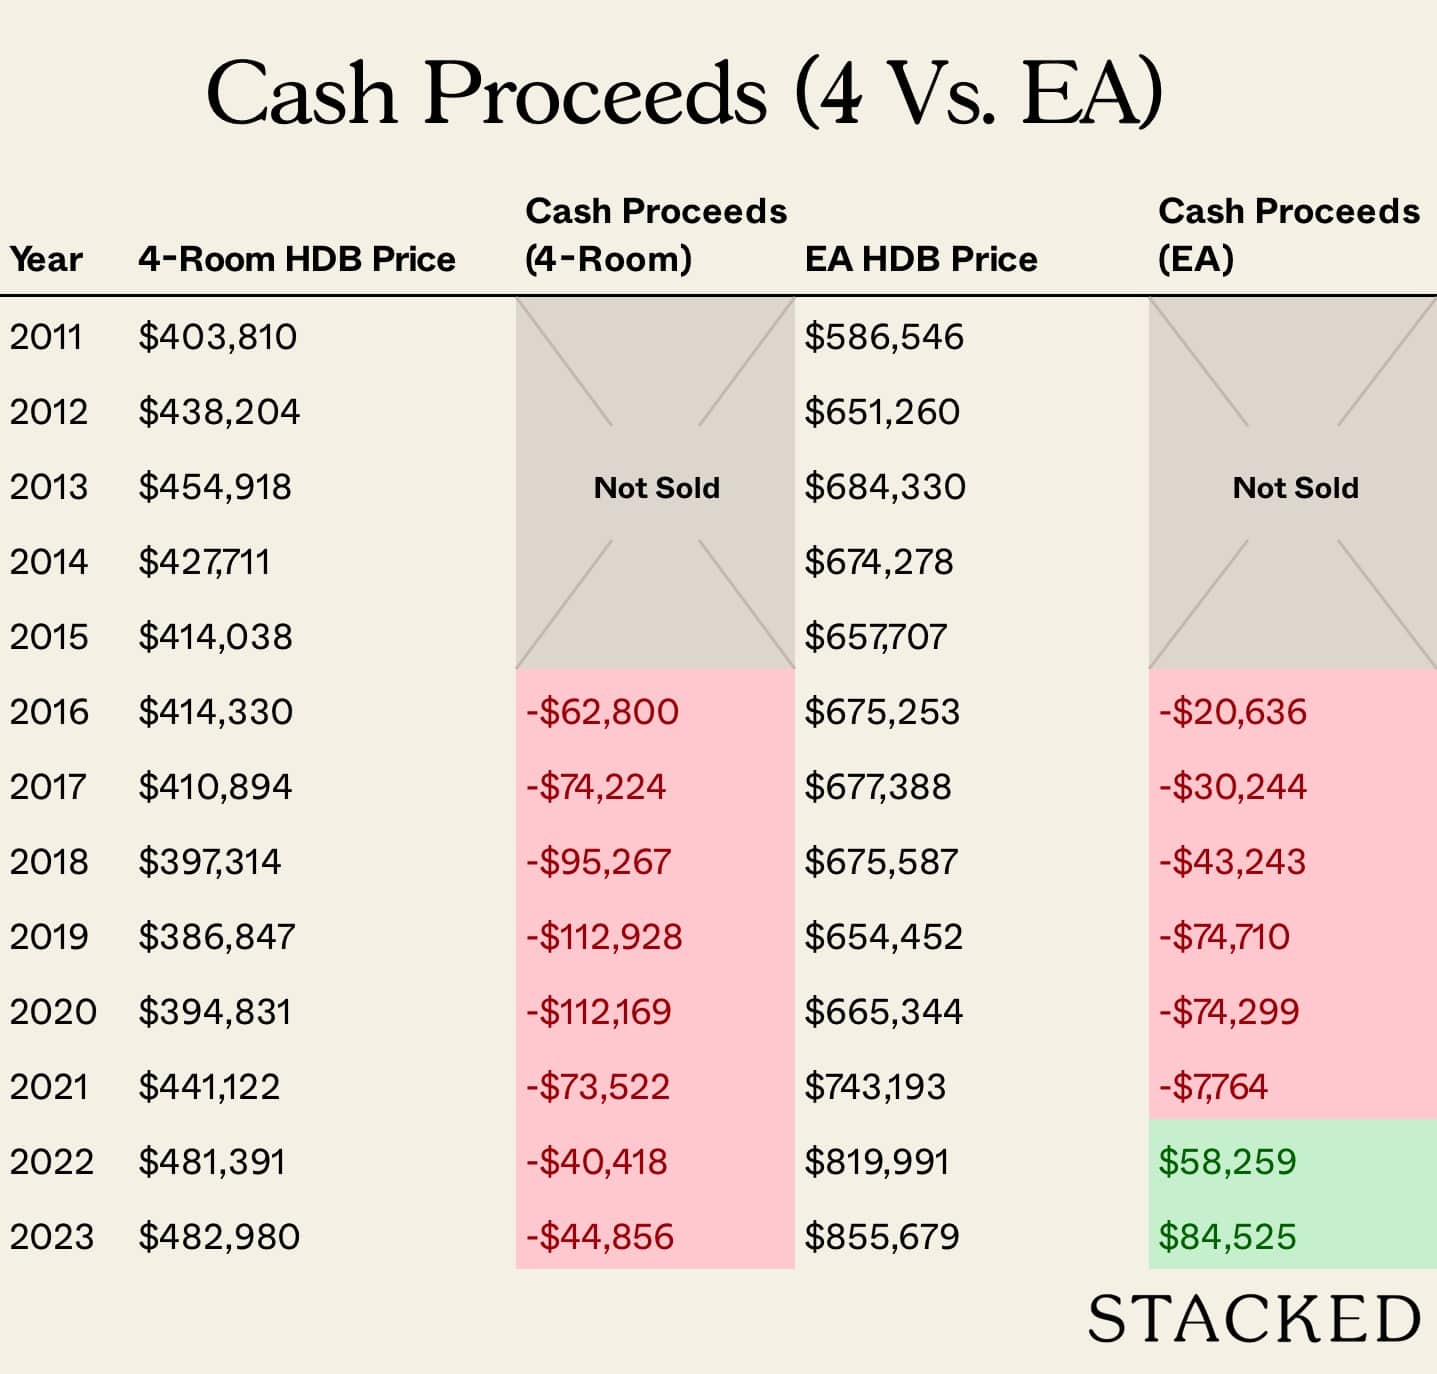
This may be due to a recent surge of interest in larger units, and buyers finding that the most affordable forms of large homes are older resale flats.
Ultimately, the quantum is the factor to focus on
While appreciation is also a big factor, this is not something you have the ability to control. What matters – and which you can decide – is the quantum. In general, the more expensive your flat, the more CPF you use; hence the bigger your refund later since the absolute amount you pay in interest (both CPF accrued interest and HDB loan interest) is higher.
This may be a good argument in favour of getting a smaller resale flat, for those who want to upgrade in five years. The other alternative, of course, is just to use a mix of CPF and cash for your monthly loan repayments.
For more on the HDB as well as private property market, follow us on Stacked. We also have in-depth reviews of new and resale condos alike, so you can plan your next move better if you’re upgrading.
At Stacked, we like to look beyond the headlines and surface-level numbers, and focus on how things play out in the real world.
If you’d like to discuss how this applies to your own circumstances, you can reach out for a one-to-one consultation here.
And if you simply have a question or want to share a thought, feel free to write to us at stories@stackedhomes.com — we read every message.
Frequently asked questions
Can I still face negative cash sales when upgrading from HDB to condo today?
What historical periods had the highest risk of negative cash sales for HDB flats?
How does the type of flat affect the risk of negative cash sales?
Does the age of the flat influence the likelihood of negative cash sales?
Is the purchase price or quantum more important in avoiding negative cash sales?
Ryan J. Ong
A seasoned content strategist with over 17 years in the real estate and financial journalism sectors, Ryan has built a reputation for transforming complex industry jargon into accessible knowledge. With a track record of writing and editing for leading financial platforms and publications, Ryan's expertise has been recognised across various media outlets. His role as a former content editor for 99.co and a co-host for CNA 938's Open House programme underscores his commitment to providing valuable insights into the property market.Need help with a property decision?
Speak to our team →Read next from Property Market Commentary

Property Market Commentary How I’d Invest $12 Million On Property If I Won The 2026 Toto Hongbao Draw

Property Market Commentary We Review 7 Of The June 2026 BTO Launch Sites – Which Is The Best Option For You?

Property Market Commentary Why Some Old HDB Flats Hold Value Longer Than Others

Property Market Commentary We Analysed HDB Price Growth — Here’s When Lease Decay Actually Hits (By Estate)
Latest Posts

Singapore Property News Nearly 1,000 New Homes Were Sold Last Month — What Does It Say About the 2026 New Launch Market?

Overseas Property Investing Savills Just Revealed Where China And Singapore Property Markets Are Headed In 2026

Singapore Property News The Unexpected Side Effect Of Singapore’s Property Cooling Measures


0 Comments