


In recent years, executive maisonettes and jumbo flats have been known to defy gravity and logic, in terms of market returns. These tend to be among the oldest HDB flats, which aren’t even produced anymore. But despite the lease decay, these types of flats are known to fetch high resale prices, and reach the million-dollar flat category. Do their unique layouts result in better returns, despite their age? We took a deep dive into the numbers:
The challenge for many buyers today isn't access to information.
It's interpreting that information in a way that makes sense for their finances, goals, and stage of life.
Over time, that's also why we decided to work with agents who shared the same data-driven and advisory-led approach behind our editorial, consultants who could help readers think through decisions more objectively, rather than simply push transactions.
Today, the team has worked with more than 2,000 clients across over $5B in property transactions.
How have maisonettes and jumbo flats performed?
To get a sense of their performance, we’re going to look at their transaction data from 1990 to 2024. This will give a sense of the wider historical picture.
We’re going to look at the standard flat prices (as a point of comparison), while placing maisonettes in their own categories. For jumbo flats, we had to differentiate them by their room type. This is because jumbo flats are adjoined flats (i.e., made by merging two flats), but not all of them are the same: there are 4-room adjoined flats and 5-room adjoined flats, so we had to create two more categories for these.
| Year | 3 ROOM | 4 ROOM | 5 ROOM | EXECUTIVE | MAISONETTE | MULTI GENERATION | EXECUTIVE-adjoined | 4 ROOM-adjoined | 5 ROOM-adjoined |
| 1990 | $42,618 | $81,766 | $131,436 | $182,802 | $183,106 | ||||
| 1991 | $44,480 | $81,800 | $137,245 | $185,053 | $190,495 | $165,000 | |||
| 1992 | $48,174 | $90,928 | $153,387 | $214,830 | $210,632 | $226,586 | |||
| 1993 | $71,019 | $134,511 | $226,215 | $295,177 | $293,307 | $293,700 | |||
| 1994 | $94,328 | $175,072 | $283,139 | $370,294 | $364,432 | $398,703 | |||
| 1995 | $121,298 | $216,663 | $340,220 | $454,511 | $435,903 | $486,585 | |||
| 1996 | $173,340 | $295,949 | $440,447 | $577,859 | $566,248 | $606,696 | |||
| 1997 | $195,115 | $304,972 | $441,438 | $570,296 | $558,957 | $605,919 | |||
| 1998 | $154,963 | $253,756 | $373,141 | $481,456 | $471,590 | $516,930 | |||
| 1999 | $146,099 | $243,891 | $354,600 | $449,056 | $440,463 | $461,607 | |||
| 2000 | $157,654 | $256,775 | $375,452 | $482,402 | $472,538 | $500,050 | $377,133 | $216,176 | $332,250 |
| 2001 | $145,401 | $233,909 | $340,102 | $448,389 | $438,179 | $456,665 | $358,500 | $221,864 | $296,639 |
| 2002 | $144,189 | $224,251 | $324,432 | $427,631 | $412,734 | $433,186 | $355,743 | $224,833 | $289,641 |
| 2003 | $159,651 | $230,123 | $321,742 | $414,423 | $398,870 | $431,333 | $359,718 | $243,625 | $313,649 |
| 2004 | $174,476 | $237,585 | $314,864 | $388,211 | $383,303 | $431,833 | $345,394 | $248,471 | $306,794 |
| 2005 | $170,400 | $234,466 | $303,101 | $362,109 | $359,807 | $421,600 | $341,682 | $252,846 | $314,316 |
| 2006 | $166,727 | $235,461 | $302,793 | $355,358 | $359,764 | $400,385 | $372,841 | $286,722 | $309,777 |
| 2007 | $181,502 | $254,511 | $326,773 | $382,241 | $387,198 | $409,952 | $421,063 | $316,593 | $393,508 |
| 2008 | $226,443 | $308,697 | $388,195 | $454,632 | $464,924 | $480,200 | $528,233 | $372,600 | $490,858 |
| 2009 | $250,124 | $331,745 | $402,389 | $463,285 | $481,917 | $511,444 | $502,611 | $445,000 | $465,372 |
| 2010 | $288,079 | $372,428 | $453,068 | $514,070 | $536,056 | $617,241 | $595,449 | $477,156 | $546,951 |
| 2011 | $325,340 | $422,636 | $500,620 | $567,627 | $594,356 | $675,000 | $680,900 | $557,500 | $576,313 |
| 2012 | $351,345 | $456,218 | $540,811 | $616,142 | $651,442 | $798,167 | $750,333 | $592,800 | $715,517 |
| 2013 | $361,936 | $479,214 | $567,368 | $649,298 | $682,189 | $767,127 | $782,400 | $768,000 | $710,833 |
| 2014 | $341,008 | $444,746 | $534,596 | $614,571 | $677,357 | $702,000 | $761,600 | $603,286 | $710,100 |
| 2015 | $324,761 | $433,574 | $512,807 | $594,359 | $666,590 | $805,000 | $720,861 | $560,000 | $745,765 |
| 2016 | $322,474 | $434,390 | $520,649 | $590,919 | $680,985 | $722,750 | $810,299 | $553,333 | $650,709 |
| 2017 | $317,834 | $437,085 | $530,211 | $598,065 | $681,976 | $783,750 | $762,857 | $589,000 | $699,450 |
| 2018 | $306,478 | $431,734 | $525,627 | $600,946 | $680,346 | $801,393 | $790,160 | $600,000 | $659,425 |
| 2019 | $299,457 | $429,717 | $525,013 | $586,445 | $662,602 | $819,190 | $696,224 | $526,667 | $621,692 |
| 2020 | $312,709 | $448,501 | $540,201 | $608,669 | $675,440 | $773,125 | $759,800 | $654,800 | $597,724 |
| 2021 | $352,961 | $505,034 | $602,376 | $674,012 | $751,389 | $820,778 | $819,200 | $611,571 | $713,512 |
| 2022 | $388,974 | $549,095 | $652,683 | $747,853 | $831,517 | $874,949 | $877,306 | $528,750 | $719,123 |
| 2023 | $411,888 | $583,928 | $683,612 | $798,608 | $872,836 | $996,667 | $980,806 | $756,375 | $793,251 |
| 2024 | $439,972 | $627,363 | $726,604 | $841,328 | $919,986 | $1,049,000 | $1,045,626 | $729,000 | $898,653 |
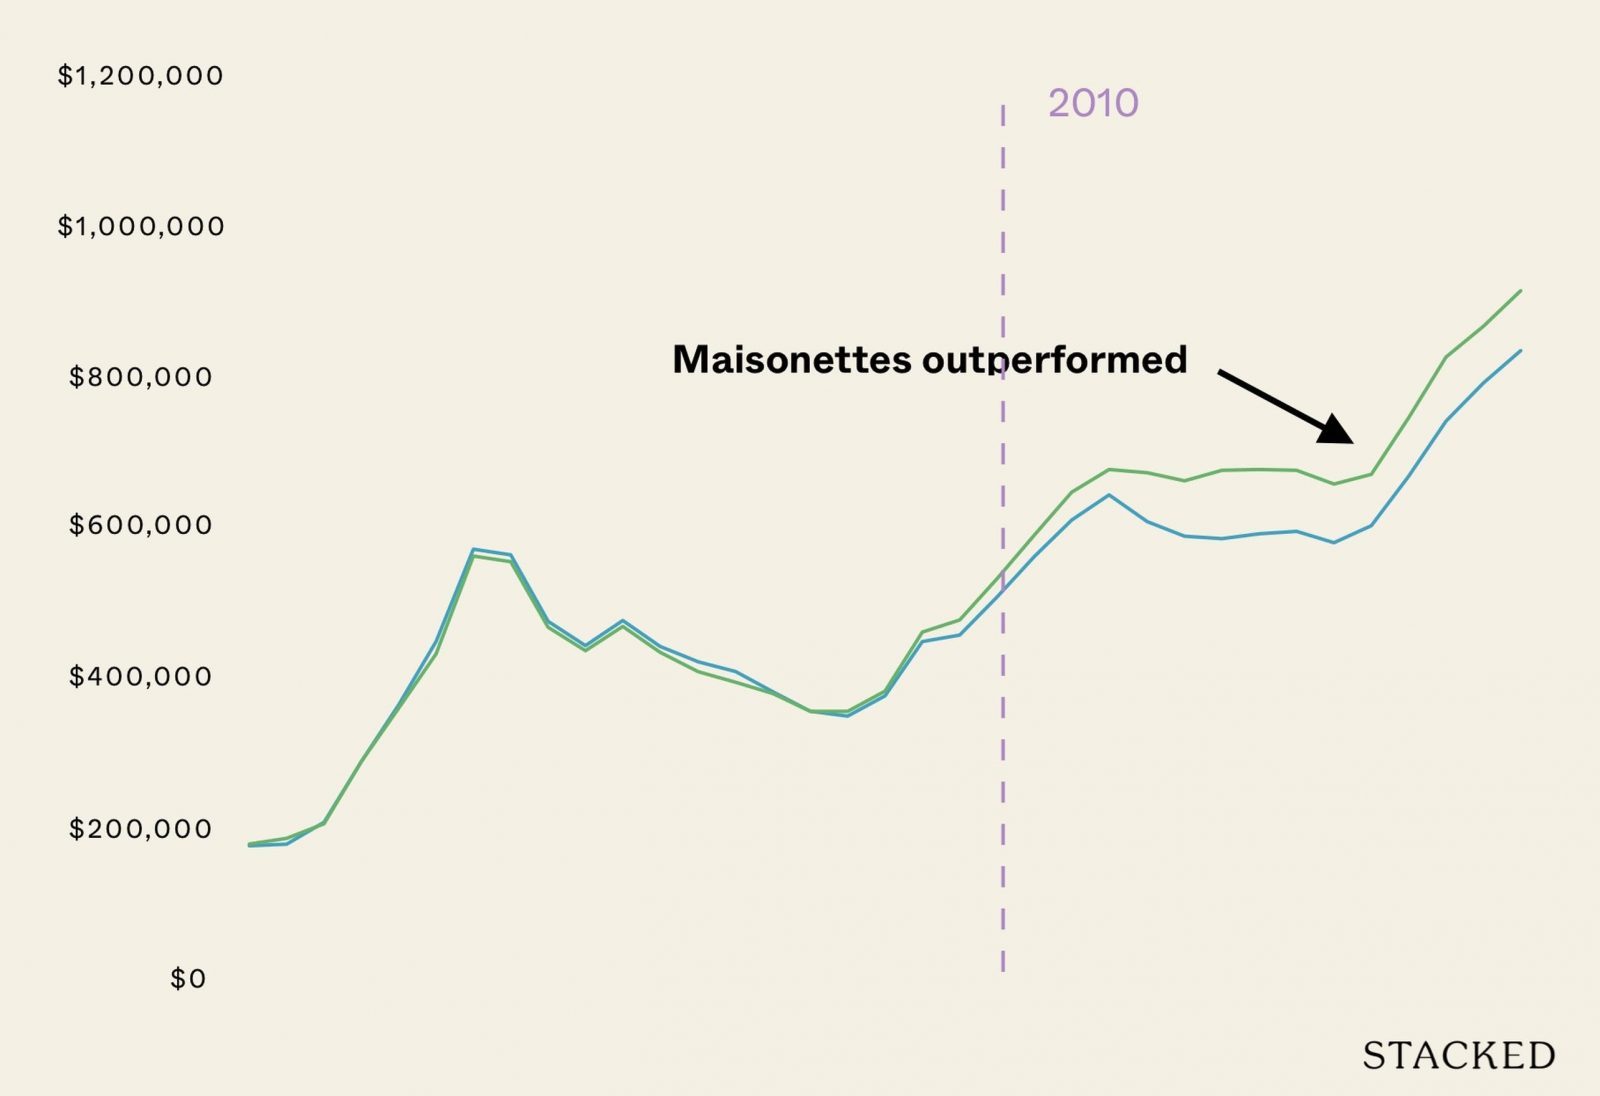
Here’s a more visual representation of the transaction histories:

One of the issues we run into here is that jumbo flats are very rare. This results in a low transaction volume, which makes their prices volatile. In some years (e.g., 2013, 2023) these jumbo flat prices spiked, but that’s likely due to a few high-profile transactions rather than any significant pattern.
The price gap between 4-room adjoined and 5-room adjoined is also very inconsistent, making it hard to draw any clear conclusions.
We should add that, while we don’t have an exact date as to when jumbo flats stopped being built, industry experts and realtors have told us production ceased in the mid-1990s. As of 2025, all jumbo flats on the market are at least 30 years old.
For maisonettes, we can see these flats used to quite closely follow Executive flats in price. Maisonettes also experienced a very strong run-up in price in the mid-1990s, only dipping in ‘97 due to the Asian Financial Crisis (as did the wider market).
HDB stopped building maisonettes in August 1995, and we can see the scarcity value on price movements after that. By 2010, maisonette prices started pulling ahead of regular Executive flats, which they once followed closely. By then the rarity of the maisonette seems to have been established, adding to its appeal.
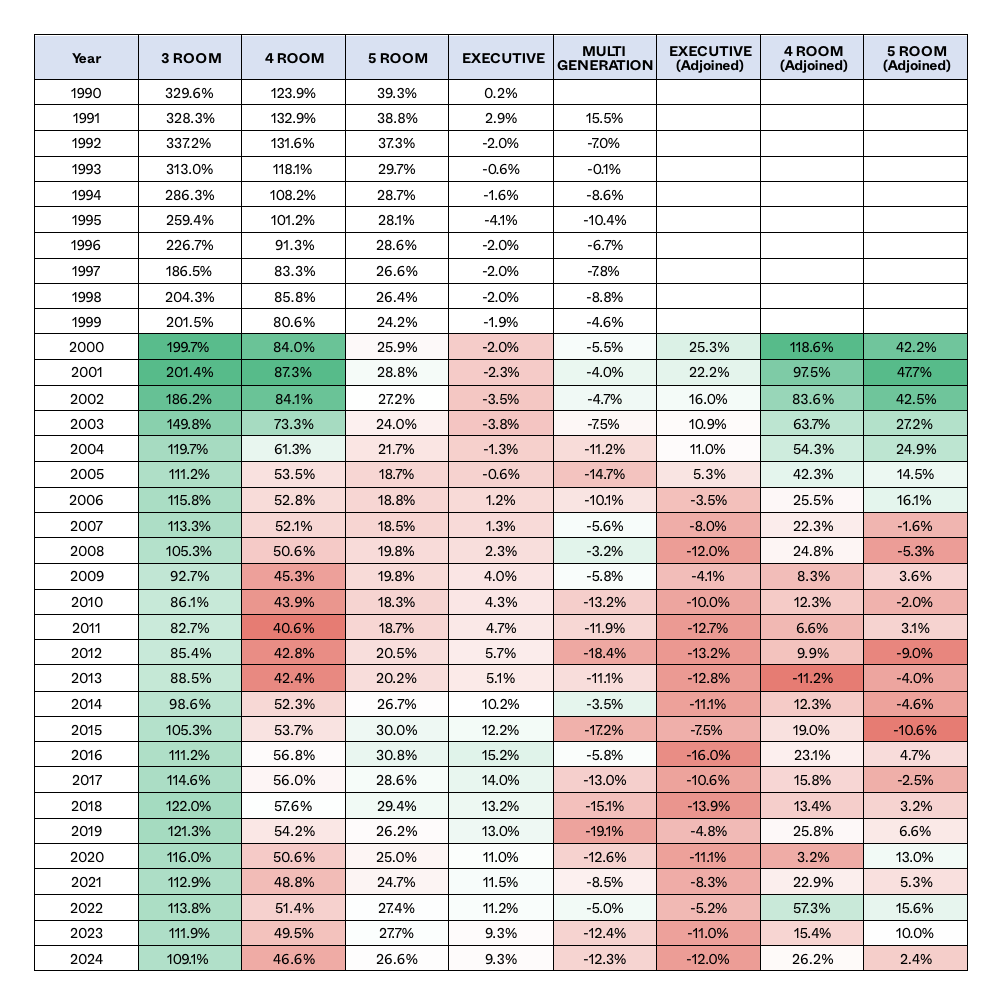
Next, let’s look at the price premium of maisonettes and jumbo flats, versus other flats.
We’ll begin with maisonettes:
Here it is visually:

We can divide it into three general decades:
In the 1990s, the premium was declining. Maisonettes initially commanded a huge premium over smaller flats, with prices over 300 per cent higher than 3-room flats and around 30 to 40 per cent higher than 5-room flats. But by 1993 onwards, we can see the premium started shrinking; and by 1997, the maisonette premium over 5-room flats had fallen to just 26.6 per cent.
We suspect – but cannot verify – that the introduction of Executive Condominiums (ECs) in 1995 might have siphoned demand from these premium flats.
By 2005, the premium over 5-room flats had fallen to the lowest point (18.7 per cent). Maisonettes prices seemed to converge with executive flats, and actually lagged behind them from 1995 to 2007. Maisonettes seemed to be seriously losing their former desirability.
Congruent with what was mentioned above though, the rarity of maisonettes may have started to kick in by around the 2010s. From this point onward, maisonette prices started rising faster than other flat types, more or less reversing their dip from the earlier decade. The premium over 5-room flats was just 18.3 per cent in 2010, but this had soared to 30 per cent by 2015.
That said, the maisonette premium over 5-room flats seems to have stagnated in the 2020s. While the premium has remained above 25 per cent since 2016, we no longer see it widening much.
What’s interesting about this is that, in January 2013, HDB introduced the Mortgage Servicing Ratio (MSR), which sent most resale flat prices into decline.
Our initial assumption was that the MSR would impact maisonettes worse than most other flats, as they’re more expensive; but this doesn’t seem to have happened. In fact, the premium over 5-room flats remained stable (around 20 per cent) and even increased after 2014, reaching 30.8 per cent by 2016.
Perhaps this is because maisonettes attract wealthier buyers, who are less concerned about financing issues.
Another peculiar quirk is how the prices of adjoined flats have moved
Initially, maisonettes commanded a strong premium over adjoined flats. But over time adjoined flats overtook maisonettes, especially after 2007.
This coincided with the property boom of 2007 to 2013, when demand for larger homes surged; and since 2006, Adjoined Executive flats have consistently been priced above maisonettes.
Just from discussions on the ground, this may be due to some buyers wanting to avoid stairs. Many older homeowners live with their adult children, and a jumbo flat allows for easy multi-gen living without the safety risk of stairs. This preference may grow as Singapore ages further.
Next, let’s look at how premiums have moved for jumbo flats. In this case, we’ll look at the larger ones, which are adjoined executive flats.
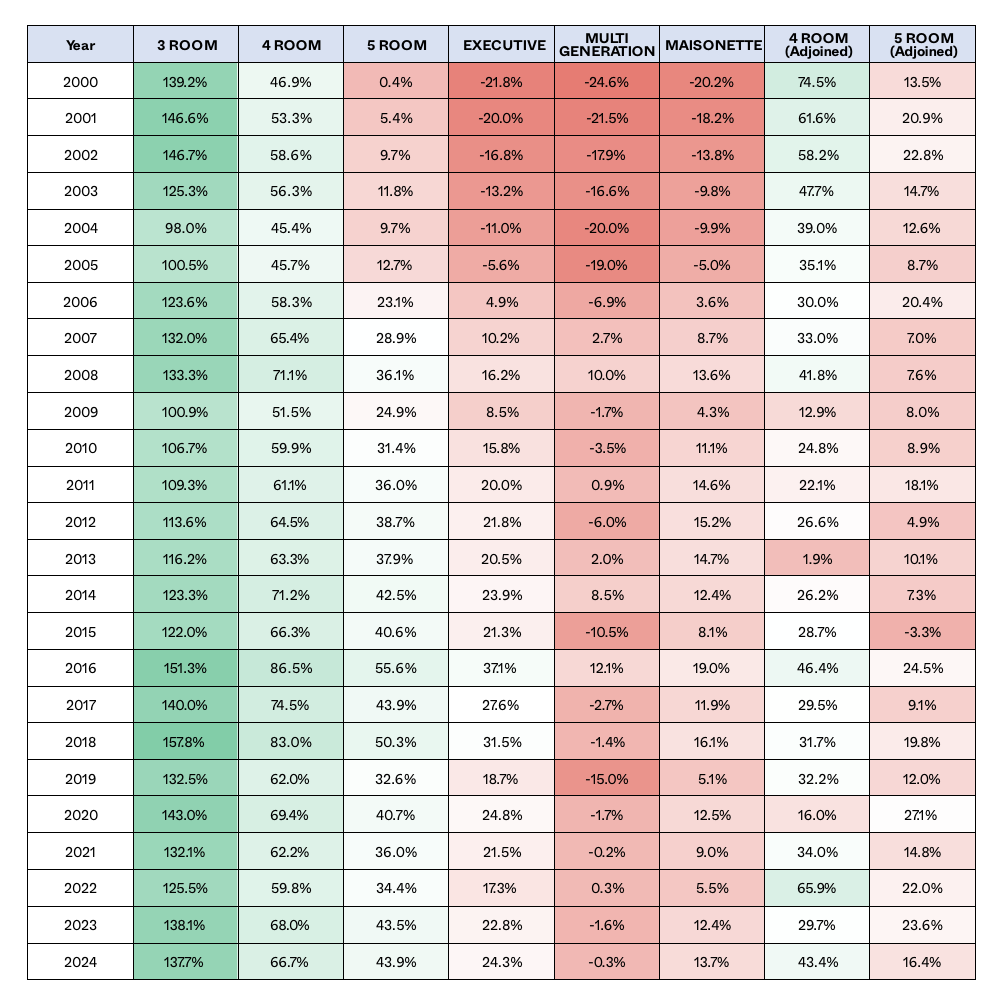
Here it is in a more visual form:

Executive adjoined flats have shown to be more resilient than 5-room flats, Executive Apartments (EAs), and Executive Maisonettes (EMs).
From 2000 to 2005, Executive Apartments (EAs) and Executive Maisonettes (EMs) were more expensive than adjoined executive flats. However, as the market appreciated, adjoined flats gained a price premium over both housing types, peaking in 2018.
Where our observations ended in 2024, adjoined executive flats hold a roughly 25 per cent premium over EAs, and a roughly 14 per cent premium over EMs.
As an interesting side-observation, this has shown us that 3-room flats are the most consistent in terms of pricing. The premium for 4-room flats over time has also been more gradual, with price increases following broader market trends. Both of these flat sizes seem to be less susceptible to the sharp spikes seen in maisonettes and jumbo flats.
Conclusions:
It’s clear that maisonettes, and even more so jumbo flats, have gained pricing power in recent years. It’s evidenced by the widening premium gap over other flat types.
It’s certainly a big help that no new maisonettes or jumbo flats are appearing to compete; and as our society ages, the demand for larger, single-story units for multi-gen living is likely to grow.
This could result in maisonettes and jumbo flats delivering strong returns for a few more years to come. The turning point will be when more of these flats age further, perhaps down to their last 30 to 40 years; that may be when the inevitability of lease decay finally kicks in, and we see the premiums fade.
At Stacked, we like to look beyond the headlines and surface-level numbers, and focus on how things play out in the real world.
If you’d like to discuss how this applies to your own circumstances, you can reach out for a one-to-one consultation here.
And if you simply have a question or want to share a thought, feel free to write to us at stories@stackedhomes.com — we read every message.

0 Comments