Taking a Look at 123 New Sale Condos From 2010 And How They Have Done Today
March 31, 2020
Ever so often, investors will find themselves in a debate over the ‘best’ type of investment.
And while most seasoned investors will tell you that the key is really asset diversification for a relatively safe and profitable portfolio, many do look to property as their main investment-type.
This, often based on their ideas that:
1.) Property investments safeguard against inflation, and therefore monetary loss in that regard.
2.) Housing is a lifelong necessity, and thus serves a second (sometimes main) purpose alongside investment opportunity.
3.) The availability of attractive rental demand (in certain regions) + solid capital appreciation over time (as observed and predicted over past and future decades respectively) means a relatively steady cash flow bonus over the years.
…amongst a number of other pointers.
For today’s piece, we’ve scoured sales figures from almost a decade ago, and plotted them against the prices of those same units today to see how well these developments have done since 2010.
More importantly, we hope to identify and analyse buying/appreciation trends of certain districts and regions that could help us in our future purchases.
Featuring a carefully curated 123 developments, let’s get right to it!
Methodology (& Disclaimers)
Now before we begin, it is important to understand that:
A.) There are numerous policies and unassuming factors that contribute to the quantum difference in individual developments over the years, and this is merely a look at the figures based solely on the curated list.
B.) The end sales figures in 2019 should not be taken as the benchmark of that individual development’s unit quantum, for reasons that we describe more in-depth here.
As for how these figures were collated, they essentially involved:
- Looking for a group of similar units that had sales spread across the year 2010, and then again later through the year 2019.
- Followed by averaging out their average PSFs across both timeframes, and then examining and listing their PSF difference both numerically and as a percentage.
- Before finally separating and categorizing them individually into their respective regions, districts and tenures for a more consistent and thorough analysis in post.
Now without any further ado, let’s check out that list!
Findings & Analysis
1. Which Regions Observed Higher Appreciation/Sales
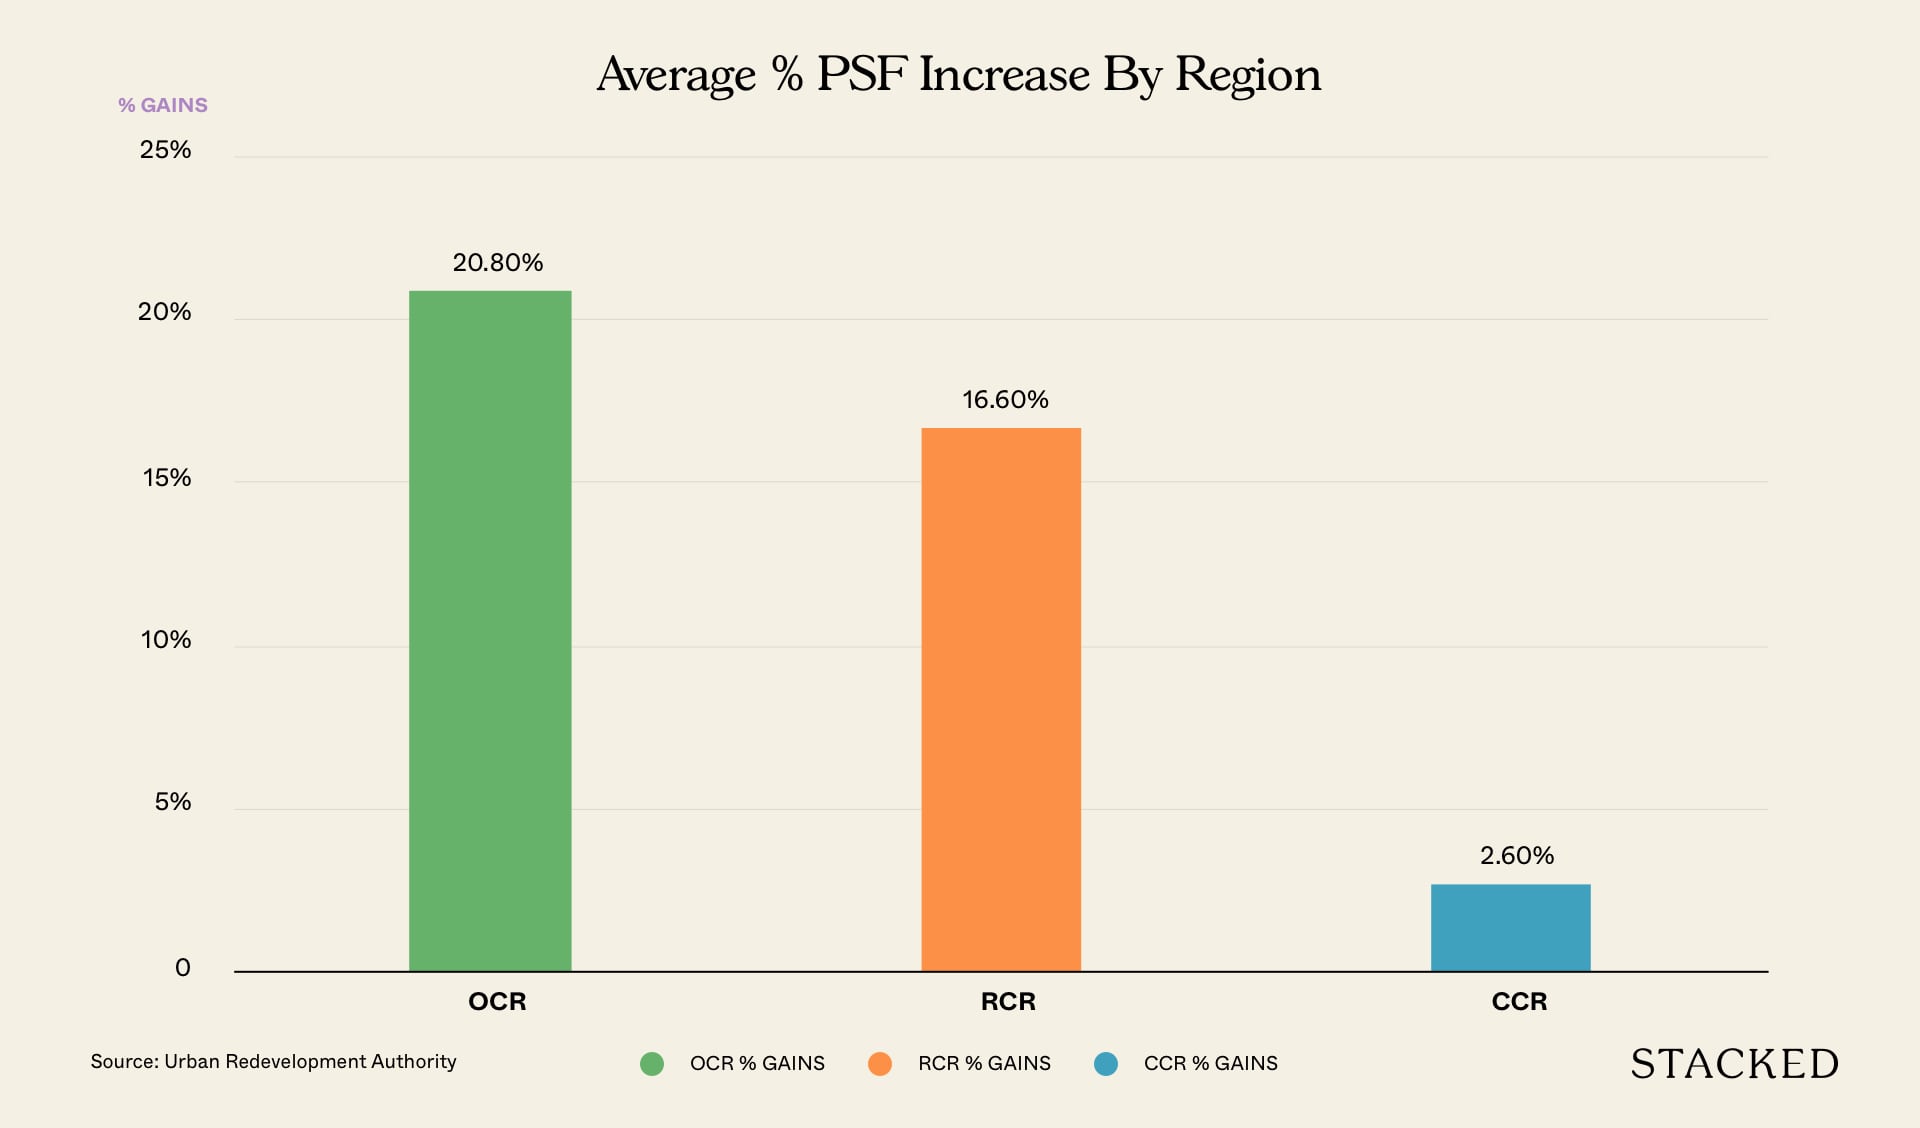
| Region | Number of Developments Listed | Average PSF Increase (%) |
| OCR | 43 | 897/43 = 20.8% |
| RCR | 34 | 567/34 = 16.6% |
| CCR | 46 | 122/46 = 2.6% |
(Note that Regions ≠ Districts. Eg. a development in D1 could belong to either CCR or RCR)
Findings: The Core Central Region (CCR) observed the most transactions, followed by the Outside Central Region (OCR) in close second and finally the Rest of Central Region (RCR).
Unfortunately, the CCR recorded the lowest average PSF increase, followed by the RCR and the OCR.
Analysis: One of the main reasons why the CCR recorded a bulk of transactions is due to the immense convenience factor that developments in the area possess – courtesy of the surrounding Grade A offices (CBD area), eateries and entertainment hotspots.
Naturally, that has long led to good rental demand in the area, therefore making it an investment hotspot for wealthy/savvy investors both locally and globally.
That being said, we observe that the CCR recorded a mere 2.6% appreciation increase. While the OCR observed an astounding 20.8% appreciation increase.
Perhaps the most impactful reason comes from the fact that a large number of CCR developments like Marina Bay Suites (-33%) & Robinson Suites (-17%) have witnessed massive depreciation, and in doing so have pulled the average appreciation stats of the entire region down.
…Even if there are incredible appreciators amongst the crowd, like The Wharf Residence (79%) for example.
Another point worth highlighting is the numerical PSF difference between condos in the OCR and CCR.
If you observe the median/average PSF of condos in the OCR, you will realise that they are much more ‘affordable’ when compared to those of the CCR.
Naturally, that gives them room to ‘catch up’ with the CCR and RCR developments in terms of quantum, and the ever-growing number of construction and developmental projects in the OCR areas provides the welcome boost for its developments to achieve these quantum potentials (as they are now showing).
The developments in the RCR have also observed a solid appreciation increase (on average), no doubt owing to the fact that both the property market and buyers are fast understanding the importance and value of city-fringe developments in the convenience department.
The Future: Now for those who aren’t yet familiar with the newly implemented CBD incentive scheme (Master Plan 2019), it basically incentivises the redevelopment of older commercial-only CBD projects into new mixed-use developments.
What that means is that both homeowners and investors can look forward to an increase in CCR residential occupancies in the near future – which could potentially reduce the value of some city fringe developments in part while sustaining the current unit transaction volumes in the CCR.
That being said, the government has also announced in its Master Plan that it plans to develop the OCR in a bid to ‘decentralise’, with implementations like the:
- Strategic Development Incentive (SDI) – which aims to bring both creative change while easing home-work commutes.
- Punggol Digital District and Jurong Innovation District – increasing jobs in the area and hence property prices.
- Transport and infrastructure improvements at the North, East and Western gateways of Singapore.
Theoretically-speaking, these factors should draw the attention of many investors to the ‘more affordable’ OCR/RCR areas, and as a result, we might just see the increase in resale/new launch transactions in these locations over the coming years.
2. Which Districts Observed More Sales
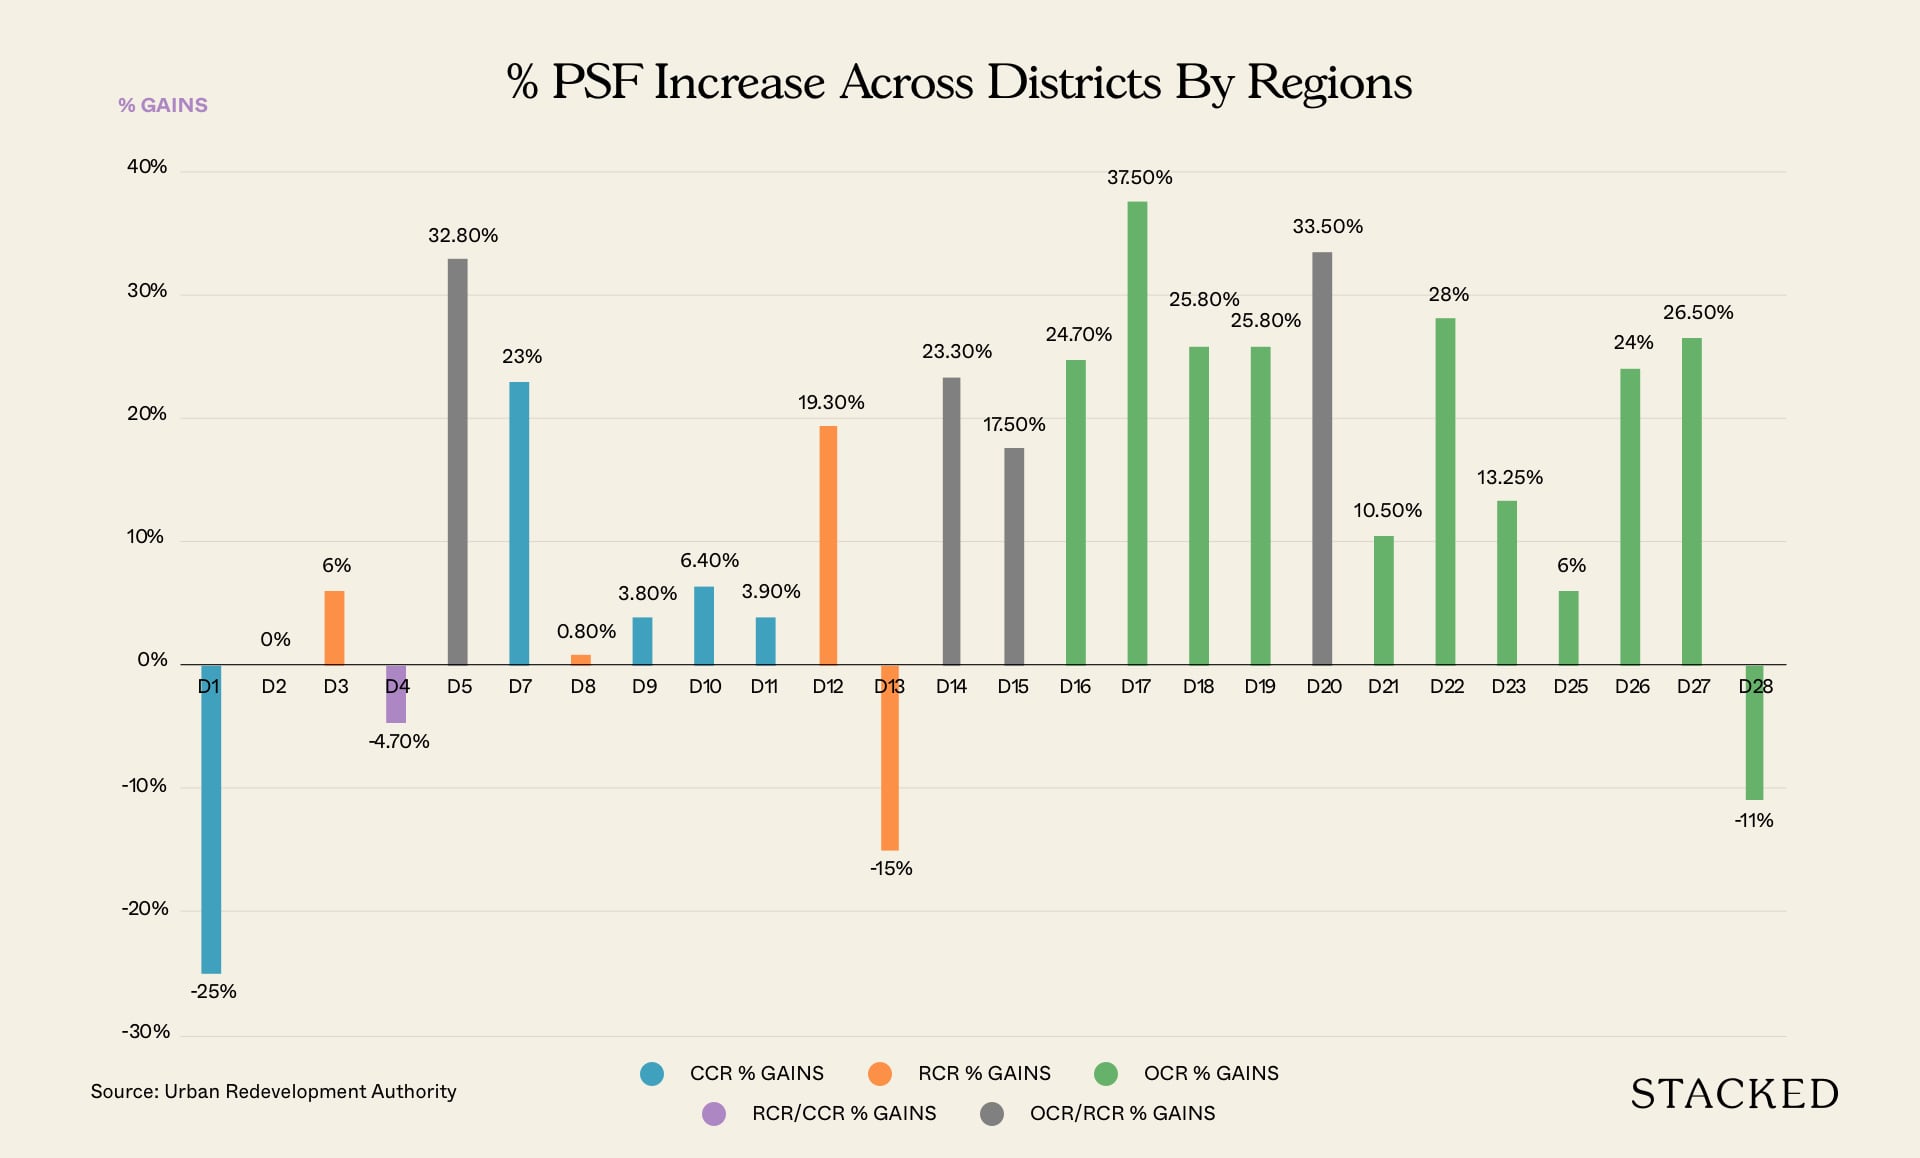
| District | Number of Developments Listed | Average PSF Increase (%) |
| D1 | 2 (2 CCR) | -25% |
| D2 | 5 (5 CCR) | 0% |
| D3 | 1 | 6% |
| D4 | 3 (1 CCR, 2 RCR) | -4.7% |
| D5 | 4 (2 OCR, 2 RCR) | 32.8% |
| D6 | 0 | |
| D7 | 1 (CCR) | 23% |
| D8 | 4 | 0.8% |
| D9 | 14 | 3.8% |
| D10 | 12 | 6.4% |
| D11 | 11 | 3.9% |
| D12 | 6 | 19.3% |
| D13 | 1 | -15% |
| D14 | 8 (7RCR, 1 OCR) | 23.3% |
| D15 | 19 (10 RCR, 9 OCR) | 17.5% |
| D16 | 3 | 24.7% |
| D17 | 2 | 37.5% |
| D18 | 5 | 25.8% |
| D19 | 6 | 25.8% |
| D20 | 2 (1 OCR, 1 RCR) | 33.5% |
| D21 | 4 | 10.5% |
| D22 | 1 | 28% |
| D23 | 4 | 13.25% |
| D24 | 0 | – |
| D25 | 1 | 6% |
| D26 | 1 | 24% |
| D27 | 2 | 26.5% |
| D28 | 1 | -11% |
Findings: When further subdivided into districts, we find that the top 5 transacting districts came from District 15 (OCR + RCR), followed by the CCR Districts 9, 10 and 11 and finally District 14 (OCR + RCR).
Analysis: District 15 belongs to the East Coast/Marine Parade planning area. It also encompasses the Meyer and Amber Road hotspot as well as the Tanjong Rhu, Joo Chiat and Katong enclaves.
Now it comes as no surprise that it hauls in the bulk of the catch.
It has been handed 9 key stations on the upcoming Thomson East Line, presents incredible recreational opportunities (East Coast Park, Country Clubs etc.), boasts incredible sea and forest views, and above all, has the unbridled quality and convenience in terms of food, home-work commutes (CBD and Paya Lebar hub are a stone’s throw away) and amenity offerings.
Districts 9, 10 and 11 make up the general Orchard/Tanglin/Bukit Timah Novena/Holland hotspots with a number of key new-launches and developments over the 10-year period – which would no doubt draw attention to, and hence boost sales of the ‘older’ developments involved in the transactions here.
It is also the hallmark of luxury living in Singapore and developments here have seen some very profitable gains over the years.
As for District 14, it is located in the Eunos/Geylang/Paya Lebar planning area.
More from Stacked
How Do Old Leasehold Condos Hold Up Against Newer Projects? A Case Study Of Orchid Park
In this Stacked Pro breakdown:
It comes in 5th place with 8 transactions, no doubt in anticipation of the upcoming Paya Lebar Airbase/Quarters as well as the general convenience and centrality of its MRT (access to both Circle and East-West lines).
3. Overall: More ‘Winners’ than ‘Losers’
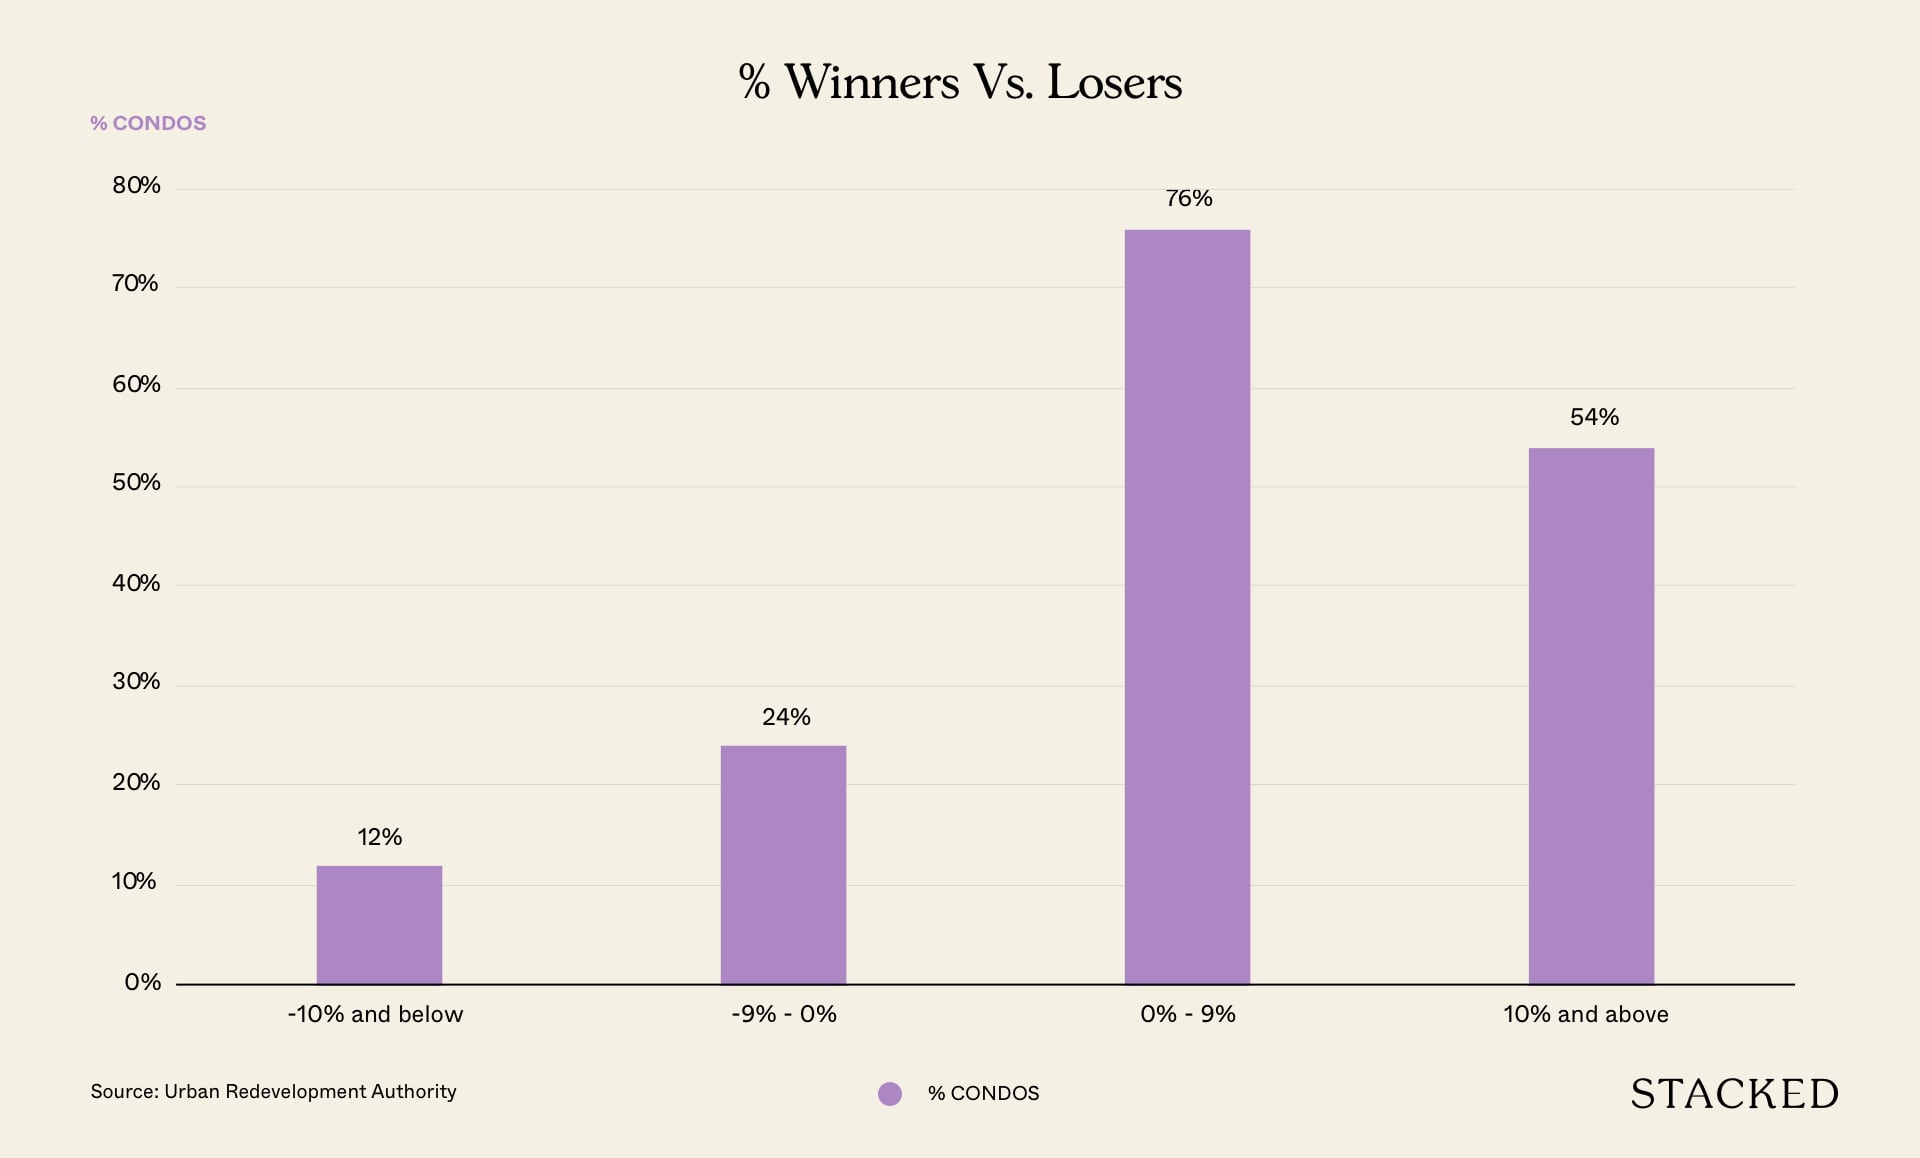
Findings: Just 15 condos (12%) out of the 123 developments listed made losses equivalent/below 10% their original value, while a total of 30 condos (24%) made losses in general over the 10 year period.
Out of the remaining 93 condos (76%), 66 condos (54%) made gains equivalent/above 10% of their original value.
Analysis: One main reason for this was the 10-year overall positive increase in both property price index and inflation rates in Singapore.
While we will not go into the exact figures, what we can safely say is that fewer properties would have seen an overall depreciation outcome had it not been for the 2013-2017 property market slowdown.
Also note that for certain developments, uncharted factors such as the construction of new surrounding developments, increase in nearby convenience opportunities or even rise-of-value in certain condo offerings could have caused their respective quantum to fluctuate.
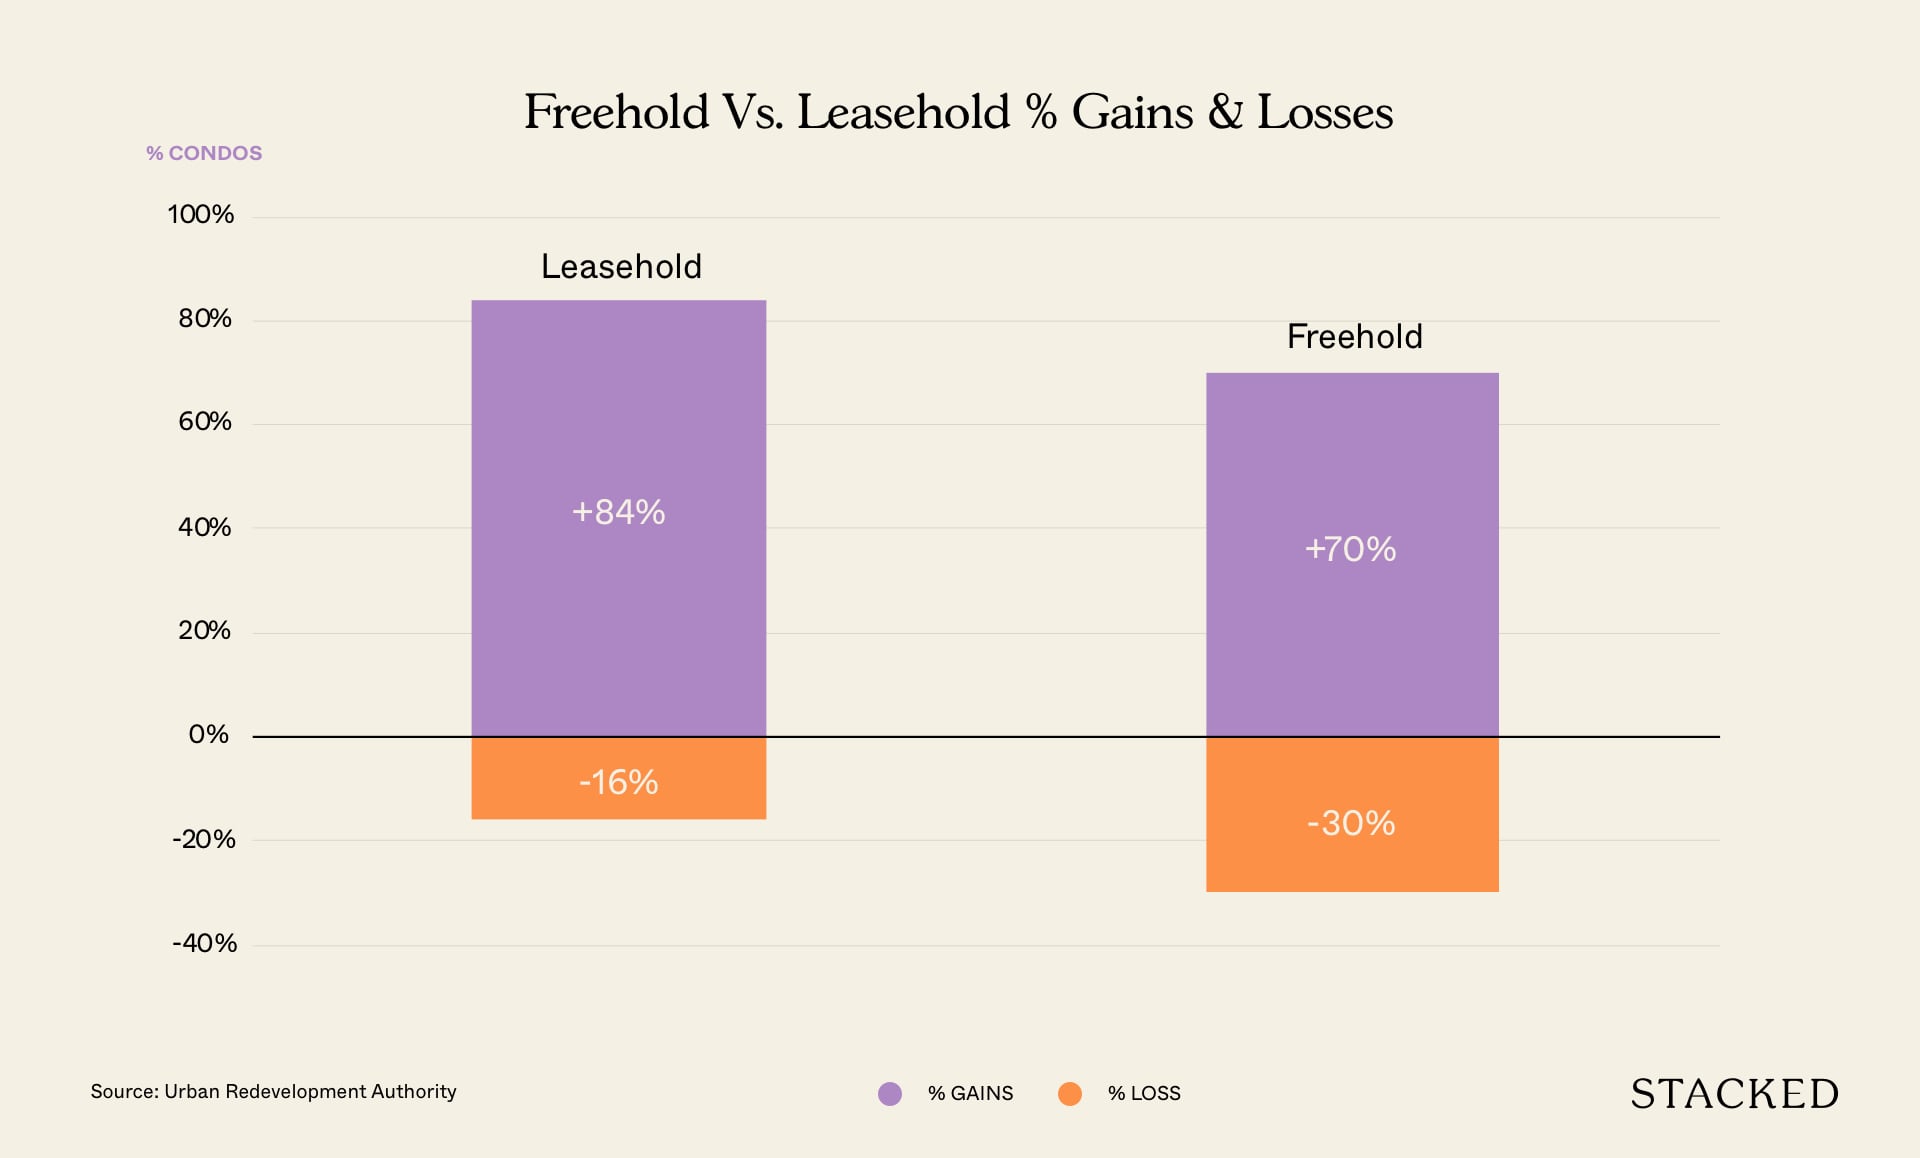
Findings: Out of the 123 development listed, 43 condos (34%) were leasehold and the remaining 80 condos (66%) were freehold.
Based on that, 7 of the 43 leasehold condos (16%) saw overall depreciation figures as did 24 out of 80 freehold condos (30%).
Analysis: While it is hard to determine an overall factor for the latter appreciation rate difference between the leasehold and freehold developments (due to location-related factors amongst many others), it is easy to see why more freehold than leasehold units were transacted.
Unsurprisingly, most investors prefer to buy into freehold than leasehold units based on a multitude of reasons. This includes higher general demand from potential future buyers based on the ‘long last ownership’ factor, as well as that stronger en bloc potential.
More than that, the number of freehold private properties in Singapore far outnumber their private leasehold counterparts, further asserting why more freehold units were transacted in this study.
Perhaps, it could be a hypothesis as to why there are lesser negative appreciation rates in leasehold than in freehold, given that it is mainly experienced investors or lifetime homeowners who delve into leasehold private development sales…
Final Word
As mentioned earlier, we should understand the involvement of numerous other factors that could have contributed to the price changes in these developments, and that these historical price changes should not be a sole threshold for future predictions.
That being said, there have also been certain patterns that we’ve seen like the higher likelihood of freehold unit sales in key districts/regions, as well as the solid appreciation stats of OCR and RCR properties on a whole that are likely to repeat in the coming years, and should therefore not be ignored.
We’ve also observed how developments in the CCR can vary widely in terms of appreciation trends (eg. Marina Bay Suites VS The Wharf Residence).
And while it is highly unlikely for the more affordable developments to succumb to ‘crippling’ depreciation, the likelihood of a ‘Marina Bay Suites repeat’ is all too real for many wealthy investors.
As such, it is extremely vital for those who are seriously considering property investments to reduce the margin of error when determining the potential appreciation trend of their desired development.
Here are a number of ways to do that.
- Firstly, it is important to observe the particular district/regions’ developmental plans through the Master Plan 2019 (including the likelihood of any immediate ‘neighbouring-amenity’ construction) to understand the possible rise/fall in future value of your chosen development.
- Secondly, be sure to conduct a study on its neighbouring residential development competitors to understand how their respective USPs (facilities/spatial offerings etc.), Tenure, Age and Quantum Demands have affected their past and current values. Plot those findings against your particular development of interest for better clarity of its possible future price movement avenues.
- Finally, do not forget to factor in the various possible internal and external economic (and property market) changes for a better idea of your development’s future pricing, and more importantly, to safeguard and weather-through unexpected crises in the short, medium and long terms.
Be thorough, be precise, and above all, be wise in your decisions.
With that, we wish you the best of luck on your property journey. Happy hunting!
List of New Sale Condos from 2010
| Condo | 2010 PSF | 2019 PSF | Difference | % |
| MARINA BAY SUITES | $ 2,592.50 | $ 1,746.00 | $ (846.50) | -33% |
| SEASCAPE | $ 2,710.88 | $ 2,049.00 | $ (661.88) | -24% |
| BELLE VUE RESIDENCES | $ 2,407.60 | $ 1,930.00 | $ (477.60) | -20% |
| OUE TWIN PEAKS | $ 2,838.58 | $ 2,312.00 | $ (526.58) | -19% |
| ROBINSON SUITES | $ 3,024.01 | $ 2,500.00 | $ (524.01) | -17% |
| LUMIERE | $ 2,081.40 | $ 1,747.00 | $ (334.40) | -16% |
| THE LAURELS | $ 2,867.26 | $ 2,412.00 | $ (455.26) | -16% |
| REFLECTIONS AT KEPPEL BAY | $ 1,939.29 | $ 1,639.00 | $ (300.29) | -15% |
| LEICESTER SUITES | $ 1,251.44 | $ 1,067.00 | $ (184.44) | -15% |
| SIGLAP V | $ 1,442.87 | $ 1,255.00 | $ (187.87) | -13% |
| LINCOLN SUITES | $ 1,960.58 | $ 1,718.00 | $ (242.58) | -12% |
| JARDIN | $ 1,769.38 | $ 1,554.00 | $ (215.38) | -12% |
| 76 SHENTON | $ 1,920.21 | $ 1,689.00 | $ (231.21) | -12% |
| STARLIGHT SUITES | $ 2,069.56 | $ 1,839.00 | $ (230.56) | -11% |
| THE GREENWICH | $ 1,113.59 | $ 996.00 | $ (117.59) | -11% |
| PATERSON SUITES | $ 2,676.58 | $ 2,430.00 | $ (246.58) | -9% |
| LOFT @ RANGOON | $ 1,328.52 | $ 1,218.00 | $ (110.52) | -8% |
| STEVENS SUITES | $ 1,888.42 | $ 1,734.00 | $ (154.42) | -8% |
| THE VERMONT ON CAIRNHILL | $ 2,401.77 | $ 2,214.00 | $ (187.77) | -8% |
| CENTRA STUDIOS | $ 1,150.71 | $ 1,062.00 | $ (88.71) | -8% |
| CITYSCAPE @FARRER PARK | $ 1,423.21 | $ 1,314.00 | $ (109.21) | -8% |
| LOFT @ NATHAN | $ 1,912.59 | $ 1,814.00 | $ (98.59) | -5% |
| TIVOLI GRANDE | $ 1,215.63 | $ 1,156.00 | $ (59.63) | -5% |
| HERTFORD COLLECTION | $ 1,283.53 | $ 1,231.00 | $ (52.53) | -4% |
| GILSTEAD TWO | $ 2,048.31 | $ 1,965.00 | $ (83.31) | -4% |
| ESPADA | $ 2,460.60 | $ 2,390.00 | $ (70.60) | -3% |
| THE GLYNDEBOURNE | $ 2,117.89 | $ 2,067.00 | $ (50.89) | -2% |
| L’VIV | $ 2,067.64 | $ 2,040.00 | $ (27.64) | -1% |
| VIVACE | $ 2,025.45 | $ 2,001.00 | $ (24.45) | -1% |
| THE LANAI | $ 1,312.23 | $ 1,303.00 | $ (9.23) | -1% |
| THE SOUND | $ 1,467.63 | $ 1,466.00 | $ (1.63) | 0% |
| RV EDGE | $ 1,714.05 | $ 1,718.00 | $ 3.95 | 0% |
| NV RESIDENCES | $ 860.69 | $ 870.00 | $ 9.31 | 1% |
| SILVERSEA | $ 1,611.02 | $ 1,633.00 | $ 21.98 | 1% |
| CYAN | $ 2,004.22 | $ 2,045.00 | $ 40.78 | 2% |
| D’LEEDON | $ 1,546.73 | $ 1,579.00 | $ 32.27 | 2% |
| THE TRIZON | $ 1,446.05 | $ 1,478.00 | $ 31.95 | 2% |
| DUNEARN SUITES | $ 1,711.58 | $ 1,751.00 | $ 39.42 | 2% |
| SOPHIA RESIDENCE | $ 1,418.83 | $ 1,460.00 | $ 41.17 | 3% |
| SPOTTISWOODE RESIDENCES | $ 1,894.00 | $ 1,954.00 | $ 60.00 | 3% |
| TRILIGHT | $ 1,793.68 | $ 1,855.00 | $ 61.32 | 3% |
| SOLEIL @ SINARAN | $ 1,633.12 | $ 1,695.00 | $ 61.88 | 4% |
| ADRIA | $ 1,677.64 | $ 1,751.00 | $ 73.36 | 4% |
| JUPITER 18 | $ 1,210.41 | $ 1,265.00 | $ 54.59 | 5% |
| ROSEWOOD SUITES | $ 567.17 | $ 600.00 | $ 32.83 | 6% |
| ASCENTIA SKY | $ 1,321.28 | $ 1,401.00 | $ 79.72 | 6% |
| OPAL SUITES | $ 1,238.11 | $ 1,316.00 | $ 77.89 | 6% |
| VACANZA @ EAST | $ 1,104.20 | $ 1,175.00 | $ 70.80 | 6% |
| TOMLINSON HEIGHTS | $ 3,017.33 | $ 3,212.00 | $ 194.67 | 6% |
| HORIZON RESIDENCES | $ 1,447.35 | $ 1,543.00 | $ 95.65 | 7% |
| LATITUDE | $ 1,973.79 | $ 2,107.00 | $ 133.21 | 7% |
| AALTO | $ 1,793.82 | $ 1,922.00 | $ 128.18 | 7% |
| PRESTIGE HEIGHTS | $ 1,386.08 | $ 1,486.00 | $ 99.92 | 7% |
| VISTA RESIDENCES | $ 1,403.50 | $ 1,509.00 | $ 105.50 | 8% |
| HERITAGE EAST | $ 1,243.82 | $ 1,347.00 | $ 103.18 | 8% |
| LUMA | $ 1,691.62 | $ 1,845.00 | $ 153.38 | 9% |
| SKYLINE 360 @ SAINT THOMAS WALK | $ 1,980.33 | $ 2,166.00 | $ 185.67 | 9% |
| HILLVISTA | $ 1,125.34 | $ 1,236.00 | $ 110.66 | 10% |
| HAIG 162 | $ 1,348.01 | $ 1,488.00 | $ 139.99 | 10% |
| ALTEZ | $ 1,971.30 | $ 2,189.00 | $ 217.70 | 11% |
| GOODWOOD RESIDENCE | $ 2,326.31 | $ 2,591.00 | $ 264.69 | 11% |
| THE COTZ | $ 1,164.37 | $ 1,300.00 | $ 135.63 | 12% |
| OASIS @ ELIAS | $ 696.35 | $ 779.00 | $ 82.65 | 12% |
| MARTIN NO 38 | $ 2,309.38 | $ 2,586.00 | $ 276.63 | 12% |
| FLAMINGO VALLEY | $ 1,284.36 | $ 1,441.00 | $ 156.64 | 12% |
| FLORIDIAN | $ 1,599.80 | $ 1,798.00 | $ 198.20 | 12% |
| LUSH ON HOLLAND HILL | $ 1,437.77 | $ 1,634.00 | $ 196.23 | 14% |
| CENTRO RESIDENCES | $ 1,289.45 | $ 1,471.00 | $ 181.55 | 14% |
| DORSETT RESIDENCES | $ 1,760.13 | $ 2,015.00 | $ 254.87 | 14% |
| THE WATERLINE | $ 1,050.52 | $ 1,205.00 | $ 154.48 | 15% |
| SHELFORD SUITES | $ 1,382.25 | $ 1,587.00 | $ 204.75 | 15% |
| 368 THOMSON | $ 1,407.57 | $ 1,621.00 | $ 213.43 | 15% |
| THE LENOX | $ 991.14 | $ 1,142.00 | $ 150.86 | 15% |
| THE SEAFRONT ON MEYER | $ 1,460.13 | $ 1,685.00 | $ 224.88 | 15% |
| HOLLAND RESIDENCES | $ 1,665.85 | $ 1,930.00 | $ 264.15 | 16% |
| WATERFRONT GOLD | $ 995.48 | $ 1,154.00 | $ 158.52 | 16% |
| THE CASCADIA | $ 1,431.30 | $ 1,671.00 | $ 239.70 | 17% |
| WATERVIEW | $ 887.38 | $ 1,043.00 | $ 155.62 | 18% |
| MI CASA | $ 770.68 | $ 913.00 | $ 142.32 | 18% |
| CUBE 8 | $ 1,289.83 | $ 1,529.00 | $ 239.17 | 19% |
| ONAN SUITES | $ 1,054.42 | $ 1,251.00 | $ 196.58 | 19% |
| KOVAN GRANDEUR | $ 1,072.92 | $ 1,294.00 | $ 221.08 | 21% |
| KOVAN RESIDENCES | $ 926.57 | $ 1,127.00 | $ 200.43 | 22% |
| ENVIO | $ 944.08 | $ 1,152.00 | $ 207.92 | 22% |
| D’MIRA | $ 1,077.42 | $ 1,321.00 | $ 243.58 | 23% |
| CONCOURSE SKYLINE | $ 1,804.06 | $ 2,219.00 | $ 414.94 | 23% |
| PARC SOMME | $ 1,216.85 | $ 1,497.00 | $ 280.15 | 23% |
| WATERFRONT WAVES | $ 810.49 | $ 999.00 | $ 188.51 | 23% |
| MEADOWS @ PEIRCE | $ 919.14 | $ 1,139.00 | $ 219.86 | 24% |
| THE MINTON | $ 839.89 | $ 1,041.00 | $ 201.11 | 24% |
| THE SCALA | $ 1,185.26 | $ 1,474.00 | $ 288.74 | 24% |
| THE GALE | $ 758.14 | $ 944.00 | $ 185.86 | 25% |
| TERRENE AT BUKIT TIMAH | $ 1,220.66 | $ 1,521.00 | $ 300.34 | 25% |
| THE INTERLACE | $ 1,048.25 | $ 1,313.00 | $ 264.75 | 25% |
| TREE HOUSE | $ 834.74 | $ 1,055.00 | $ 220.26 | 26% |
| THE CANOPY | $ 649.99 | $ 822.00 | $ 172.01 | 26% |
| THE ESTUARY | $ 763.13 | $ 969.00 | $ 205.87 | 27% |
| THE SHORE RESIDENCES | $ 1,235.73 | $ 1,574.00 | $ 338.27 | 27% |
| THE LAKEFRONT RESIDENCES | $ 1,069.32 | $ 1,366.00 | $ 296.68 | 28% |
| RIVERIA GARDENS | $ 1,873.17 | $ 2,403.00 | $ 529.83 | 28% |
| PARVIS | $ 1,525.14 | $ 1,979.00 | $ 453.86 | 30% |
| THE AMERY | $ 995.10 | $ 1,295.00 | $ 299.90 | 30% |
| LIVIA | $ 643.69 | $ 842.00 | $ 198.31 | 31% |
| LA BRISA | $ 951.57 | $ 1,253.00 | $ 301.43 | 32% |
| BEACON HEIGHTS | $ 863.47 | $ 1,157.00 | $ 293.53 | 34% |
| BLISS VILLE | $ 817.17 | $ 1,096.00 | $ 278.83 | 34% |
| CASA AERATA | $ 929.76 | $ 1,253.00 | $ 323.24 | 35% |
| WATERFRONT KEY | $ 860.72 | $ 1,162.00 | $ 301.28 | 35% |
| WATERBANK AT DAKOTA | $ 1,174.35 | $ 1,591.00 | $ 416.65 | 35% |
| PARC SEABREEZE | $ 1,357.65 | $ 1,850.00 | $ 492.35 | 36% |
| DAKOTA RESIDENCES | $ 1,038.07 | $ 1,423.00 | $ 384.93 | 37% |
| TREVISTA | $ 1,006.25 | $ 1,389.00 | $ 382.75 | 38% |
| THE PEAK@BALMEG | $ 1,024.35 | $ 1,427.00 | $ 402.65 | 39% |
| HUNDRED TREES | $ 917.31 | $ 1,284.00 | $ 366.69 | 40% |
| ST PATRICK’S RESIDENCES | $ 1,027.69 | $ 1,476.00 | $ 448.31 | 44% |
| MODA | $ 1,264.18 | $ 1,827.00 | $ 562.82 | 45% |
| THE PARC CONDOMINIUM | $ 938.38 | $ 1,360.00 | $ 421.62 | 45% |
| ESPARINA RESIDENCES | $ 748.84 | $ 1,116.00 | $ 367.16 | 49% |
| COASTAL BREEZE RESIDENCES | $ 595.80 | $ 895.00 | $ 299.20 | 50% |
| CLOVER BY THE PARK | $ 863.71 | $ 1,320.00 | $ 456.29 | 53% |
| ELLIOT AT THE EAST COAST | $ 1,041.31 | $ 1,634.00 | $ 592.69 | 57% |
| DOUBLE BAY RESIDENCES | $ 677.63 | $ 1,133.00 | $ 455.37 | 67% |
| THE WHARF RESIDENCE | $ 1,199.07 | $ 2,146.00 | $ 946.93 | 79% |
This marks the end of the list. As always, feel free to reach out to us at hello@stackedhomes if you have a query you’d like answering, or even an article idea that you feel should come to fruition. We’d love to hear from you!
At Stacked, we like to look beyond the headlines and surface-level numbers, and focus on how things play out in the real world.
If you’d like to discuss how this applies to your own circumstances, you can reach out for a one-to-one consultation here.
And if you simply have a question or want to share a thought, feel free to write to us at stories@stackedhomes.com — we read every message.
Frequently asked questions
How have sale prices of condos from 2010 changed by 2019?
Which regions in Singapore saw the highest property appreciation from 2010 to 2019?
What districts in Singapore experienced the most sales of new condos between 2010 and 2019?
Are most property investments in Singapore profitable over the decade?
What is the difference in appreciation between freehold and leasehold condos from 2010 to 2019?
Reuben Dhanaraj
Reuben is a digital nomad gone rogue. An avid traveler, photographer and public speaker, he now resides in Singapore where he has since found a new passion in generating creative and enriching content for Stacked. Outside of work, you’ll find him either relaxing in nature or retreated to his cozy man-cave in quiet contemplation.Need help with a property decision?
Speak to our team →Read next from Property Investment Insights
Property Investment Insights This Singapore Condo Has Bigger Units Near The MRT — But Timing Decided Who Made Money

Property Investment Insights We Compared Lease Decay Across HDB Towns — The Differences Are Significant

Property Investment Insights This Singapore Condo Skipped 1-Bedders And Focused On Space — Here’s What Happened 8 Years Later
Property Investment Insights Why Buyers in the Same Condo Ended Up With Very Different Results
Latest Posts
On The Market A 40-Year-Old Prime District 10 Condo Is Back On The Market — As Ultra-Luxury Prices In Singapore Hit New Highs

Editor's Pick Happy Chinese New Year from Stacked

Singapore Property News Nearly 1,000 New Homes Were Sold Last Month — What Does It Say About the 2026 New Launch Market?




6 Comments
Hi Reuben, believe something don’t tally with the graph?
Based on that, 7 of the 43 leasehold condos (16%) saw overall depreciation figures as did 24 out of 80 freehold condos (30%).
District 1 lost so much :O
How to download these articles?