


It may sound like a bit of a strange title, given that most people wouldn’t expect to associate gains with the word Covid-19, but this is the current situation we find ourselves in.
If you’ve been following the news, you’ll notice that Covid-19’s effect on Singapore real estate has been surprising. In April 2020, for instance, analysts predicted a fall of between three to five per cent in the property price index; some predicted a correction of as much as eight per cent.
So far, the market has refused to behave itself.
Private home prices for Q3 2020 went up again, by 0.8 per cent – this is about three times higher than the 0.3 per cent in Q2. Bizarrely, it was only in Q1 of this year – before the Circuit Breaker – when prices dipped by one per cent.
On a year-on-year basis, prices have been mostly flat; but they’re still slightly up by around 0.1 per cent compared to 2019.
The challenge for many buyers today isn't access to information.
It's interpreting that information in a way that makes sense for their finances, goals, and stage of life.
Over time, that's also why we decided to work with agents who shared the same data-driven and advisory-led approach behind our editorial, consultants who could help readers think through decisions more objectively, rather than simply push transactions.
Today, the team has worked with more than 2,000 clients across over $5B in property transactions.
In light of this, we thought it would be interesting to see – more specifically – which areas have been best at defying predictions to date.
This is how districts have seen private home prices move, between March to September (the peak of the Covid-19 infections, and the Circuit Breaker period):
Note: In the following, we have chosen to exclude the prices of new launches in the district. This is to avoid inflating the gains that occur when new launches have just emerged, such as in district 10 which saw multiple new launches of late (see below).
District | Price PSF in March | Transaction volume in March | Price PSF in September | Transaction volume in September: | Percentage Gain % | Annualised Gain% |
| 3 | $1,535 | 14 | $1,830 | 7 | 19.21824104 | 38.43648208 |
| 14 | $1,090 | 28 | $1,279 | 40 | 17.33944954 | 34.67889908 |
| 12 | $1,341 | 24 | $1,519 | 27 | 13.27367636 | 26.54735272 |
| 10 | $1,727 | 48 | $1,941 | 52 | 12.39143023 | 24.78286045 |
| 8 | $1,336 | 7 | $1,439 | 6 | 7.709580838 | 15.41916168 |
| 13 | $1,389 | 7 | $1,469 | 14 | 5.759539237 | 11.51907847 |
| 7 | $1,694 | 5 | $1,786 | 2 | 5.430932704 | 10.86186541 |
| 26 | $1,019 | 7 | $1,067 | 12 | 4.710500491 | 9.421000981 |
| 18 | $945 | 55 | $975 | 55 | 3.174603175 | 6.349206349 |
| 1 | $2,218 | 32 | $2,288 | 11 | 3.155996393 | 6.311992786 |
| 16 | $1,081 | 26 | $1,102 | 45 | 1.942645698 | 3.885291397 |
| 19 | $1,029 | 86 | $1,040 | 109 | 1.068999028 | 2.137998056 |
| 20 | $1,240 | 21 | $1,249 | 26 | 0.7258064516 | 1.451612903 |
| 27 | $861 | 23 | $854 | 31 | -0.8130081301 | -1.62601626 |
| 11 | $1,614 | 28 | $1,597 | 26 | -1.053283767 | -2.106567534 |
| 21 | $1,293 | 28 | $1,275 | 24 | -1.392111369 | -2.784222738 |
| 17 | $863 | 24 | $838 | 27 | -2.896871379 | -5.793742758 |
| 25 | $780 | 13 | $755 | 15 | -3.205128205 | -6.41025641 |
| 23 | $963 | 54 | $927 | 55 | -3.738317757 | -7.476635514 |
| 22 | $1,058 | 16 | $1,017 | 15 | -3.875236295 | -7.75047259 |
| 4 | $1,497 | 11 | $1,423 | 17 | -4.943219773 | -9.886439546 |
| 5 | $1,225 | 24 | $1,158 | 16 | -5.469387755 | -10.93877551 |
| 9 | $2,049 | 29 | $1,927 | 55 | -5.954123963 | -11.90824793 |
| 15 | $1,367 | 64 | $1,252 | 61 | -8.412582297 | -16.82516459 |
| 28 | $1,184 | 16 | $1,058 | 18 | -10.64189189 | -21.28378378 |
| 2 | $2,242 | 8 | $1,610 | 11 | -28.18911686 | -56.37823372 |
Top five districts during Covid-19 (as of Sept 2020)
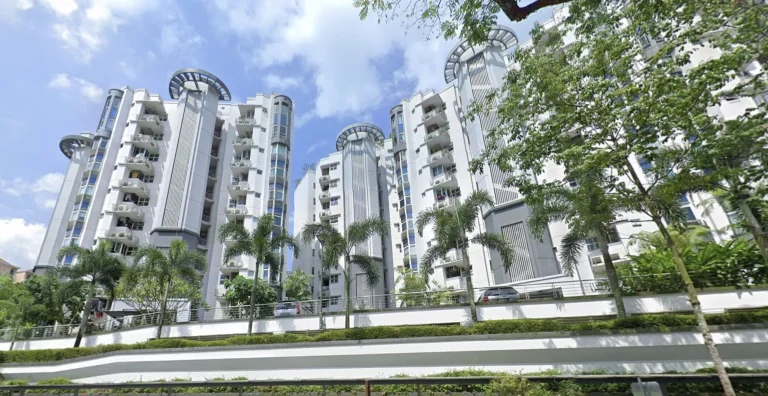
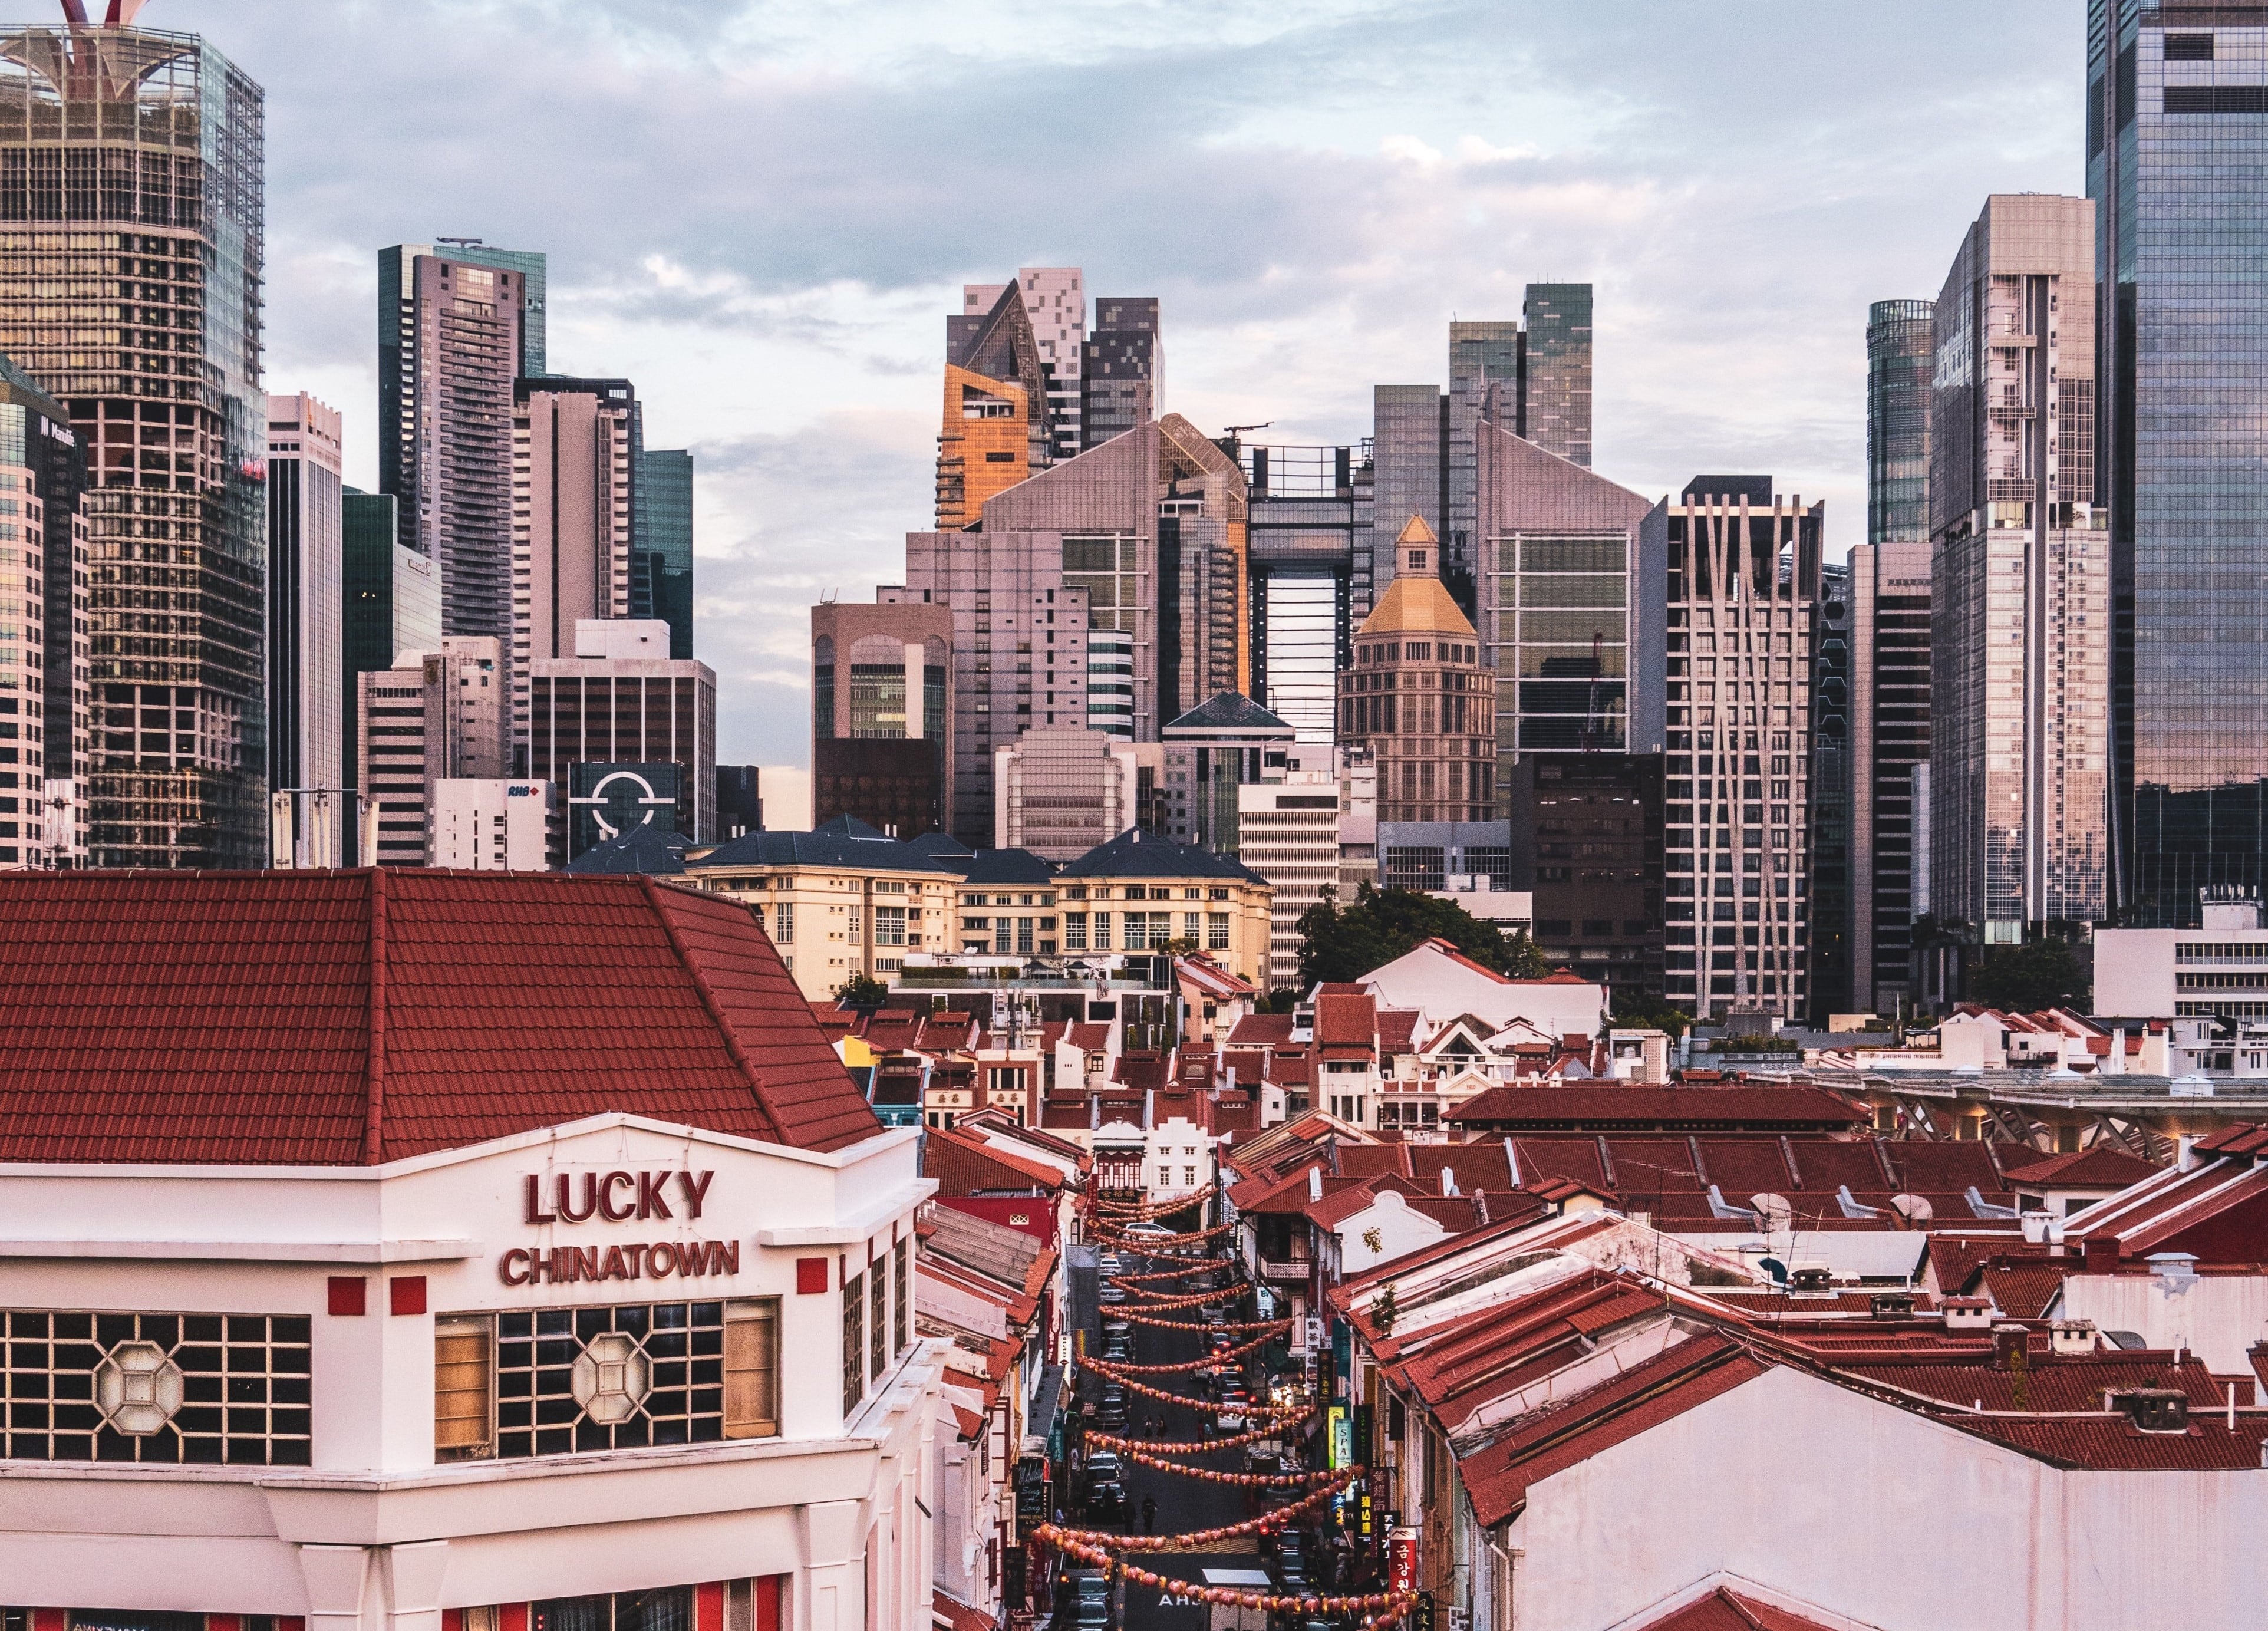
- District 3 (Tiong Bahru, Queenstown)
- District 14 (Eunos, Geylang, Paya Lebar)
- District 12 (Novena, Toa Payoh)
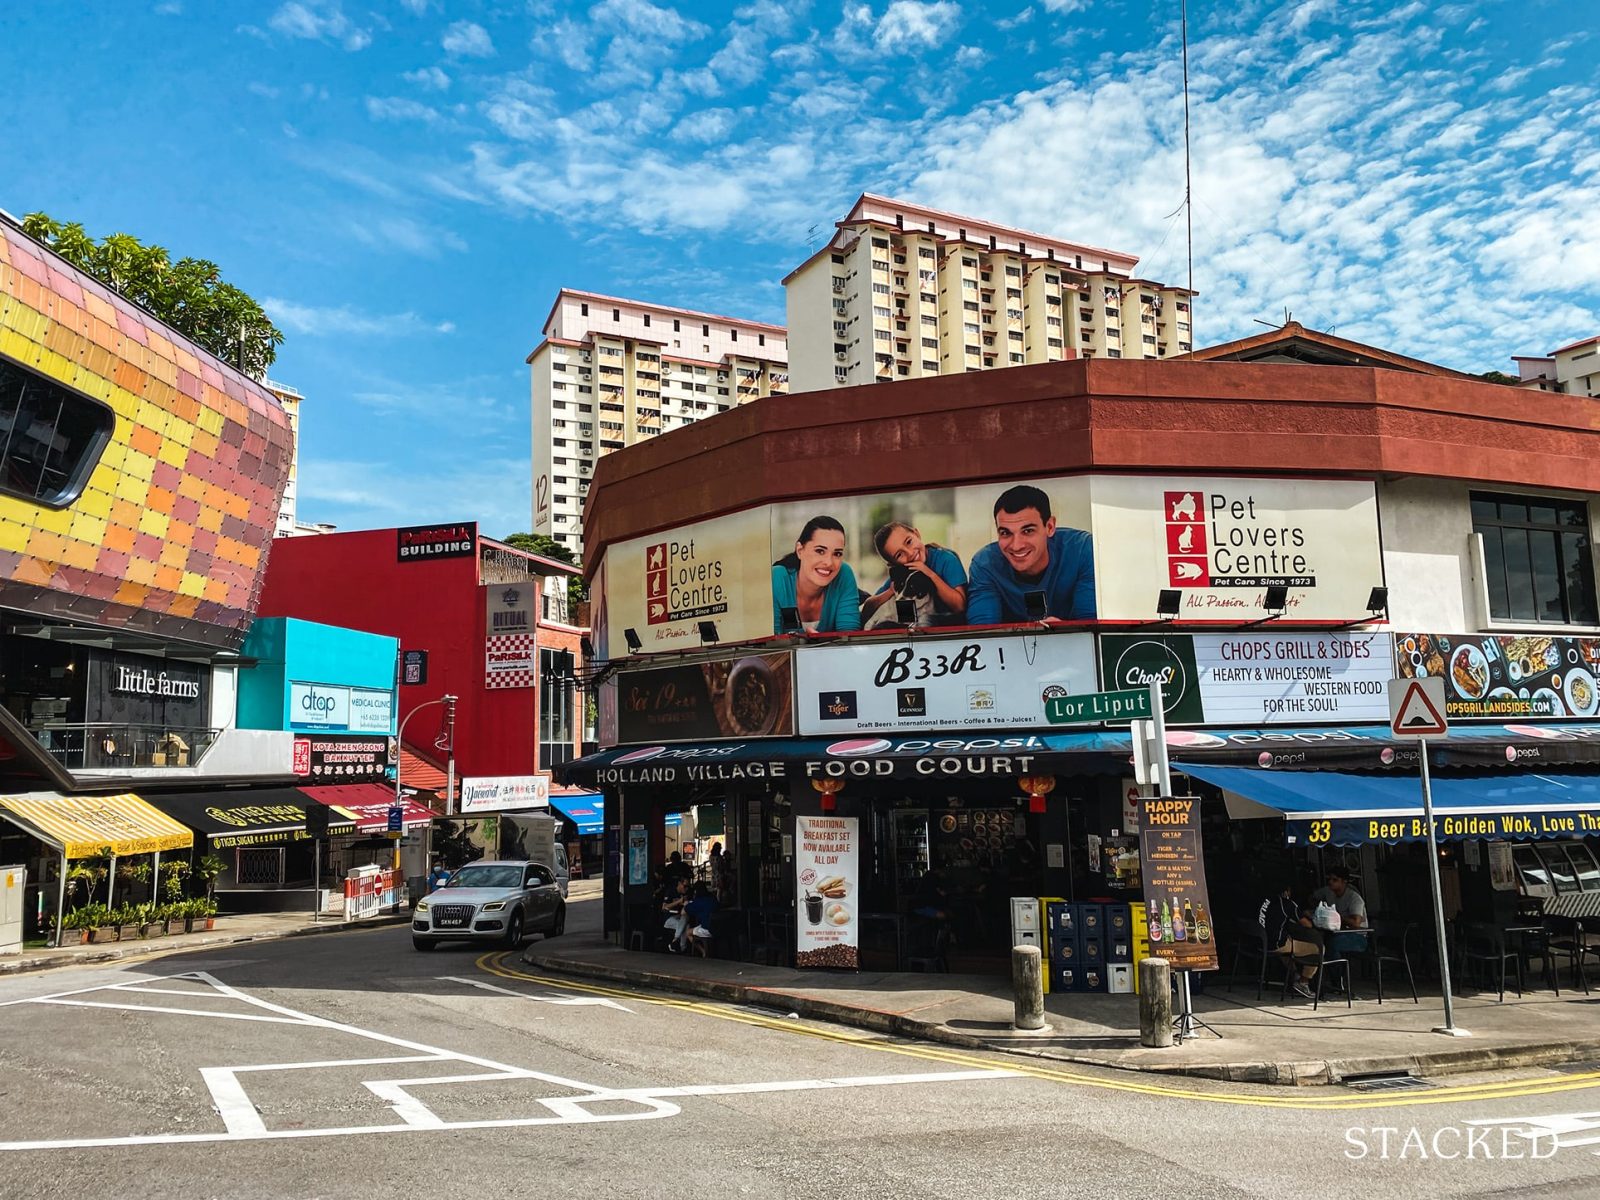
- District 10 (Balmoral, Bukit Timah, Holland V)
- District 8 (Little India, Serangoon Road)
Notable highlights:
1. The RCR may lead the pack for this entire quarter, not just till September
Note that none of the top performing districts during Covid-19 came from the Outside of Central Region (OCR). Except for District 10, everything on the list above came from the Rest of Central Region (RCR). This is so far in-line with URA flash estimates for Q3 2020:
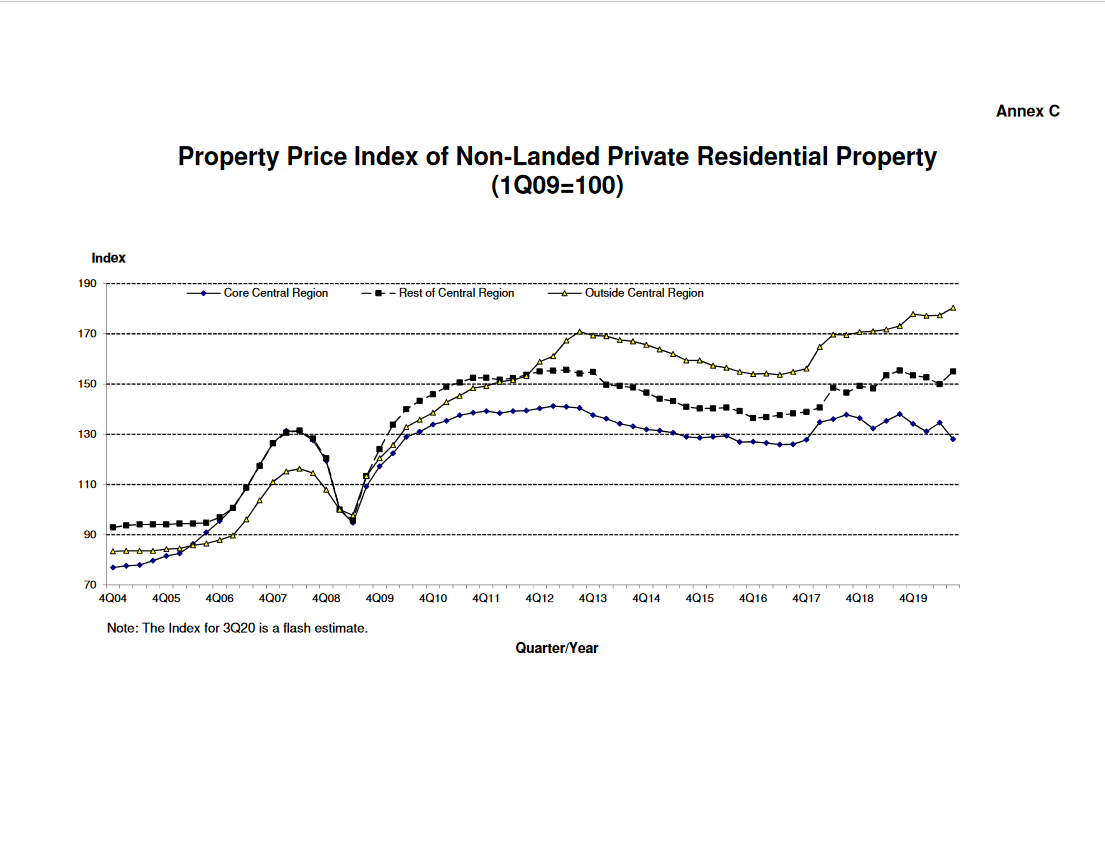
Private non-landed homes in the RCR are estimated to have risen 3.3 per cent, while properties in the OCR have risen 1.7 per cent. Properties in the CCR have fallen by 4.9 per cent.
(Note: transaction prices for flash estimates are based on contracts submitted for stamp duty payment, and developer sales up till mid-September).
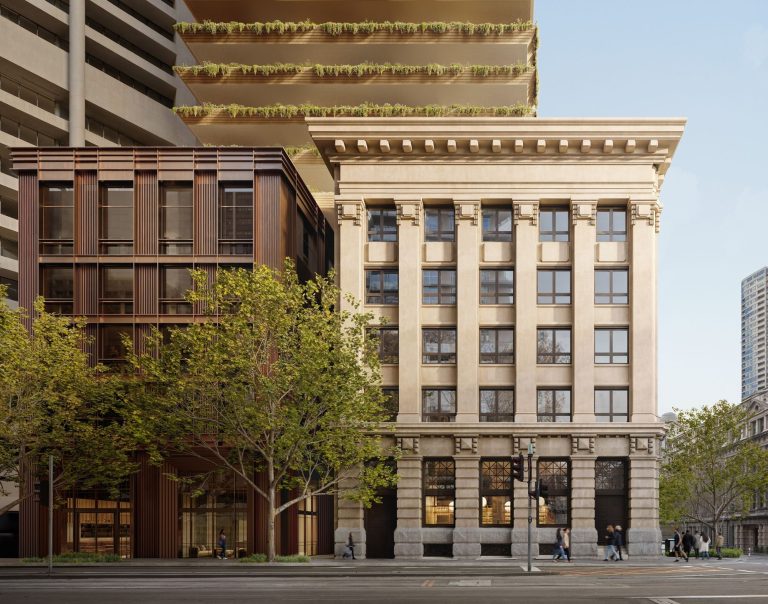
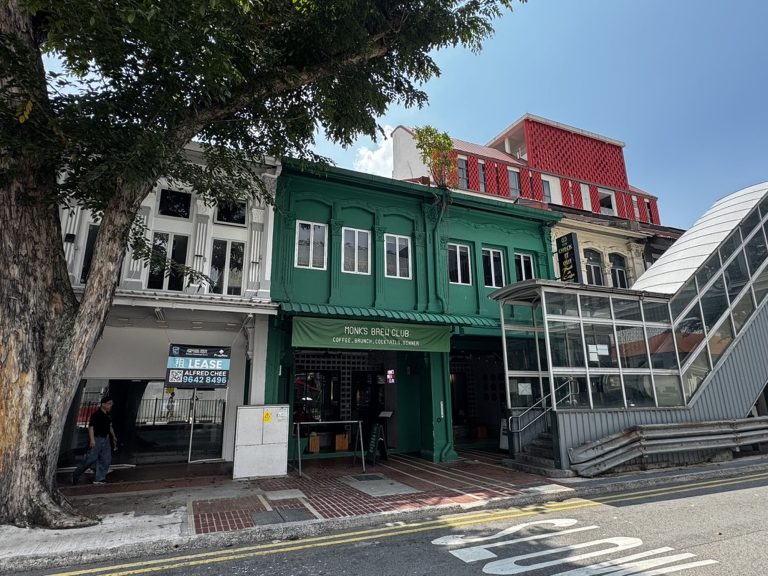
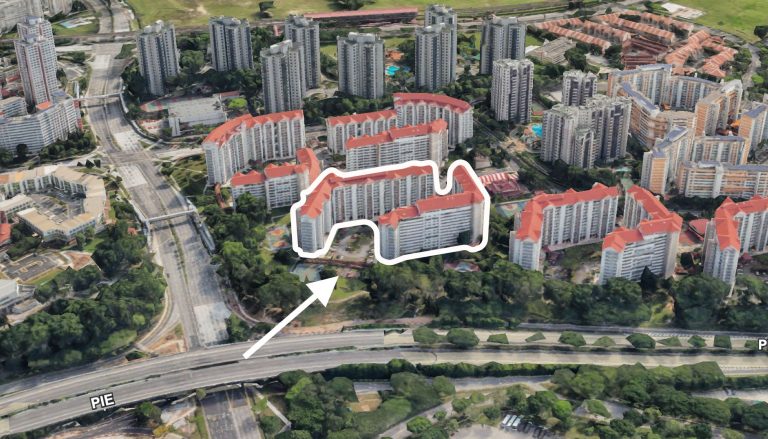
2. The Landmark may help District 3 to maintain its momentum
District 3 is a bit of a hot spot thanks to the Rail Corridor. This is a 24-kilometre stretch of nature walks, eateries, etc. built on the old rail system. Queenstown, already a mature district, is set to benefit from this – new housing in Queenstown, for instance, is set to be integrated with the corridor.
We can see HDB upgraders, most of whom are families, seeing more interest in this area (and it may have already started).
As an aside, district 3 has done well even excluding new launches; but the launch of The Landmark is likely to keep the momentum going.
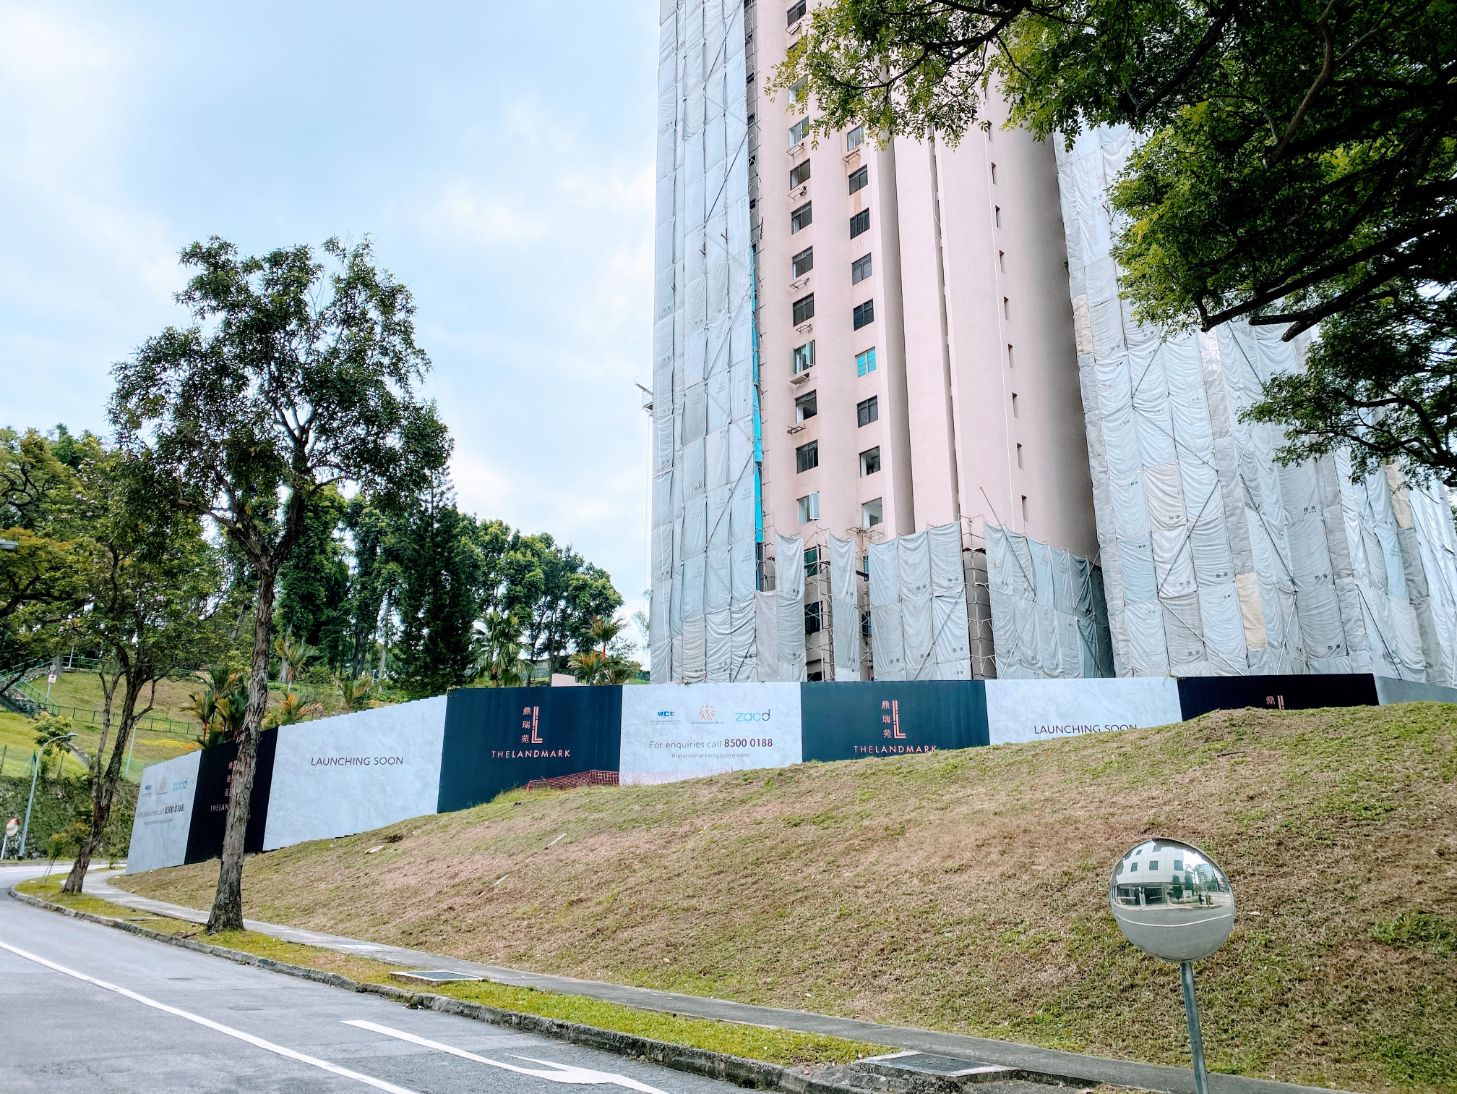
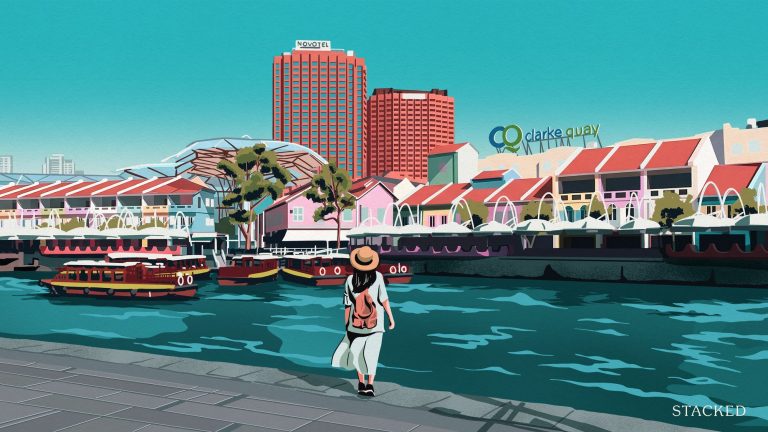
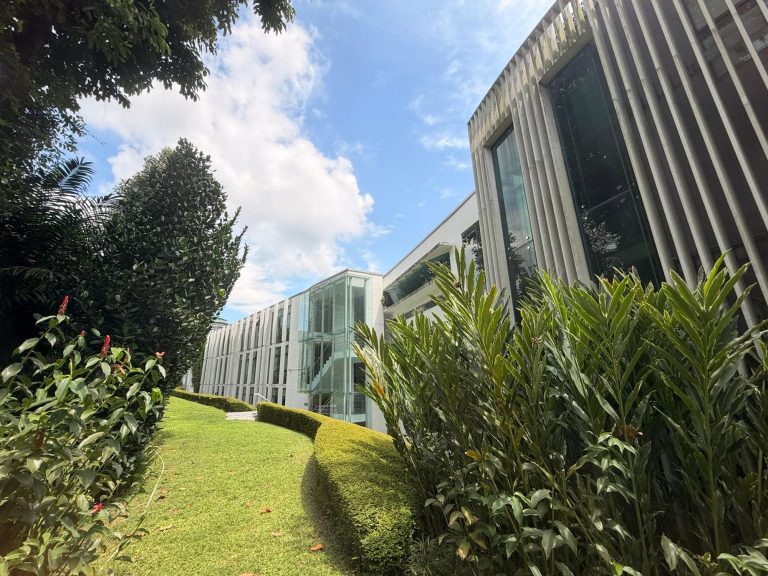
This condo is a seven-minute walk to Chinatown MRT station, and about a 13-minute walk to Clarke Quay MRT station. We previously highlighted this as going for around $1,993 psf. On paper this sounds quite attractive, but One Pearl Bank (launched last year) is likely to provide some competition: it’s three minutes from the Outram MRT station, and about nine minutes to Chinatown MRT station. The main issue is that One Pearl Bank is averaging $2,500 psf, which may put off buyers.
We’ll try to get a more in-depth view on these two and the unfolding sales, so do follow us on Facebook.
3. District 10 may continue to buck the downward trend in the CCR, just on the volume of new launches
There’s renewed vigour in Holland Village, which has been designated as a new identity node. The URA Master Plan 2019 has more details on this; but to put it briefly, plans include weekend market and outdoor performances, and a new communal courtyard with retail and dining. The overall scheme seems to give Holland Village a New York East-Village-esque vibe.
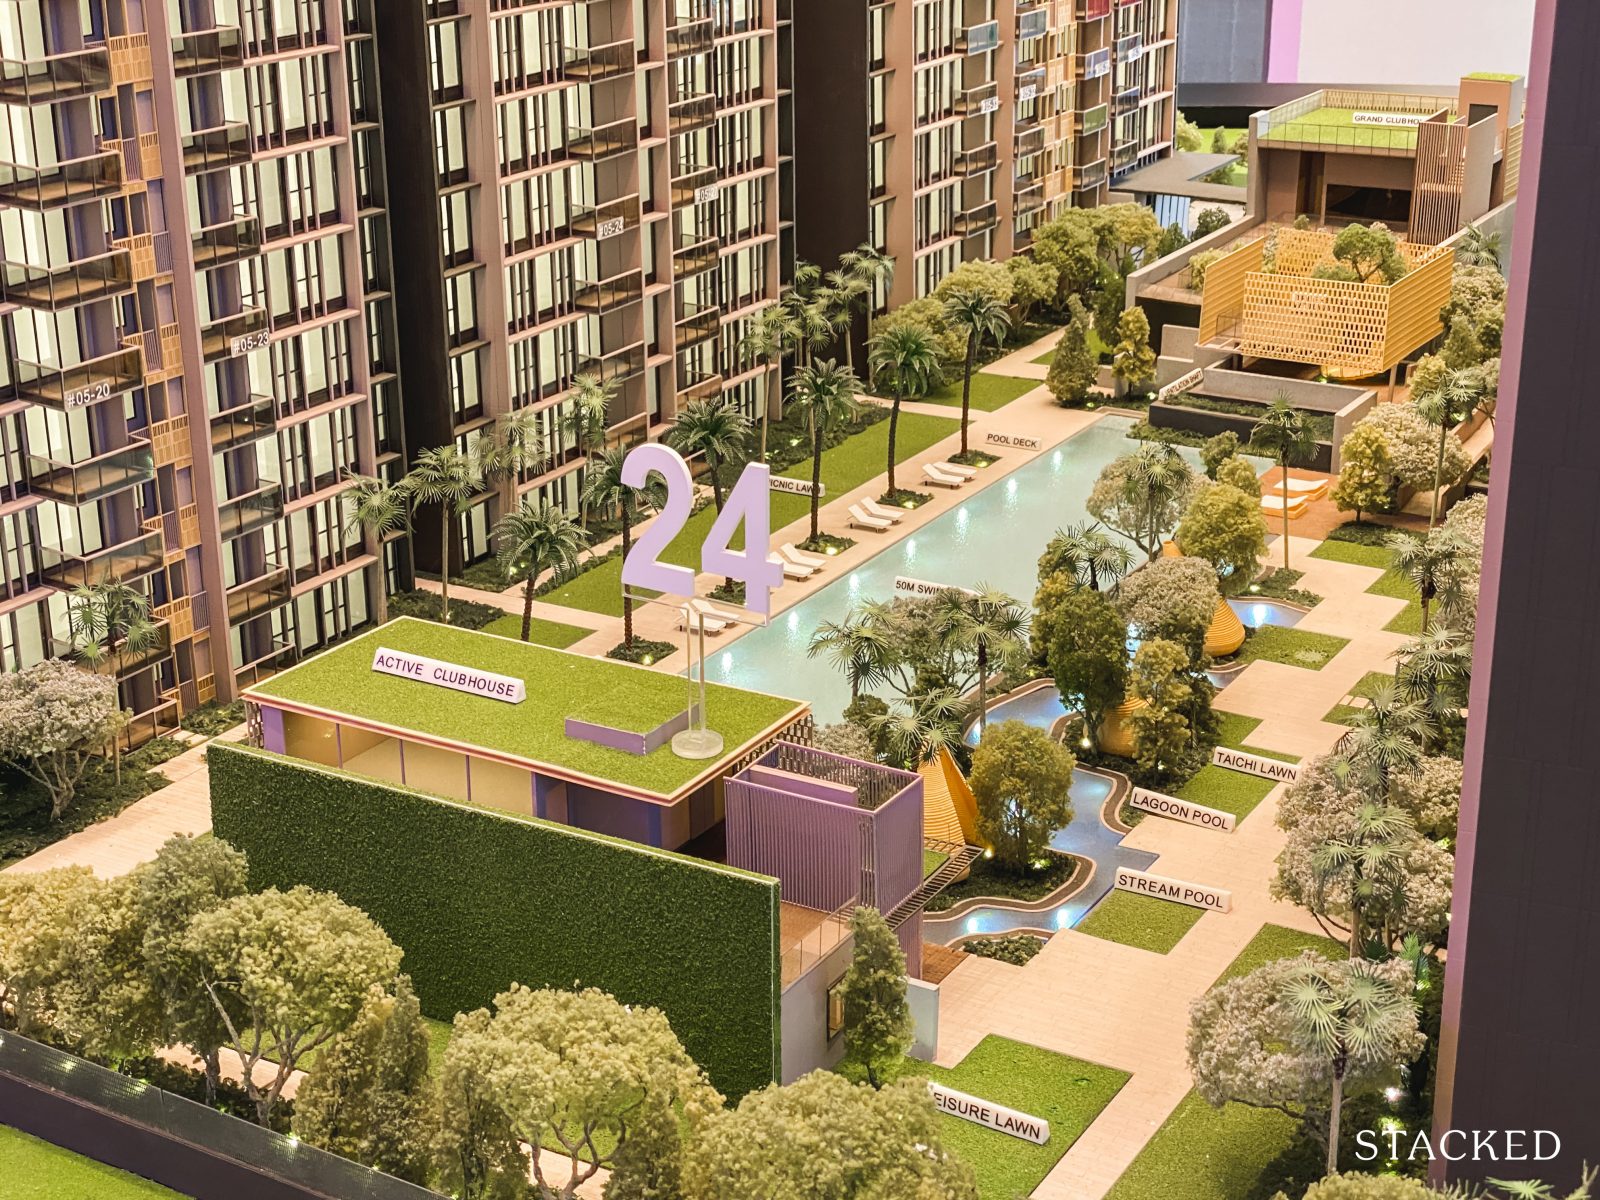
This could explain why, unlike its other counterparts in the CCR, District 10 has managed to stay on top. In the coming months, District 10 is also likely to climb higher on the list, if for no reason than the upcoming launches:
- 15 Holland Hill
- 19 Nassim
- Dalvey Haus
- Hyll on Holland
- Leedon Green
- Mooi Residences
- Van Holland
*The large number of new launches is one reason why we excluded their prices, otherwise district 10 may top the list.
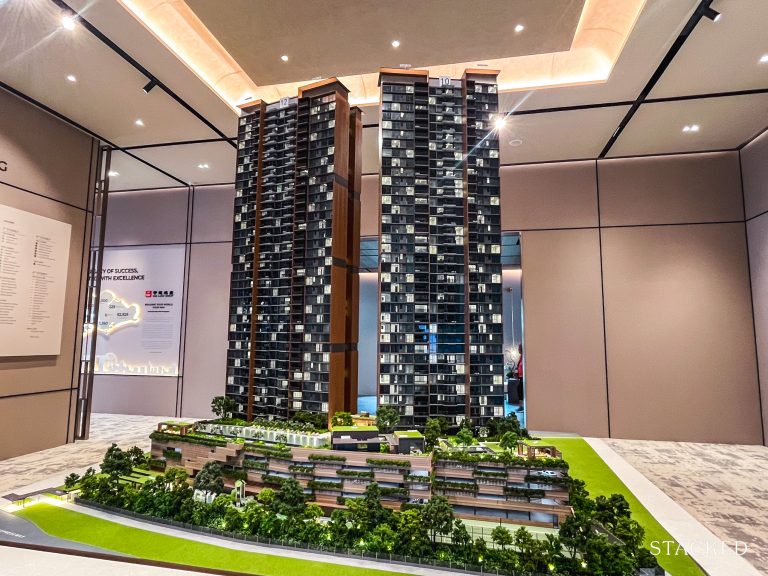
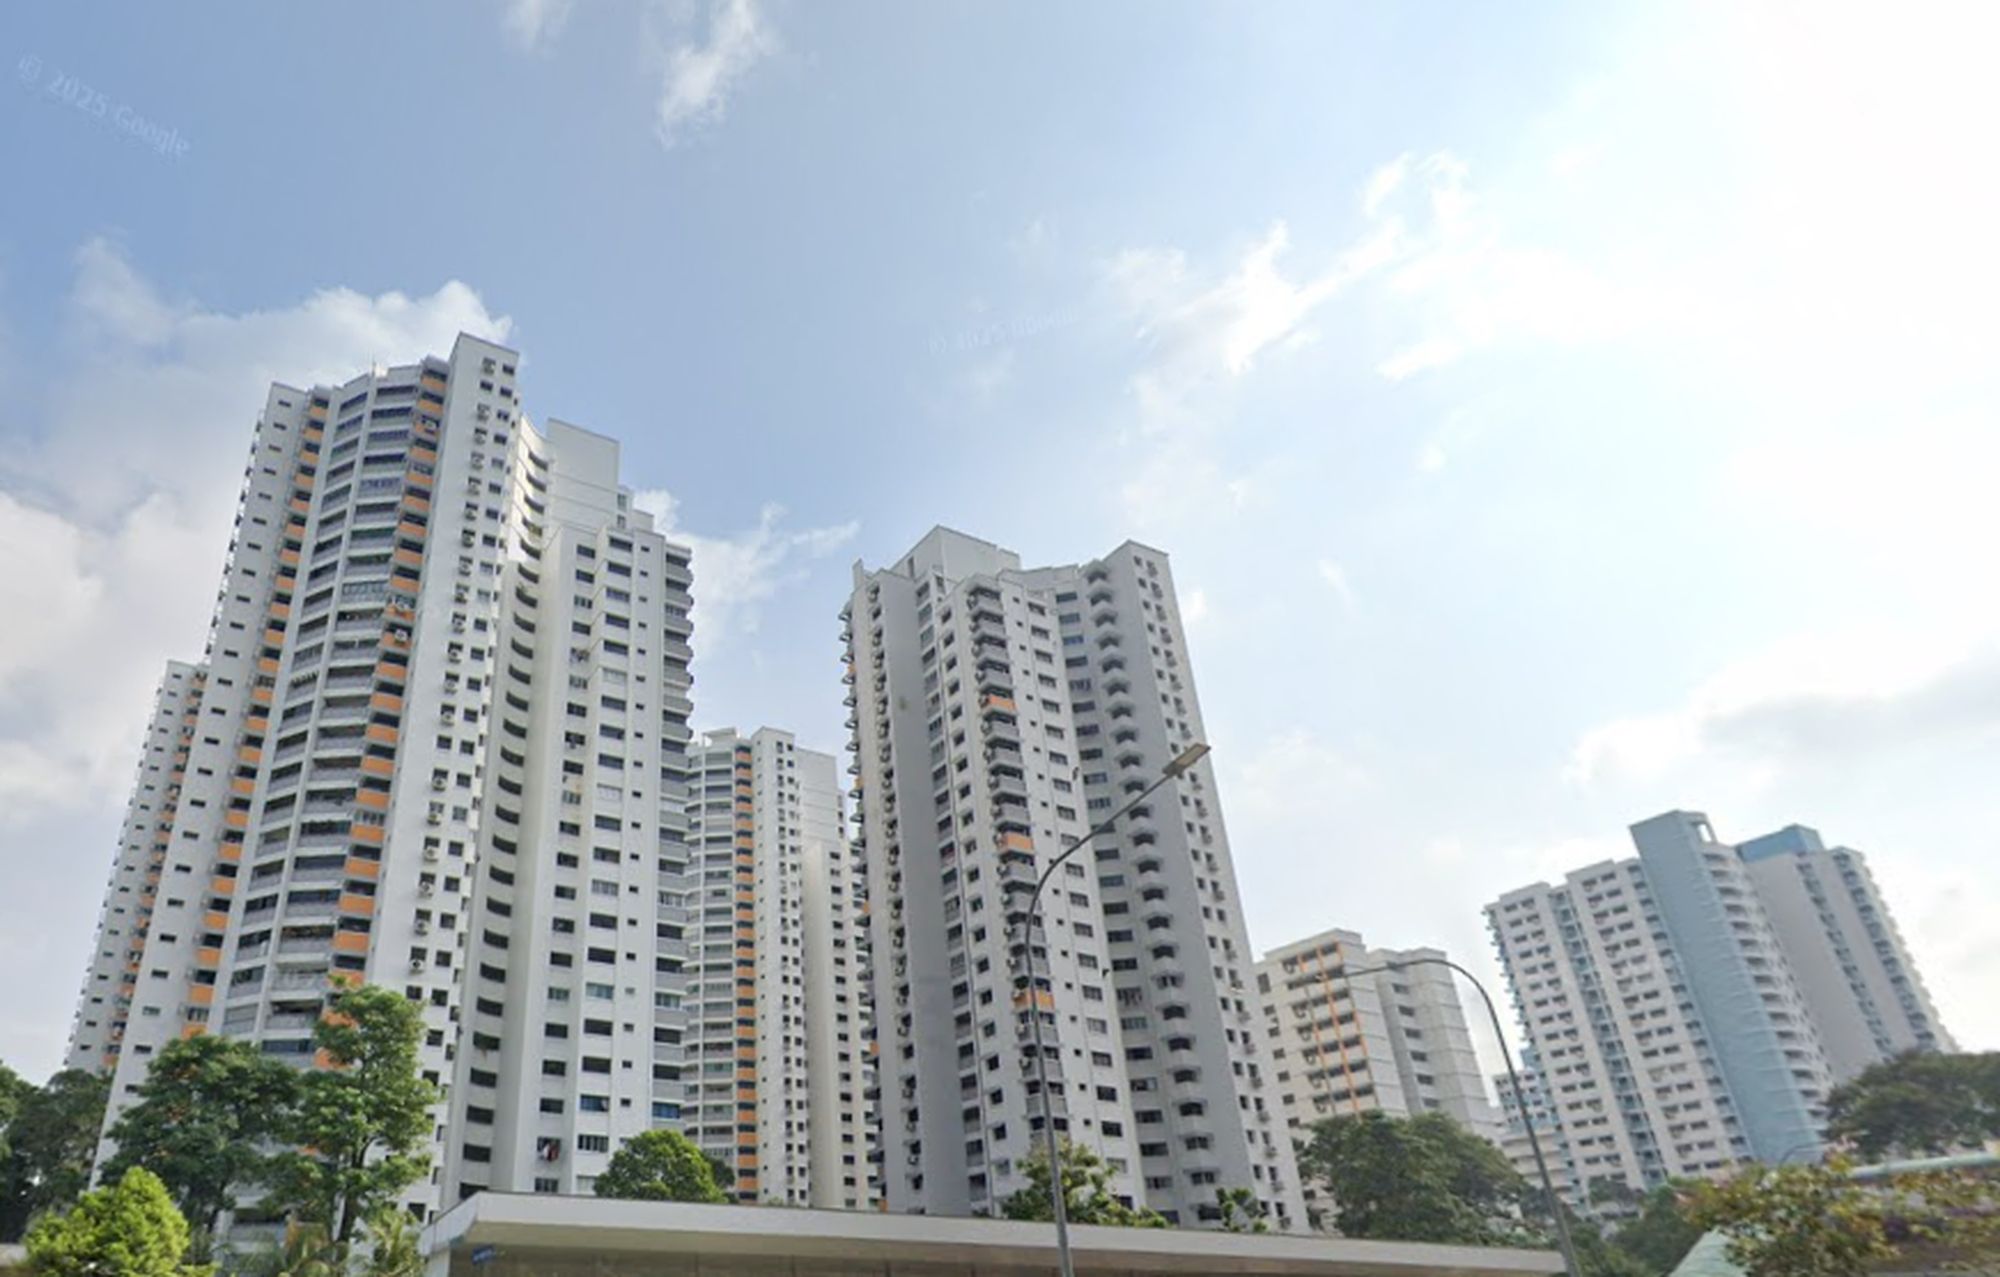
4. The pick-up in District 14 could be further sustained by the arrival of Penrose
It’s not a surprise to District 14 ignoring a downturn and picking up anyway; it has a history of doing this. In past years, it’s seen even further advantage with the re-zoning of 14 hectares, which will no longer permit residential properties (thus limiting supply and pushing up prices).
While many may sneer at District 14 for including a Red Light area, this is one of the biggest rental hotspots – not just because of the large number of foreign workers who get housed here, but because of its easy access to the CBD.
In the coming months, this district looks likely to keep its position thanks to the coming of Penrose.
We’ve covered Penrose in a more detailed review; at the time we estimated prices here to be at $1,400 to $1,600 psf; this would make it competitive with Antares and Sims Urban Oasis nearby.
Penrose is also just seven minutes from the Aljunied MRT station. Coupled with its city fringe location, this is probably going to be the highlight of the District. Penrose was 60 per cent sold on its launch weekend at the end September, and District 14 is already second-highest without its inclusion.
5. The list of top gainers may need to be drastically shuffled though, when we see the results of Q4 2020
Take what you see with a grain of salt, for one important reason: this is the last quarter free of re-issued OTP restrictions.
If URA and some analysts prove correct, and what we see are inflated sales figures from new launches, then these may not be the top Districts after all. The new sales shown for all the District 10 launches, for example, may well be lower than we think (and gains may not be as great after all).
On the other hand, if these results are broadly similar by end-2020, it may be a sign that re-issued OTPs didn’t inflate the figures by too much after all.
Please bear in mind that this is only a snapshot of the current situation
None of this is a decisive argument that the above districts are “recession resistant”, or have some fundamental way to evade Covid-19 effects. In fact, many of the likely reasons – as we’ve described above – are momentary ones.
We will need to wait till much later down the road, such as from the end of Covid-19 support measures, to get a clearer picture of which districts weathered the storm best.
For now however, home buyers may want to brace for prices in these areas being quite resilient, Covid-19 or not. To get further updates on the situation, do like us on Facebook.
At Stacked, we like to look beyond the headlines and surface-level numbers, and focus on how things play out in the real world.
If you’d like to discuss how this applies to your own circumstances, you can reach out for a one-to-one consultation here.
And if you simply have a question or want to share a thought, feel free to write to us at stories@stackedhomes.com — we read every message.

0 Comments