District 7 vs District 9: Which Prime Location Has Delivered Better Condo Value?

Get The Property Insights Serious Buyers Read First: Join 50,000+ readers who rely on our weekly breakdowns of Singapore’s property market.

A seasoned content strategist with over 17 years in the real estate and financial journalism sectors, Ryan has built a reputation for transforming complex industry jargon into accessible knowledge. With a track record of writing and editing for leading financial platforms and publications, Ryan's expertise has been recognised across various media outlets. His role as a former content editor for 99.co and a co-host for CNA 938's Open House programme underscores his commitment to providing valuable insights into the property market.
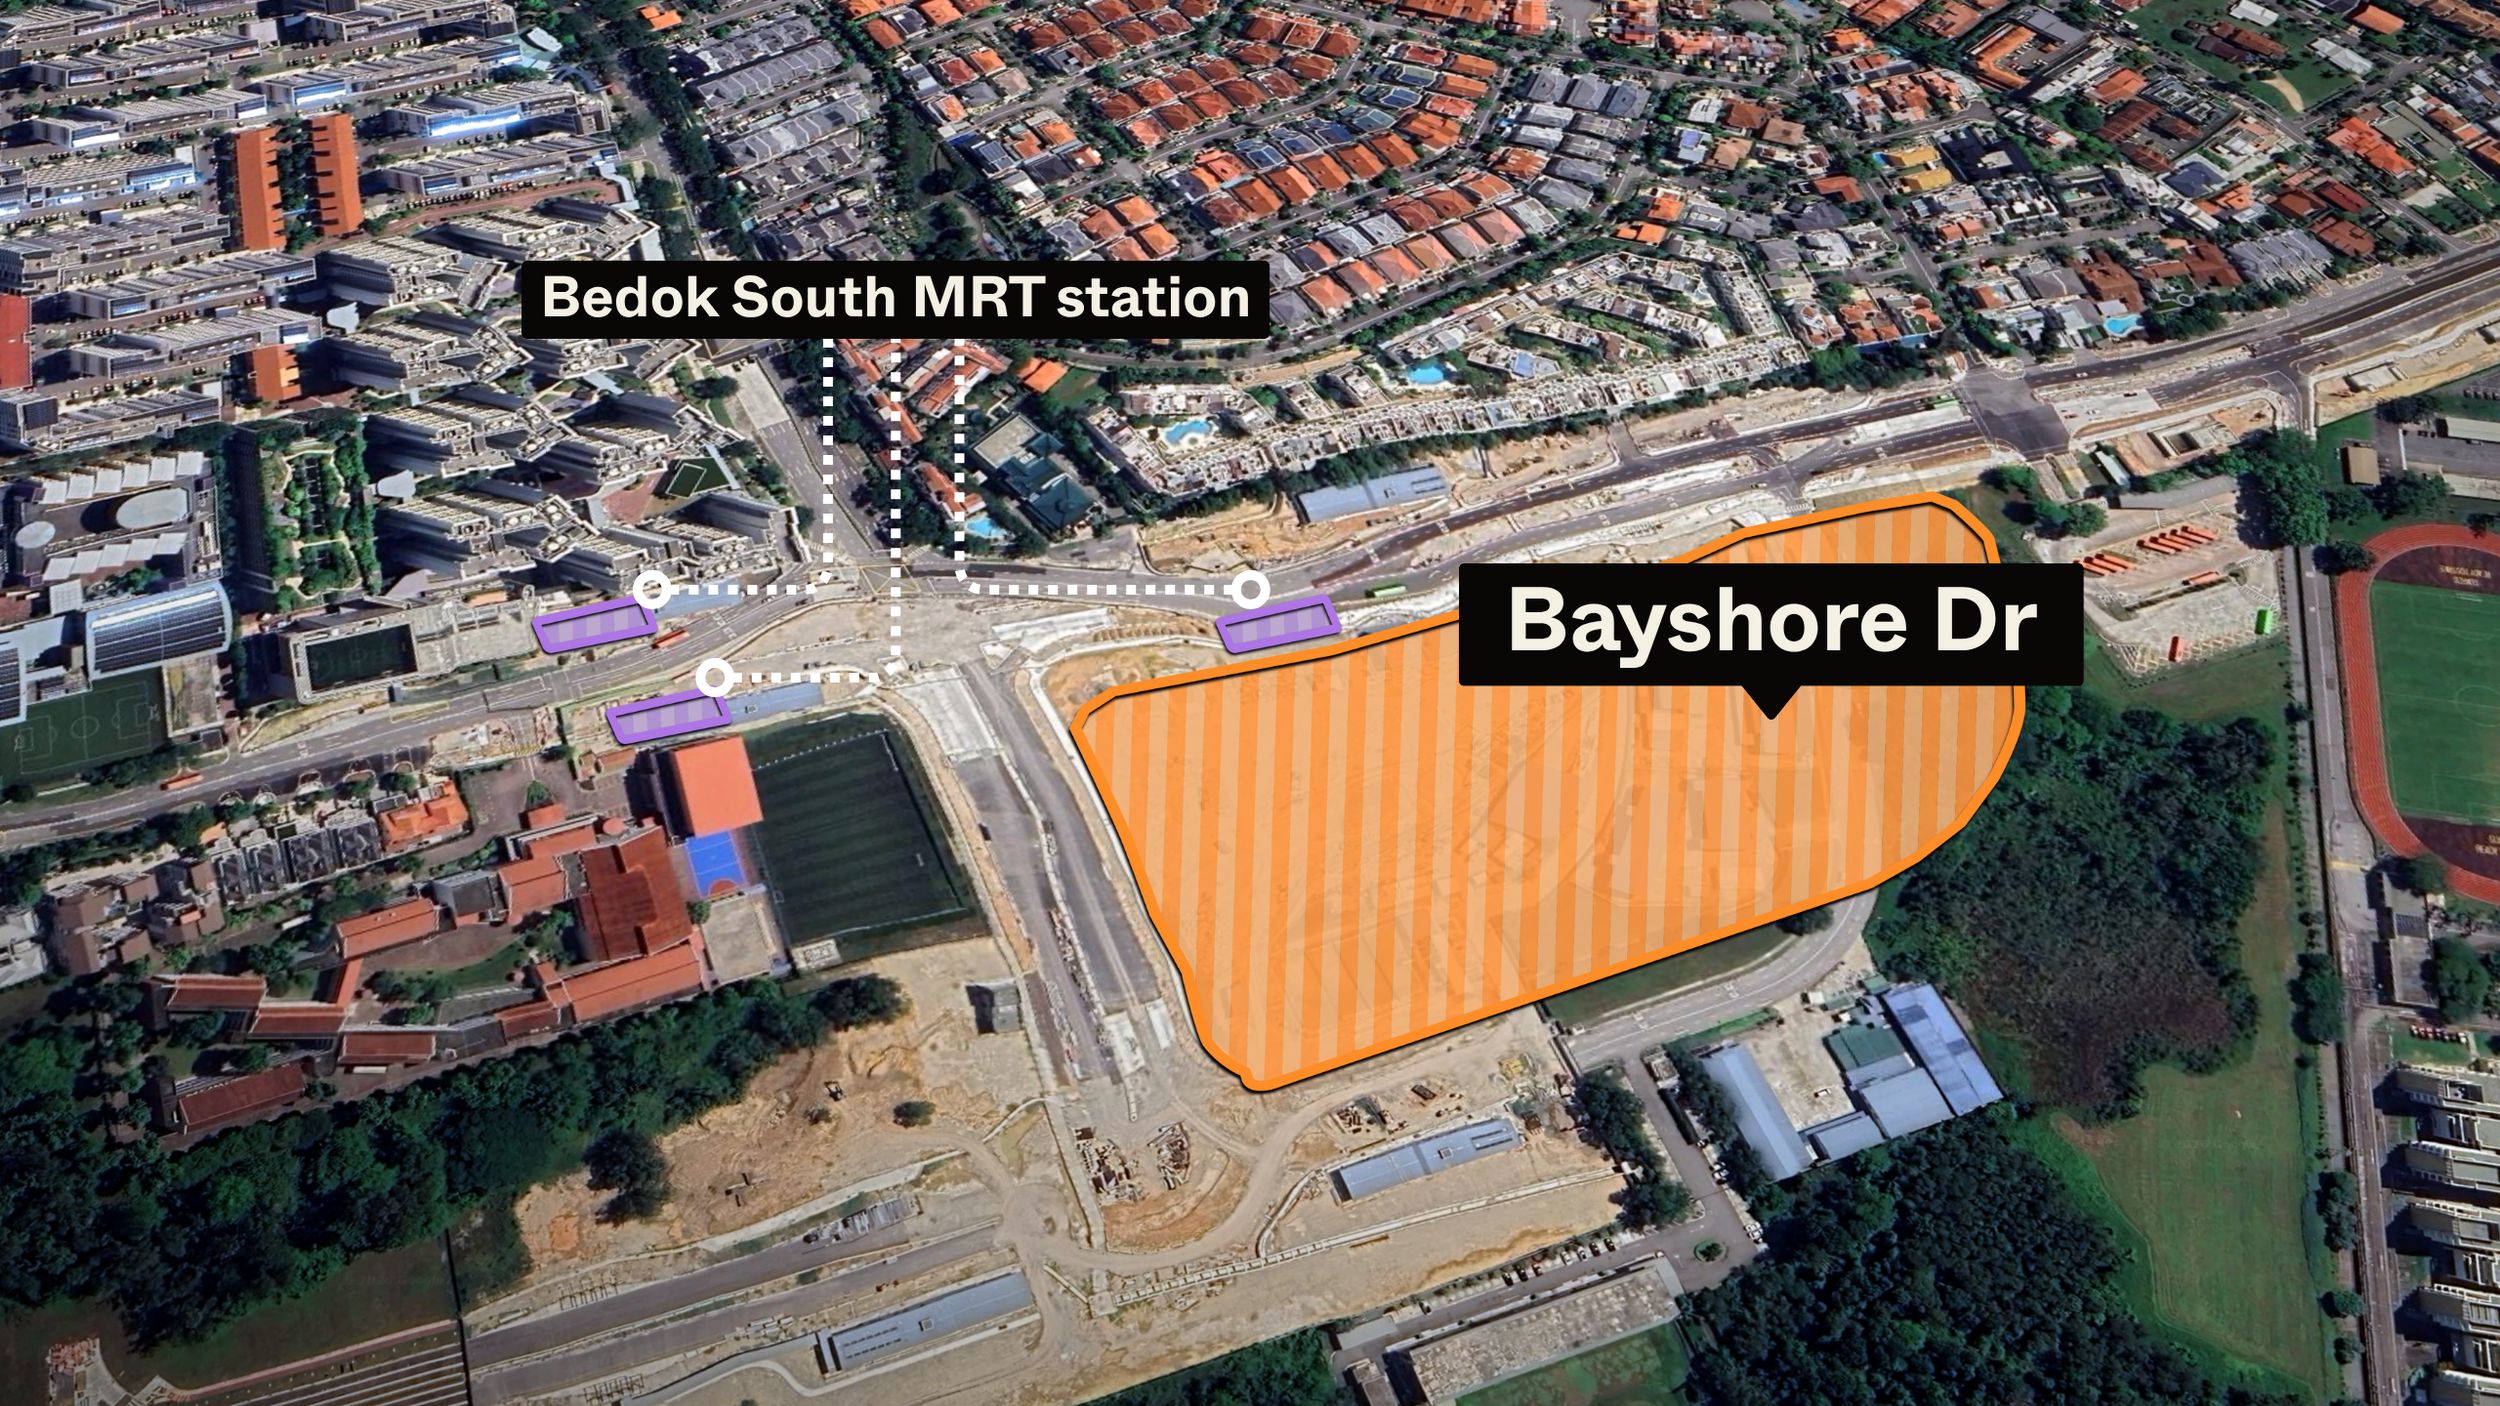
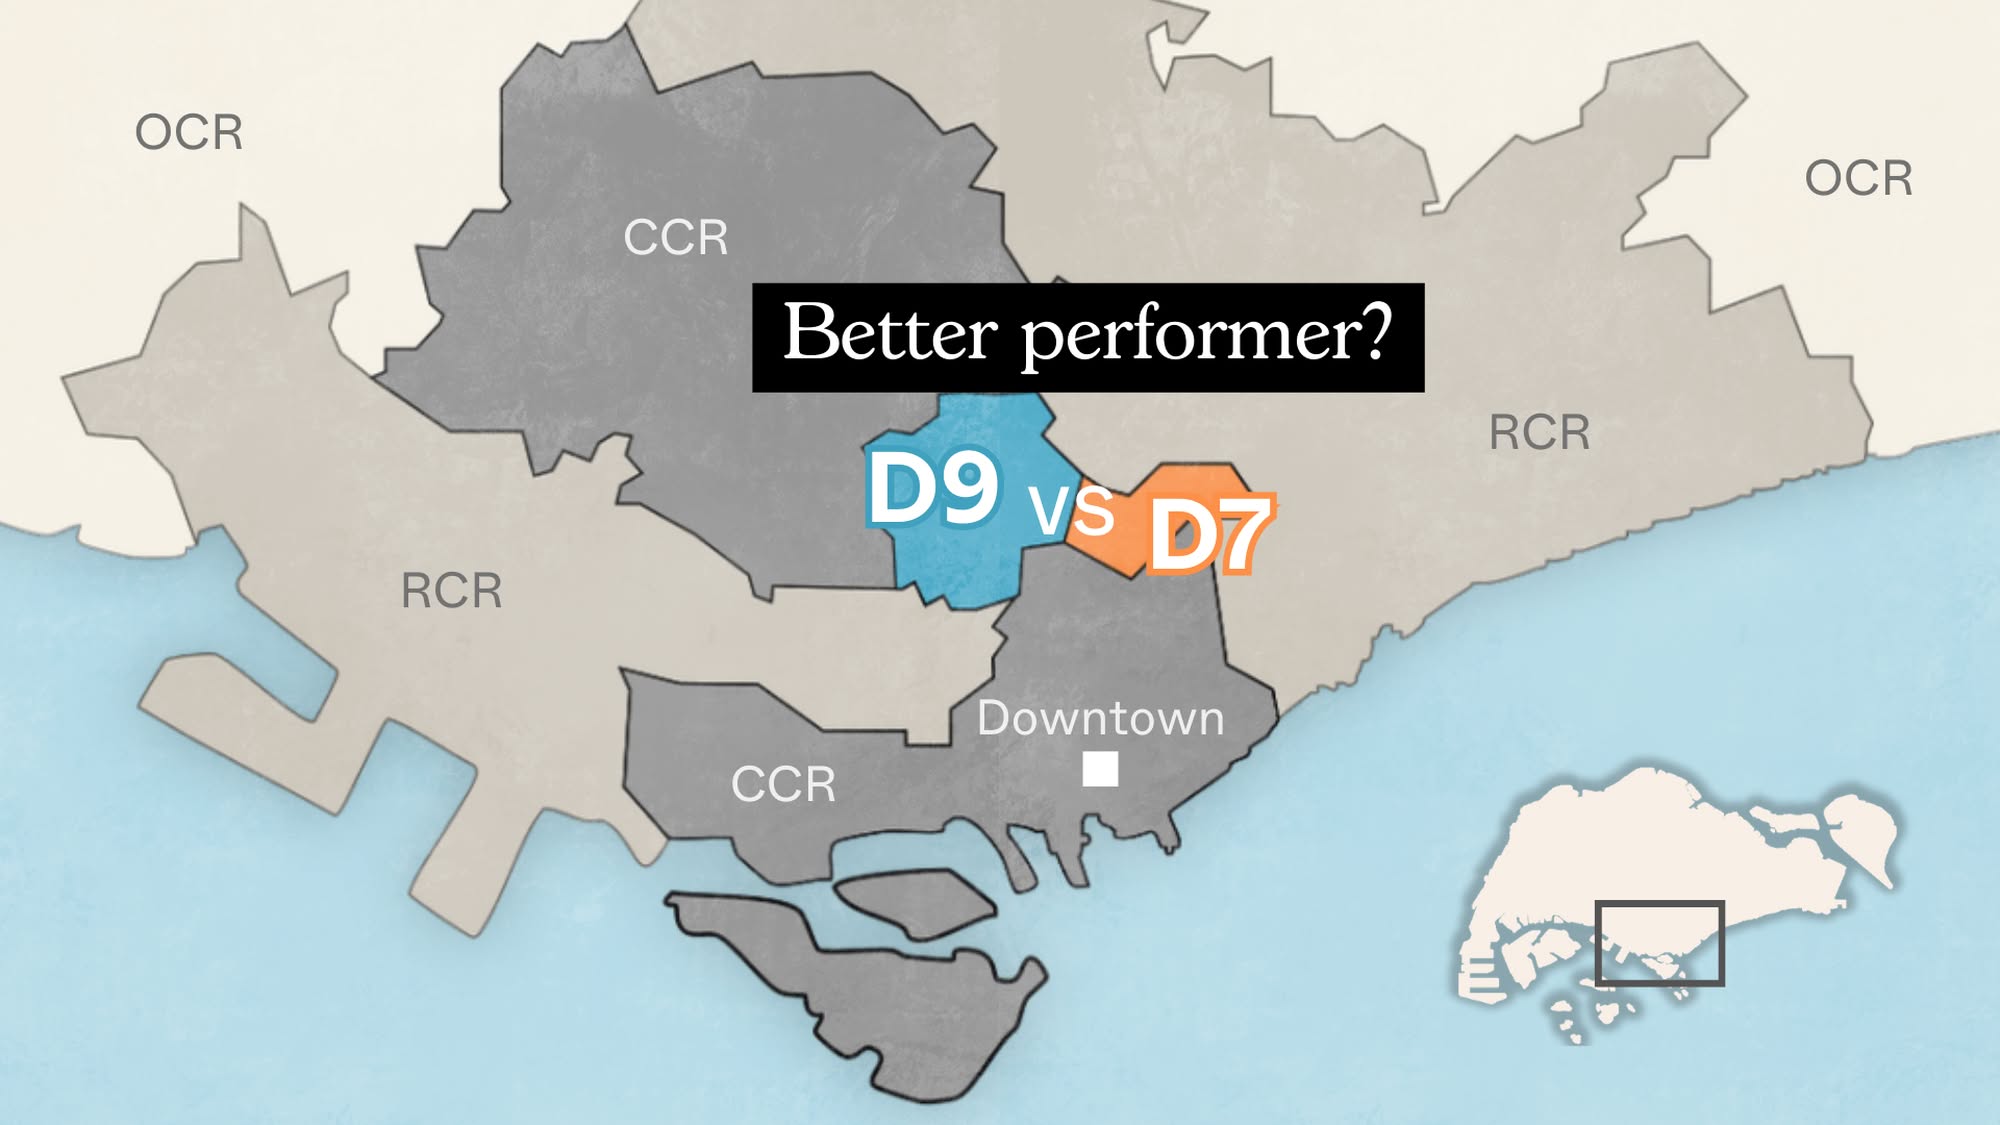
District 9 is about “old school prestige,” and many Singaporeans have grown up with the sense that owning a condo here is a mark of success. On the other hand, District 7 is an up-and-coming contender; no few Singaporeans will tell you they frequent areas like Bugis more than Orchard these days. Given that both these locations are equally matched in convenience and accessibility, which provides better resale value? We took a look at the performance of condos in both districts to come up with an answer:
First, let’s compare the performance of District 7 and District 9 to the broader market
The following focuses only on non-landed residential properties, and includes all types of transactions (new, sub sale, and resale):
Year | D7 | D9 | All districts |
2014 | $1,904 | $2,083 | $1,290 |
2015 | $1,779 | $1,930 | $1,180 |
2016 | $1,527 | $2,177 | $1,232 |
2017 | $1,565 | $2,064 | $1,304 |
2018 | $2,101 | $2,424 | $1,435 |
2019 | $2,633 | $2,359 | $1,560 |
2020 | $2,384 | $2,257 | $1,513 |
2021 | $2,565 | $2,453 | $1,600 |
2022 | $2,454 | $2,491 | $1,712 |
2023 | $2,434 | $2,567 | $1,869 |
2024 | $2,265 | $2,405 | $1,886 |
Annualised | 1.75% | 1.45% | 3.87% |

Over the past decade, both districts have underperformed compared to the overall market, with District 7 (D7) edging out District 9 (D9) by a slim margin.
The broader market’s annualised growth of 3.87 per cent outpaces both; but this is not entirely surprising. D7 and D9 properties carry a premium for their location, so there tends to be less room for price appreciation compared to more affordable districts.
To get a more precise sense of performance, we’ll also compare D7 to the Rest of Central Region (RCR) and D9 to the Core Central Region (CCR), which are their respective regions.
Do note that some parts of D7 fall into the CCR, such as Bugis, are in the CCR, whereas the part of D7 toward Lavender/Kallang is part of the RCR.
Year | D7 | RCR |
2014 | $1,904 | $1,408 |
2015 | $1,779 | $1,383 |
2016 | $1,527 | $1,390 |
2017 | $1,565 | $1,464 |
2018 | $2,101 | $1,594 |
2019 | $2,633 | $1,726 |
2020 | $2,384 | $1,681 |
2021 | $2,565 | $1,808 |
2022 | $2,454 | $1,893 |
2023 | $2,434 | $2,102 |
2024 | $2,265 | $2,159 |
Annualised | 1.75% | 4.37% |

Year | D9 | CCR |
2014 | $2,083 | $1,971 |
2015 | $1,930 | $1,846 |
2016 | $2,177 | $1,968 |
2017 | $2,064 | $1,940 |
2018 | $2,424 | $2,161 |
2019 | $2,359 | $2,294 |
2020 | $2,257 | $2,181 |
2021 | $2,453 | $2,318 |
2022 | $2,491 | $2,451 |
2023 | $2,567 | $2,512 |
2024 | $2,405 | $2,330 |
Annualised | 1.45% | 1.69% |

D7 has lagged its own region (RCR) more noticeably than D9 has in the CCR. D7 managed only 1.75 per cent growth versus 4.37 per cent average for the RCR, which is a significant lag.
District 9 broadly mirrors the CCR’s performance, falling slightly under by a negligible amount (1.45 per cent versus 1.69 per cent).
Let’s now compare the prices and unit sizes in the two districts in recent years.
Figures for 2025 include transactions up to June.
Let’s begin with one-bedder units:
New sale
Year | D7 | D9 | Price difference |
2020 | $1,244,492 | $1,300,329 | -$55,837 |
2021 | $1,348,774 | $1,272,181 | $76,594 |
2022 | $1,578,093 | $1,428,199 | $149,893 |
2023 | $1,630,730 | $1,699,155 | -$68,425 |
2024 | $1,622,938 | $1,329,390 | $293,547 |
2025 | $1,610,000 | $1,406,413 | $203,587 |
Year | D7 | D9 | ||||
Min. size (sqft) | Max. size (sqft) | Average size (sqft) | Min. size (sqft) | Max. size (sqft) | Average size (sqft) | |
2020 | 409 | 624 | 496 | 474 | 560 | 521 |
2021 | 409 | 657 | 459 | 398 | 538 | 475 |
2022 | 409 | 657 | 522 | 398 | 1,055 | 508 |
2023 | 409 | 657 | 467 | 398 | 1,055 | 581 |
2024 | 409 | 527 | 444 | 431 | 549 | 457 |
2025 | 452 | 452 | 452 | 431 | 549 | 460 |
For one-bedroom units, new launches and resales in D7 have often been priced higher than those in D9 in recent years. This was a bit unexpected, as on average, the D9 one-bedders are a bit bigger than those in D7. In 2025 so far, the average quantum of a one-bedder in D7 is about $1.61 million, compared to $1.41 million in D9; a gap of roughly $204,000.
Two-bedroom units
Year | D7 | D9 | Price difference |
2020 | $1,650,129 | $1,743,831 | -$93,702 |
2021 | $1,813,380 | $1,768,746 | $44,634 |
2022 | $2,104,796 | $1,924,101 | $180,696 |
2023 | $2,338,456 | $2,226,894 | $111,562 |
2024 | $2,542,347 | $2,372,190 | $170,157 |
2025 | $2,057,057 | $2,187,264 | -$130,207 |
Year | D7 | D9 | ||||
Min. size (sqft) | Max. size (sqft) | Average size (sqft) | Min. size (sqft) | Max. size (sqft) | Average size (sqft) | |
2020 | 614 | 764 | 687 | 441 | 829 | 683 |
2021 | 592 | 861 | 678 | 441 | 915 | 654 |
2022 | 614 | 1023 | 721 | 592 | 915 | 675 |
2023 | 635 | 1033 | 760 | 560 | 926 | 775 |
2024 | 732 | 980 | 782 | 592 | 893 | 766 |
2025 | 646 | 753 | 706 | 581 | 829 | 696 |

For two-bedroom units, the price trend between D7 and D9 has been more mixed compared to one-bedders. In some years, D7 units command a clear premium, while in others D9 pulls ahead. In 2025 so far, the average two-bedder in D7 costs about $2.06 million, while in D9 it is around $2.19 million; a gap of roughly $130,000.
As an aside, two-bedders in D9 tend to be bigger on average than in D7.
Three-bedroom units
Year | D7 | D9 | Price difference |
2020 | $2,412,832 | $2,764,578 | -$351,746 |
2021 | $2,615,091 | $3,289,636 | -$674,545 |
2022 | $2,667,803 | $3,272,621 | -$604,819 |
2023 | $2,740,104 | $3,848,119 | -$1,108,015 |
2024 | – | $4,677,024 | – |
2025 | $3,334,204 | $2,505,333 | $828,871 |
Year | D7 | D9 | ||||
Min. size (sqft) | Max. size (sqft) | Average size (sqft) | Min. size (sqft) | Max. size (sqft) | Average size (sqft) | |
2020 | 904 | 1,324 | 954 | 915 | 1,572 | 1,107 |
2021 | 904 | 1,066 | 1,026 | 861 | 1,636 | 1,164 |
2022 | 904 | 1,066 | 945 | 753 | 1,572 | 1,137 |
2023 | 904 | 904 | 904 | 764 | 1,615 | 1,260 |
2024 | – | – | – | 764 | 1,496 | 1,372 |
2025 | 1,001 | 1,324 | 1,082 | 753 | 1,023 | 843 |
This category shows a dramatic change. Three-bedroom units in D9 historically commanded a higher quantum; in some years, D9 three-bedders exceeded D7 counterparts by more than $1 million. However, 2025 has flipped the usual pattern: the average three-bedder in D7 is now about $3.33 million, compared to $2.51 million in D9, giving D7 a surprising premium of around $829,000.
Four-bedroom units
Year | D7 | D9 | Price difference |
2020 | $6,683,211 | – | |
2021 | $4,189,044 | $5,829,748 | -$1,640,705 |
2022 | $4,733,217 | $5,486,414 | -$753,197 |
2023 | $4,827,488 | $6,564,022 | -$1,736,534 |
2024 | $5,792,091 | $7,400,000 | -$1,607,909 |
2025 | $5,306,592 | $7,720,000 | -$2,413,408 |
Year | D7 | D9 | ||||
Min. size (sqft) | Max. size (sqft) | Average size (sqft) | Min. size (sqft) | Max. size (sqft) | Average size (sqft) | |
2020 | – | – | – | 1,593 | 2,411 | 2,112 |
2021 | 1,442 | 1,808 | 1,547 | 1,496 | 2,411 | 1,923 |
2022 | 1,442 | 1,808 | 1,669 | 1,496 | 2,411 | 1,840 |
2023 | 1,442 | 3,272 | 1,639 | 1,496 | 2,368 | 1,923 |
2024 | 1,432 | 1,808 | 1,736 | 2,056 | 2,056 | 2,056 |
2025 | 1,442 | 1,798 | 1,665 | 2,228 | 2,411 | 2,350 |
More from Stacked
Why We Bought A 3-Bedder Condo At Penrose: A Buyer’s Case Study
Project Case Study: Penrose

For these larger family homes, D9 has consistently shown a higher quantum than D7. The gap has increased in recent years, from around $750,000 in 2022 to over $2.4 million in 2025. D9 four-bedders have been priced above D7 in every year we can see.
Size seems to be the main reason for this: transacted D9 units in 2025 are all 2,200 sq ft and above, whilst the units in D7 are much smaller; this pushes up the quantum for D9.
Now, let’s look at resale transactions specifically
This will filter out advantages such as developer discounts, and show us how the D7 and D9 projects perform without those distortions.
Resale One-bedroom units
Year | D7 | D9 | Price difference |
2020 | $1,519,174 | $1,327,174 | $192,000 |
2021 | $1,476,162 | $1,343,290 | $132,872 |
2022 | $1,506,223 | $1,342,664 | $163,559 |
2023 | $1,530,954 | $1,247,807 | $283,147 |
2024 | $1,469,866 | $1,330,600 | $139,266 |
2025 | $1,404,000 | $1,375,412 | $28,588 |
Year | D7 | D9 | ||||
Min. size (sqft) | Max. size (sqft) | Average size (sqft) | Min. size (sqft) | Max. size (sqft) | Average size (sqft) | |
2020 | 592 | 1,163 | 890 | 355 | 1,701 | 631 |
2021 | 431 | 1,173 | 815 | 334 | 1,410 | 624 |
2022 | 452 | 1,173 | 810 | 344 | 1,464 | 629 |
2023 | 420 | 1,152 | 795 | 377 | 1,163 | 582 |
2024 | 431 | 1,163 | 736 | 355 | 1,098 | 623 |
2025 | 409 | 1,173 | 675 | 355 | 1,130 | 622 |

For resale one-bedroom units, D7 has seen a higher quantum than D9 over the past six years; but the gap has been narrowing. In 2020, D7 resale one-bedders were on average $192,000 more expensive; by 2025, the gap had shrunk to less than $30,000, so D9 is fast catching up.
In terms of size, resale one-bedders in D7 tend to be significantly larger than those in D9. The difference is often more than 150 sq ft, which also explains the higher quantum.
Resale Two-bedroom units
Year | D7 | D9 | Price difference |
2020 | $1,655,692 | $2,128,657 | -$472,965 |
2021 | $1,507,225 | $2,065,412 | -$558,187 |
2022 | $1,473,021 | $2,081,375 | -$608,354 |
2023 | $1,569,136 | $2,214,465 | -$645,329 |
2024 | $1,602,789 | $2,168,017 | -$565,227 |
2025 | $1,581,208 | $2,286,799 | -$705,591 |
Year | D7 | D9 | ||||
Min. size (sqft) | Max. size (sqft) | Average size (sqft) | Min. size (sqft) | Max. size (sqft) | Average size (sqft) | |
2020 | 678 | 1,378 | 947 | 527 | 2,497 | 1,005 |
2021 | 560 | 1,356 | 905 | 431 | 2,293 | 990 |
2022 | 560 | 1,410 | 880 | 398 | 2,486 | 1,007 |
2023 | 560 | 1,421 | 925 | 527 | 2,293 | 1,017 |
2024 | 560 | 1,442 | 875 | 377 | 2,368 | 955 |
2025 | 678 | 1,152 | 847 | 495 | 1,399 | 955 |

For resale two-bedroom units, D9 has been pricier than D7 across all years. The gap has widened slightly over time, from around $473,000 in 2020 to more than $705,000 in 2025 so far.
Size is likely a contributing factor: D9 resale two-bedders tend to be slightly larger on average, with most years showing a difference of 50 to 100 sq ft.
Resale Three-bedroom units
Year | D7 | D9 | Price difference |
2020 | $2,797,325 | $3,236,689 | -$439,364 |
2021 | $5,611,253 | $3,413,862 | $2,197,391 |
2022 | $2,641,000 | $3,456,952 | -$815,952 |
2023 | $1,949,404 | $3,377,623 | -$1,428,219 |
2024 | $2,108,750 | $3,261,275 | -$1,152,525 |
2025 | $2,602,254 | $3,374,277 | -$772,023 |
Year | D7 | D9 | ||||
Min. size (sqft) | Max. size (sqft) | Average size (sqft) | Min. size (sqft) | Max. size (sqft) | Average size (sqft) | |
2020 | 915 | 2,228 | 1,624 | 936 | 3,229 | 1,562 |
2021 | 904 | 1,130 | 2,331 | 732 | 4,585 | 1,551 |
2022 | 904 | 1,970 | 1,258 | 732 | 3,552 | 1,569 |
2023 | 904 | 1,916 | 1,138 | 667 | 3,660 | 1,527 |
2024 | 904 | 1,550 | 1,214 | 667 | 2,820 | 1,446 |
2025 | 1,044 | 1,615 | 1,395 | 710 | 2,831 | 1,432 |

For resale three-bedroom units, D9 has consistently been priced higher than D7. There’s only one exception: in 2021, when there was an unusually high average in D7. This was due to an outlier: a handful of units from South Beach Residences, with a higher-than-usual quantum, pushed up average prices for the district that year. As an aside, 2021 was in the immediate aftermath of COVID, when some projects saw unusual price surges due to the tight housing supply.
Outside of that anomaly, the price gap has only grown: it ranged from around $439,000 in 2020, but it’s now around $1.4 million in 2023.
Resale Four-bedroom units
Year | D7 | D9 | Price difference |
2020 | $4,917,385 | $5,236,521 | -$319,136 |
2021 | $7,696,992 | $6,327,489 | $1,369,503 |
2022 | $5,200,000 | $6,061,923 | -$861,923 |
2023 | $4,778,600 | $5,961,823 | -$1,183,223 |
2024 | $7,680,000 | $5,616,979 | $2,063,021 |
2025 | $7,000,000 | $5,507,939 | $1,492,061 |
Year | D7 | D9 | ||||
Min. size (sqft) | Max. size (sqft) | Average size (sqft) | Min. size (sqft) | Max. size (sqft) | Average size (sqft) | |
2020 | 2,207 | 2,207 | 2,207 | 1,475 | 6,695 | 2,445 |
2021 | 2,110 | 4,446 | 2,721 | 1,475 | 8,385 | 2,570 |
2022 | 2,142 | 2,142 | 2,142 | 850 | 6,663 | 2,526 |
2023 | 1,604 | 2,142 | 1,959 | 1,152 | 4,844 | 2,516 |
2024 | 2,260 | 2,260 | 2,260 | 1,496 | 4,768 | 2,380 |
2025 | 2,282 | 2,282 | 2,282 | 1,496 | 6,878 | 2,468 |

For resale four-bedroom units, transaction volumes are lower; there are simply fewer people who can afford units at this price point. These are uncommon big-ticket sales, so we need to be careful not to generalise what we see.
That said, D7 has seen pricier transactions in D9 in recent years – most notably in 2024 and 2025. But this is with the caveat that, in both of those years, only one four-bedder transacted in D7, and in each case it was at South Beach Residences. This singular project seems to be raising the average for D7.
Having compared prices, sizes, and resale trends between D7 and D9, the next question is whether owners are actually making money when they sell.
Price growth alone doesn’t guarantee profitability, especially since D7 and D9 condos tend to have a higher initial cost. So now let’s look at the profitability of different unit types in both districts, based on past resale transactions.
Here, we are only looking at transactions completed between January 2024 and June 2025.
1-bedroom units
District | Gains | Losses | ||||||
Average gains | Average ROI | Average holding period (Years) | Tnx volume | Average losses | Average ROI | Average holding period (Years) | Tnx volume | |
7 | $123,403 | 11.89% | 5.6 | 28 | -$96,203 | -5.49% | 7.2 | 5 |
9 | $110,762 | 8.89% | 5.8 | 58 | -$207,298 | -13.45% | 7.4 | 21 |
2-bedroom units
District | Gains | Losses | ||||||
Average gains | Average ROI | Average holding period (Years) | Tnx volume | Average losses | Average ROI | Average holding period (Years) | Tnx volume | |
7 | $246,378 | 18.18% | 6.5 | 39 | -$34,500 | -3.21% | 3.1 | 2 |
9 | $317,538 | 16.66% | 5.6 | 133 | -$235,832 | -9.02% | 7.2 | 27 |
3-bedroom units
District | Gains | Losses | ||||||
Average gains | Average ROI | Average holding period (Years) | Tnx volume | Average losses | Average ROI | Average holding period (Years) | Tnx volume | |
7 | $304,242 | 17.85% | 4.5 | 10 | -$309,520 | -8.12% | 7.4 | 1 |
9 | $532,063 | 22.30% | 6.1 | 130 | -$408,415 | -9.41% | 6.9 | 17 |
4-bedroom units
District | Gains | Losses | ||||||
Average gains | Average ROI | Average holding period (Years) | Tnx volume | Average losses | Average ROI | Average holding period (Years) | Tnx volume | |
7 | – | – | – | – | -$496,000 | -6.30% | 5.3 | 2 |
9 | $1,117,103 | 23.22% | 6.1 | 38 | -$50,000 | -1.39% | 3.2 | 1 |
Over the past year or so (January 2024 to June 2025), D7 generally performed better for smaller units. With the one- and two-bedders, D7 had a higher average ROI for profitable units and lower average losses than D9. D9 did see higher transaction volumes though, due to a recent pivot of interest toward the CCR.
In the three-bedder category, profitable units in D9 had a higher average ROI; but note that when losses did happen, the average amount of the loss was higher. This is due to higher entry prices magnifying gains as well as losses.
(E.g., D9 three-bedders often cost $3 million or more. A 10 per cent loss on a $3.5 million unit is a $350,000 loss, whereas the same percentage drop on a $2 million D7 unit would “only” be $200,000.)
For four-bedroom units, D9 dominated with over $1.1 million in average gains, while D7 saw only two transactions in the past 18 months, and both were unprofitable. Overall, D9’s strengths remain in the larger unit types, where its prestige and bigger floor areas drive higher profits, while D7’s advantage lies in the smaller units, where it has delivered stronger returns and fewer losses.
The losses aren’t particularly shocking for these districts – due to the extremely high quantum, there’s less room for appreciation, and a limited pool of possible buyers. Another contributing factor is that newer competing condos sometimes offer similar or even better luxury features, compared to some of the older D7 and D9 condos, which were bought at a premium in their day.
Finally, let’s take a look at the rental yields of the various projects
For many buyers, especially investors, this can be just as important as capital gains. But also, good rental yields can be a motivation for future buyers too. We will look at rental data from June 2024 to June 2025.
1-bedroom units
D7 | D9 | |
Average resale price in 2025 | $1,404,000 | $1,375,412 |
Average rent | $4,446 | $4,055 |
Rental yield | 3.80% | 3.54% |
2-bedroom units
D7 | D9 | |
Average resale price in 2025 | $1,581,208 | $2,286,799 |
Average rent | $5,328 | $5,547 |
Rental yield | 4.04% | 2.91% |
3-bedroom units
D7 | D9 | |
Average resale price in 2025 | $2,602,254 | $3,374,277 |
Average rent | $7,598 | $7,990 |
Rental yield | 3.50% | 2.84% |
4-bedroom units
D7 | D9 | |
Average resale price in 2025 | $7,000,000 | $5,507,939 |
Average rent | $15,567 | $11,672 |
Rental yield | 2.67% | 2.54% |
D7 generally wins out in rental yield, but the gap between the two (2.67 per cent versus 2.54 per cent) is not particularly significant.
To get more specific though, two- and three-bedders in D7 are the clear winners. The rental rates are close to those in D9, but the significantly lower quantum pushes D7 ahead: 4.04 per cent versus 2.91 per cent for two-bedders, and 3.50 per cent versus 2.84 per cent for three-bedders.
Conclusion:
Based on the numbers to date, D7 holds the advantage. It has shown stronger $PSF growth in the new sale segment, and delivers higher average ROI for one- and two-bedders; it also offers better rental yields across all unit types.
D7 also benefits from being anchored by the Ophir-Rochor Corridor, in its CCR-area component. This corridor will link the CBD to Bugis and Kampong Glam, and current signs are recent mixed-use projects like Midtown Bay and Midtown Modern; there’s much to come in future.
That said, D9 still retains its prestige for now: it also boasts larger average unit sizes, particularly for three- and four-bedders, which is where its average ROI tends to fare best. That said, there may be a significant size disparity between older and newer condos in D9 going forward. We have seen this with River Green recently; a D9 condo where the units are more compact, to keep the overall quantum palatable.
In short, D7 is shaping up as the better play for investors right now, while D9 looks like more of a homeowners’ choice. This is also complemented by URA’s attempts to “balance out” areas like Orchard, making D9 a more holistic live-work-play area. In future, D9 will amount to much more than just designer malls and shopping, and will include event spaces and more family-oriented amenities.
The challenge with choosing between CCR districts like D9 and D7 isn’t simply about prestige versus price; it’s about understanding which location offers the best risk-adjusted returns for your unit type and holding period.
Too many investors still default to D9 without comparing how D7’s new-sale $PSF growth, higher rental yields, and one-to-two-bedder ROI stack up. With the Ophir-Rochor Corridor reshaping the area, these fundamentals will be shifting more in the future.
At Stacked, we’ve applied this same comparative framework to help investors identify CCR opportunities that outperform even in a premium segment.
Curious how these numbers play out for your budget and preferred unit size? Let’s chat — the right district for you might not be the one you’ve been eyeing.
For more deep dives into various districts, coming in the next few weeks, follow us on Stacked Pro. If you’d like to get in touch for a more in-depth consultation, you can do so here.
Ryan J
A seasoned content strategist with over 17 years in the real estate and financial journalism sectors, Ryan has built a reputation for transforming complex industry jargon into accessible knowledge. With a track record of writing and editing for leading financial platforms and publications, Ryan's expertise has been recognised across various media outlets. His role as a former content editor for 99.co and a co-host for CNA 938's Open House programme underscores his commitment to providing valuable insights into the property market.Read next from Property Investment Insights

New Launch Condo Analysis Springleaf Residence Pricing Review: How It Compares To Nearby Resale And New Launches

Property Investment Insights New Launch vs Resale Condos in District 9: Which Bedroom Types Offer Better Value Today?

New Launch Condo Analysis Canberra Crescent Residences Pricing Breakdown: A Price Comparison With Nearby Condos

New Launch Condo Analysis A New River Valley Condo From Just $1.2M? Here’s What You Need To Know About River Green’s Pricing
Latest Posts

Overseas Property Investing 4 Hidden Risks To Avoid When Buying Property In Malaysia (A Guide For Singaporeans)

Homeowner Stories I Bought a Freehold Property in Singapore and Regret It — Here’s the Big Mistake I Made

Landed Home Tours We Toured A Rare Part Of Singapore Where Terrace Houses Are Bigger Than The Semi-Detached Units

Singapore Property News What Buyers Overlook When Purchasing Older Condos (Until It’s Too Late)

Property Market Commentary 5 Ways Housing Shapes Singapore’s National Identity

On The Market 5 Attractive Freehold Condos With Private Pools (Under $2M)

New Launch Condo Reviews Springleaf Residence Review: A 941 Mega-Development Near The MRT From $1,995 Psf

Property Market Commentary 4 Condo Layouts And Features Buyers Are Moving Away From in 2025

Editor's Pick Summer Suites Condo Review: A Freehold Johor Bahru Condo Near The RTS Link

Editor's Pick Over 900 Units Sold in One Weekend: The Surprising Lessons From River Green, Promenade Peak & Canberra Crescent

Singapore Property News Is Property Decoupling To Avoid ABSD Now Illegal?

Editor's Pick I Visited Freehold Terraces, Semi-Ds, and Detached Homes in the East Ranging from $2.5 Million to $11 Million

Singapore Property News How Condo Buying In Singapore Became A Game Of Luck

Editor's Pick Springleaf Residence Launches From $878K — Is This 941-Unit Mega Development Worth It?

On The Market 5 Spacious 3-Bedroom Condos That Cost Less Than You’d Expect (Under $2M)
