New Launch vs Resale Condos in District 7: Which Bedroom Types Offer Better Value Today?

Get The Property Insights Serious Buyers Read First: Join 50,000+ readers who rely on our weekly breakdowns of Singapore’s property market.

A seasoned content strategist with over 17 years in the real estate and financial journalism sectors, Ryan has built a reputation for transforming complex industry jargon into accessible knowledge. With a track record of writing and editing for leading financial platforms and publications, Ryan's expertise has been recognised across various media outlets. His role as a former content editor for 99.co and a co-host for CNA 938's Open House programme underscores his commitment to providing valuable insights into the property market.
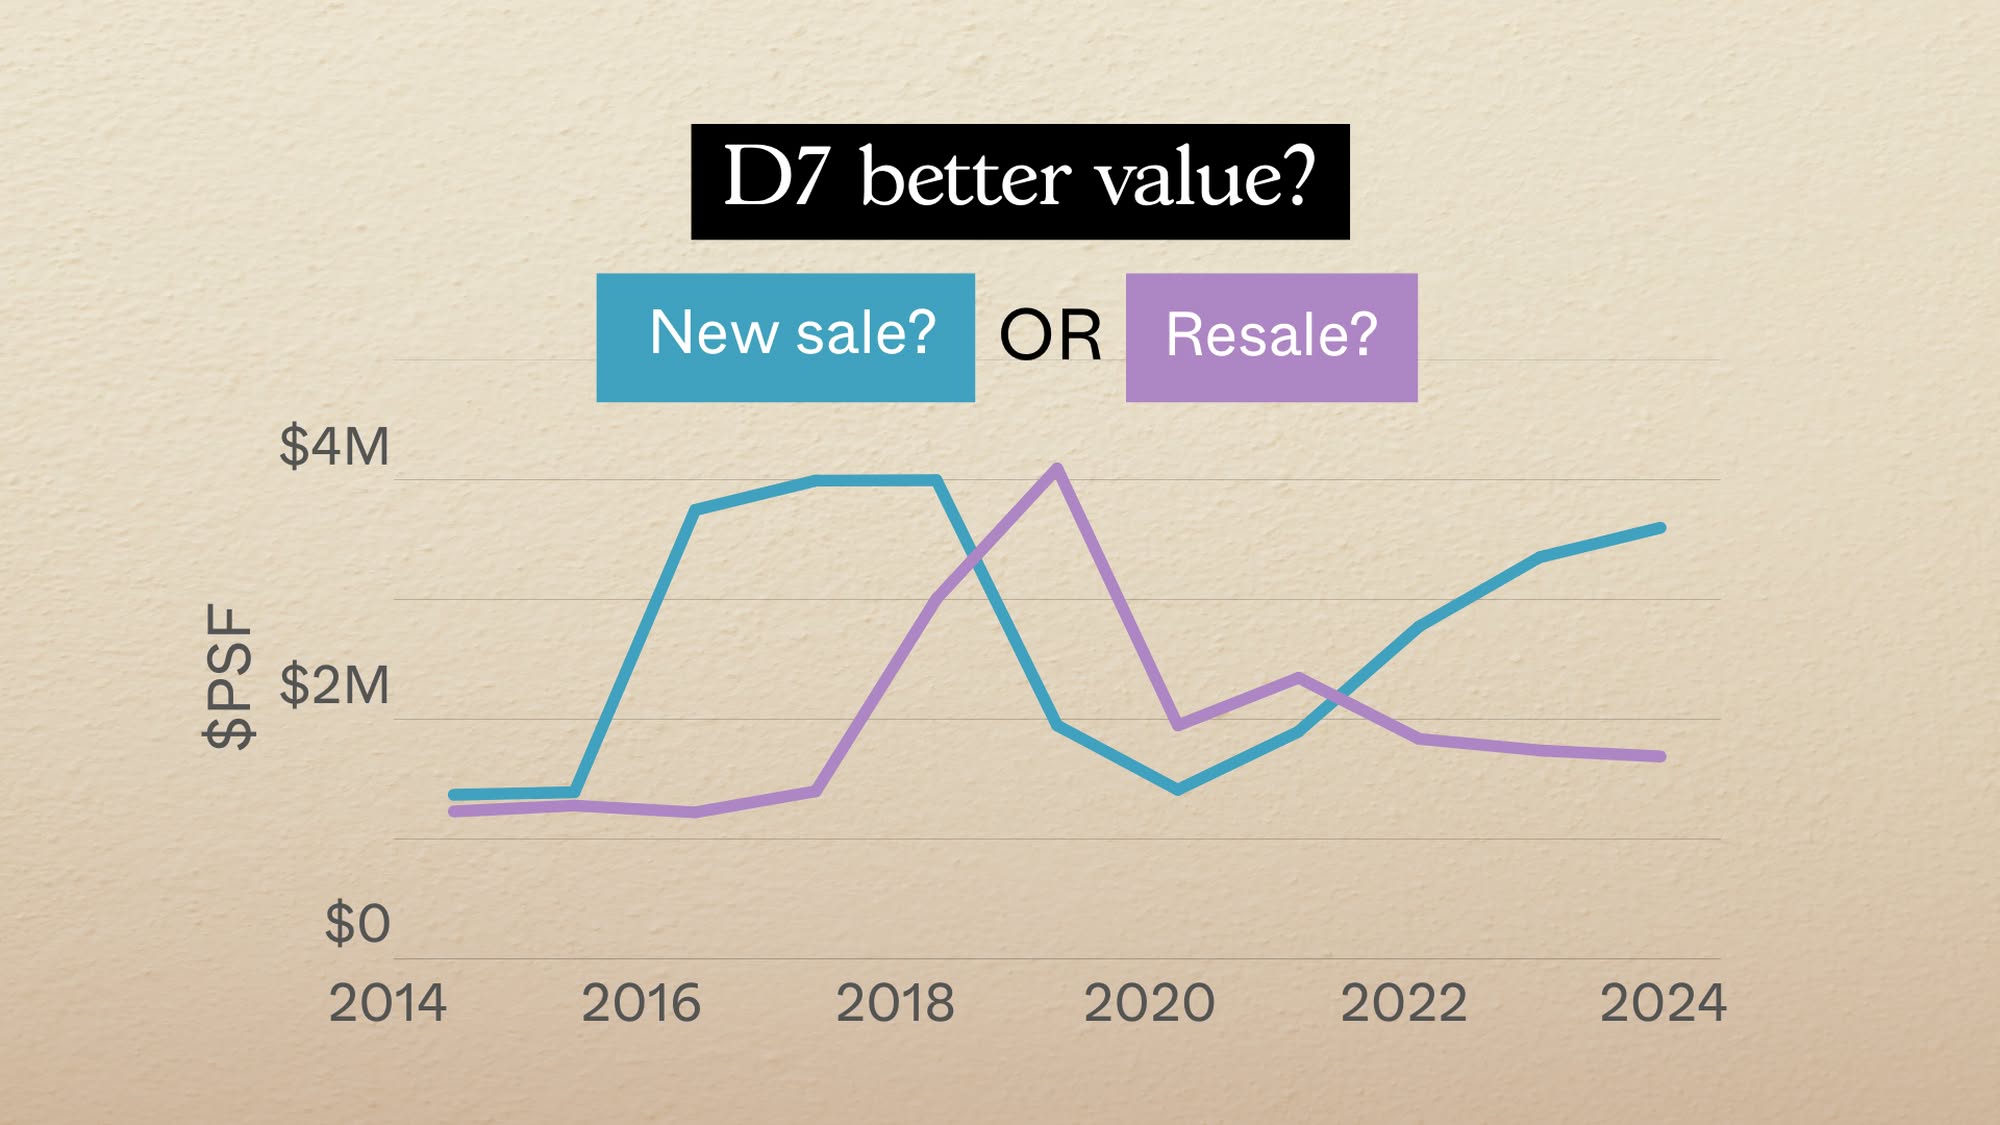
District 7 is one of the few areas where the official zoning and market reality don’t quite align. Although URA classifies it as part of the Rest of Central Region (RCR), parts of it are in the Core Central Region (CCR). As such, the transaction data tells a different story: several new launches in Bugis and Rochor have crossed $3,000 psf, a level more commonly associated with District 9. In fact, some projects here have transacted at premiums above nearby CCR counterparts.
This raises a practical question for investors: if D7 is already pricing like a CCR district, is there still a case to buy in, and should you be looking at new launches or resale projects for better value?
A look at the overall price movements of D7 condos
All sale types (new, resale, sub sale)
Year | D7 average $PSF | All non-landed private properties’ average $PSF |
2014 | $1,904 | $1,290 |
2015 | $1,779 | $1,180 |
2016 | $1,527 | $1,232 |
2017 | $1,565 | $1,304 |
2018 | $2,101 | $1,435 |
2019 | $2,633 | $1,560 |
2020 | $2,384 | $1,513 |
2021 | $2,565 | $1,600 |
2022 | $2,454 | $1,712 |
2023 | $2,434 | $1,869 |
2024 | $2,265 | $1,886 |
Annualised | 1.75% | 3.87% |

From 2014 to 2024, average D7 condo prices rose from about $1,900 psf to $2,265 psf. In absolute terms, D7 has always been ahead of the islandwide average, and the higher absolute prices explain why percentage gains are slower. D7 saw annualised growth of just 1.75 per cent compared to almost 3.9 per cent islandwide.
Now, let’s take a closer look based on transaction types
This will provide a clearer view of the performance, without distortions caused by developer pricing/discounts:
Year | New sale average $PSF | Resale and sub sale average $PSF | All new sale average $PSF | All resale and sub sale average $PSF |
2014 | $1,950 | $1,331 | $1,334 | $1,215 |
2015 | $1,864 | $1,299 | $1,170 | $1,197 |
2016 | $2,043 | $1,296 | $1,221 | $1,248 |
2017 | $2,156 | $1,454 | $1,315 | $1,293 |
2018 | $2,199 | $2,084 | $1,582 | $1,323 |
2019 | $2,829 | $2,558 | $1,758 | $1,346 |
2020 | $2,480 | $1,697 | $1,744 | $1,280 |
2021 | $2,761 | $1,763 | $1,924 | $1,354 |
2022 | $2,891 | $1,813 | $2,145 | $1,473 |
2023 | $3,074 | $1,805 | $2,401 | $1,595 |
2024 | $3,423 | $2,020 | $2,322 | $1,681 |
Annualised | 5.79% | 4.26% | 5.69% | 3.30% |

From 2014 to 2024, overall D7 prices grew 1.75 per cent annually. However, new launches in the district have surged at almost six per cent annually, while resale and sub sale units have managed more than four per cent. Both are ahead of their islandwide counterparts, where new sales averaged around 5.7 per cent and resale only 3.3 per cent.
The reason the headline number appears so muted is due to the transaction mix. When a greater share of sales comes from resale units, which are lower in absolute $PSF, the overall average gets pulled down. If you set this aside, both new and resale projects in D7 have actually performed well over the past decade.
What stands out most is the resale segment though. While new launches are expected to show stronger growth (because of developers’ early-bird discounts), resale units in D7 have outperformed the islandwide average. This hints that even older projects in the district have managed to outperform resale projects elsewhere.
Let’s take a look at actual transacted prices
Year | New sale average price | Resale and sub sale average price |
2014 | $1,368,958 | $1,229,833 |
2015 | $1,391,051 | $1,279,199 |
2016 | $3,746,523 | $1,223,021 |
2017 | $3,992,636 | $1,398,543 |
2018 | $3,995,658 | $3,005,386 |
2019 | $1,948,840 | $4,094,235 |
2020 | $1,411,426 | $1,949,131 |
2021 | $1,897,221 | $2,345,833 |
2022* | $2,774,926 | $1,835,971 |
2023* | $3,353,161 | $1,739,584 |
2024* | $3,598,982 | $1,688,873 |
% increase from 2014 to 2024 | 162.90% | 37.33% |

From 2014 to 2024, the average new launch price in D7 rose by about 163 per cent, while resale and sub sale units climbed by a more modest 37 per cent. At first glance, this looks like new launches have outperformed by a huge margin; but a closer look shows much of the difference comes down to unit sizes.
In 2024, around a third of the new sale transactions were for four-bedroom units. These very large units had a high quantum, between $5 million and $6.5 million, which pushed up the overall average price.
We can’t take this as being reflective of the wider D7 market though, as it was smaller units that made up more of the volume. As such, the true market experience for buyers is probably a lower average, despite the on-paper $PSF growth.
This shows why quantum numbers can also be misleading when taken at face value. New launches in D7 tend to skew toward larger-format, high-profile units in integrated projects, while resale activity is more dispersed.
Here’s a look at the transaction activity by unit size:


In D7, new sale transactions have been heavily weighted toward four-bedroom units. By contrast, resale and sub-sale activity is concentrated in one- and two-bedders. As a result, new sale price averages can appear inflated by large-unit sales, while resale averages reflect the smaller, more affordable segment of the market.
To get a clearer sense of performance, we need to break down the data by unit type.
One-bedroom units
Year | New sale average price | Resale and sub sale average price | Price difference |
2014 | $1,110,323 | $1,091,667 | $18,656 |
2015 | $945,727 | $1,083,333 | -$137,606 |
2016 | $1,080,000 | $1,278,333 | -$198,333 |
2017 | $1,408,000 | $1,288,417 | $119,583 |
2018 | $1,545,469 | ||
2019 | $1,416,582 | $1,569,209 | -$152,627 |
2020 | $1,244,492 | $1,519,174 | -$274,682 |
2021 | $1,348,774 | $1,476,162 | -$127,388 |
2022 | $1,578,093 | $1,498,774 | $79,318 |
2023 | $1,630,730 | $1,525,442 | $105,288 |
2024 | $1,622,938 | $1,466,246 | $156,692 |
% increase from 2014 to 2024 | 46.17% | 34.31% |

For one-bedders, resale units in the past sometimes managed higher average prices than new launches. This was most apparent between 2015 and 2021, when resale one-bedders were sometimes more expensive by over $100,000.
According to realtors we spoke to, many of the resale one-bedders during that period came from headline integrated projects such as DUO Residences and Midtown Bay. These were premium offerings, whereas new launches entering D7 at that time (2015 to 2021) tended to be smaller boutique projects – these often had more compact layouts and hence lower overall prices. As a result, resale one-bedders from older resale projects could command higher average prices, despite being older.
But this ended in 2022, after which new launches consistently overtook resale. The gap continued to widen as by 2024, new one-bedders averaged about $1.62 million compared to $1.47 million for resale, a difference of around $157,000.
Percentage wise, new one-bedders rose by about 46 per cent, while resale one-bedders climbed by a more modest 34 per cent.
Two-bedroom units
Year | New sale average price | Resale and sub sale average price | Price difference |
2014 | $1,267,108 | $1,259,286 | $7,822 |
2015 | $1,312,875 | $1,072,915 | $239,960 |
2016 | $1,478,000 | $1,205,741 | $272,259 |
2017 | $1,800,000 | $1,350,750 | $449,250 |
2018 | $2,536,671 | ||
2019 | $2,246,007* | $2,955,581 | -$709,574 |
2020 | $1,650,129 | $1,655,692 | -$5,563 |
2021 | $1,813,380 | $1,507,225 | $306,155 |
2022 | $2,104,796** | $1,473,021 | $631,775 |
2023 | $2,338,456** | $1,584,403 | $754,053 |
2024 | $2,542,347** | $1,649,288 | $893,058 |
% increase from 2014 to 2024 | 100.64% | 30.97% |
**Midtown Bay was again responsible for pushing up the average due to its higher quantum, and the new price average here reflects five units sold at Midtown Bay; in addition, the unit at The M is not strictly a two-bedder, but a 2+Study

For two-bedders, new launches have usually commanded a higher price than resale counterparts, and the gap has only widened over time. Since 2021, the difference has grown from just over $300,000 to almost $900,000(!) by 2024. This is largely due to Midtown Bay, however, which pushed up the average for new launches with its high quantum.
Between 2014 and 2024, new launch two-bedders doubled in average price, rising by about 101 per cent. Resale two-bedders, on the other hand, grew by only 31 per cent over the same period.
As in many districts, two-bedders are a popular format for new launches, especially recently (in this article, we explain why some families are picking new launch two-bedders, even over larger resale options sometimes).
Developers have priced two-bedder layouts aggressively, with some layouts like 2+Study units in the “sweet spot” between affordability and liveability. By contrast, the resale stock is older and often larger in floor area, which drives the quantum too high for upgraders. This keeps the resale units’ quantum growth lower, despite $PSF appreciation.
Three-bedroom units
Year | New sale average price | Resale and sub sale average price | Price difference |
2014 | $2,519,679 | $1,334,000 | $1,185,679 |
2015 | $1,687,967 | $1,748,471 | -$60,504 |
2016 | $2,637,063 | $1,216,667 | $1,420,396 |
2017 | $3,430,994 | $1,654,636 | $1,776,358 |
2018 | $3,852,620 | $2,714,495 | $1,138,125 |
2019 | $3,099,467 | $5,478,370 | -$2,378,904 |
2020 | $2,412,832 | $2,797,325 | -$384,493 |
2021 | $2,615,091 | $5,611,253 | -$2,996,162 |
2022 | $2,667,803 | $2,641,000 | $26,803 |
2023 | $2,740,104 | $1,949,404 | $790,700 |
2024 | $2,304,545 | ||
% increase from 2014 to 2023 (new sales)/ 2024 (resale and sub sale) | 8.75% | 72.75% |

For three-bedders, the price trend has been less straightforward. There were several years where resale units transacted at higher average prices than new launches, most notably in 2019 and 2021 – as we mentioned regarding one-bedders, this was largely due to landmark projects again, which also had bigger units.
From 2022 onward, new launches began pulling ahead of resale in pricing. Unfortunately, though, no new three-bedders were sold at all in 2024 – so the average will be distorted if we include that year.
Let’s say we measure from just 2014 to 2023 though: In this instance, resale three-bedders saw a bigger jump. Average resale prices rose by nearly 73 per cent, while new launches only increased by about nine per cent. So this does give better performance to resale rather than new sale three-bedders.
Let’s now take a look at the average unit sizes
We’ll begin with one-bedroom units:
Year | New sale average size | Resale and sub sale average size | Size difference |
2014 | 516 | 696 | -180 |
2015 | 439 | 759 | -321 |
2016 | 420 | 754 | -334 |
2017 | 689 | 763 | -74 |
2018 | 823 | ||
2019 | 459 | 794 | -334 |
2020 | 496 | 890 | -394 |
2021 | 459 | 815 | -356 |
2022 | 522 | 796 | -274 |
2023 | 467 | 767 | -301 |
2024 | 444 | 724 | -280 |
The size difference between new and resale one-bedders in D7 is striking. From 2014 to 2024, new launches averaged between 420 and 520 sq ft, while resale one-bedders were consistently much larger, often in the 750 to 890 square foot range. In some years, the gap exceeded 300 sq ft.
This is consistent with the explanation we were given above: some of the older resale projects simply had larger one-bedders, in contrast to newer boutique projects popping up. But new launches are now clearly leading, as the smaller unit sizes (i.e., lower overall price) and improved layouts have restored their lead.
Two-bedroom average sizes
Year | New sale average size | Resale and sub sale average size | Size difference |
2014 | 699 | 947 | -249 |
2015 | 710 | 884 | -174 |
2016 | 807 | 933 | -126 |
2017* | 1,023 | 993 | 30 |
2018 | 1,126 | ||
2019 | 804 | 1,155 | -351 |
2020 | 687 | 947 | -260 |
2021 | 678 | 905 | -227 |
2022 | 721 | 880 | -160 |
2023 | 760 | 914 | -154 |
2024 | 782 | 860 | -78 |
*Only a single new two-bedder transaction happened in 2017, and it was from DUO Residences. This was also unusually large for a two-bedder at 1,023 sq ft. This pulled up the average size for that year, but it has to be read as an outlier.
The size gap between new and resale two-bedders in D7 has also been consistent, with new launches typically smaller by 150 to 250 sq ft. Older resale units tended to be close to or above 900 sq ft, while new launches often fell in the 680 to 780 square foot range.
The shrinking size of new two-bedders helps explain why they command higher $PSF and have seen stronger price growth. As we mentioned above, developers have leaned into compact layouts to keep overall quantum attractive; and this also provides more room for percentage gains.
Three-bedroom average sizes
Year | New sale average size | Resale and sub sale average size | Size difference |
2014 | 1,225 | 1,620 | -395 |
2015 | 927 | 1,432 | -505 |
2016 | 1,413 | 1,229 | 184 |
2017 | 1,480 | 1,348 | 132 |
2018 | 1,606 | 1,382 | 224 |
2019 | 1,256 | 1,822 | -567 |
2020 | 954 | 1,624 | -670 |
2021 | 1,026 | 2,331 | -1,305 |
2022 | 945 | 1,258 | -314 |
2023 | 904 | 1,138 | -234 |
2024 | 1,159 |
This is where we find the largest size differences. Resale three-bedders have often been 300 to more than 1,000 sq ft larger, with some years seeing dramatic differences. In 2021, for example, resale three-bedders averaged over 2,300 sq ft(!) compared to just around 1,000 sq ft for new sales.
From 2016 to 2018, DUO Residences accounted for the bulk of new three-bedder transactions. These ranged from about 1,430 to 1,720 sq ft, which would be considered four-bedders today; and they pulled up the new launch average size.
But setting aside the disruption from DUO, newer three-bedders in D7 have kept to around 900 to 1,000 sq ft, which is the norm today.
In general, we can see that new launches continue to get smaller even as prices rise, while resale units retain an edge in spaciousness (but may have impractically high overall prices).
Given this, the most useful category to examine in detail is the two-bedder.
As mentioned, this size is the sweet spot for both investors and homeowners, balancing affordability and liveability.
We saw that from 2021 onwards, the price gap between a new and a resale two-bedder widened significantly. To understand how this roughly $900,000 gap developed, it helps to look at the actual transactions from 2021 to 2024.
These years capture the impact of Midtown Bay and Midtown Modern entering the market, alongside resale activity in older projects like DUO Residences and South Beach Residences. The contrast in unit mix, size, and buyer profile during this period explains much of the divergence.
New launches sold in 2021
Project | Completion year | Average price | Average $PSF | Average size | No. of units sold |
MIDTOWN MODERN | 2025 | $1,772,452 | $2,686 | 661 | 137 |
THE M | 2023 | $1,889,478 | $2,614 | 725 | 38 |
MIDTOWN BAY | 2024 | $2,152,808 | $2,878 | 741 | 8 |
Resale/ sub sale sold in 2021
Project | Completion year | Average price | Average $PSF | Average size | No. of units sold | Difference in average price compared to Midtown Modern (has lowest average price) |
TEXTILE CENTRE | 1977 | $915,188 | $998 | 917 | 9 | $857,264 |
THE PLAZA | 1979 | $956,667 | $1,189 | 804 | 3 | $815,785 |
SUNSHINE PLAZA | 2001 | $1,106,667 | $1,392 | 796 | 3 | $665,785 |
BURLINGTON SQUARE | 1998 | $1,192,500 | $1,276 | 942 | 6 | $579,952 |
THE BENCOOLEN | 1999 | $1,226,000 | $1,320 | 930 | 3 | $546,452 |
CITY GATE | 2018 | $1,326,365 | $1,913 | 694 | 11 | $446,086 |
SOUTHBANK | 2010 | $1,560,300 | $1,645 | 949 | 10 | $212,152 |
DUO RESIDENCES | 2017 | $2,041,616 | $2,141 | 956 | 11 | -$269,164 |
CONCOURSE SKYLINE | 2014 | $2,385,000 | $1,759 | 1356 | 2 | -$612,548 |
SOUTH BEACH RESIDENCES | 2016 | $3,876,500 | $3,187 | 1216 | 2 | -$2,104,048 |
More from Stacked
Similar Layout, Same District—But Over $500K Cheaper? We Compare New Launch Vs Resale Condos In District 5
In this Stacked Pro breakdown:
In 2021, most of the new sales came from Midtown Modern, which sold 137 units at an average of about $1.77 million; at the same time, The M and Midtown Bay saw prices range from $1.77 million to $2.15 million, respectively. The $PSF levels were between $2,600 and $2,800.
On the resale side, the story was very different. Buyers could find options in older projects like Textile Centre and The Plaza, where two-bedders averaged under $1 million, or mid-2000s stock like Burlington Square and The Bencoolen in the $1.1 to $1.2 million range. Even newer projects, such as City Gate (TOP 2018) and Southbank (TOP 2010), were still cheaper than Midtown Modern.
On paper, the overall average difference between new and resale two-bedders in 2021 was only about $306,000. But when we break it down by project, the gap is often much larger.
A buyer with the budget for a Midtown Modern unit could have comfortably purchased most of the resale alternatives, with the exception of DUO Residences, Concourse Skyline, and South Beach Residences (and only because these three were headline integrated projects).
If we take Midtown Modern and compare it directly to City Gate – the newest completed project in D7 at the time – the price gap was almost $450,000. This shows how smartly developers were pricing D7’s new launches, relative to even recent resale units.
New launches sold in 2022
Project | Completion year | Average price | Average $PSF | Average size | No. of units sold |
THE M | 2023 | $1,941,938 | $2,772 | 701 | 16 |
MIDTOWN MODERN | 2025 | $2,035,500 | $3,205 | 635 | 2 |
MIDTOWN BAY | 2024 | $2,379,230 | $3,065 | 770 | 10 |
Resale/ sub sale sold in 2022
Project | Completion year | Average price | Average $PSF | Average size | No. of units sold | Difference in average price compared to The M (has lowest average price) |
TEXTILE CENTRE | 1977 | $947,667 | $1,065 | 890 | 6 | $994,271 |
THE PLAZA | 1979 | $1,018,750 | $1,270 | 802 | 4 | $923,188 |
THE BENCOOLEN | 1999 | $1,250,000 | $1,416 | 883 | 2 | $691,938 |
SUNSHINE PLAZA | 2001 | $1,284,444 | $1,450 | 888 | 2 | $657,494 |
TANQUEELAN SUITES | 2005 | $1,350,000 | $1,792 | 753 | 1 | $591,938 |
CITY GATE | 2018 | $1,376,000 | $2,028 | 678 | 10 | $565,938 |
BURLINGTON SQUARE | 1998 | $1,380,000 | $1,198 | 1152 | 1 | $561,938 |
SOUTHBANK | 2010 | $1,701,000 | $1,803 | 944 | 3 | $240,938 |
DUO RESIDENCES | 2017 | $2,021,778 | $2,074 | 980 | 5 | -$79,840 |
CONCOURSE SKYLINE | 2014 | $2,656,667 | $1,959 | 1356 | 3 | -$714,729 |
Moving ahead to 2022, the price gap between new and resale two-bedders had widened further.
New launches transacted at between $1.94 million and $2.38 million, with $PSF levels now pushing past $3,000 in Midtown Modern and Midtown Bay. You can see, by the way, why D7 is considered “effectively CCR” by some market watchers here – the average $PSF for new sales is arguably on par with CCR stock, even if D7 is technically in the RCR.
Resale transactions have also gone up, but at a much lower pace. Older projects like Textile Centre and The Plaza still average just under or slightly above $1 million, while mid-2000s projects such as The Bencoolen and Sunshine Plaza are in the mid-$1.2 million range. Even newer projects like City Gate and Southbank remain at around $1.38 to $1.7 million.
Once again, actual project-to-project comparisons show a bigger divergence than overall average prices. For example, buyers choosing The M, the lowest-priced new launch at $1.94 million, would have been comparing it to resale alternatives at least $500,000 to $1 million cheaper. Only DUO Residences and Concourse Skyline were priced close to or above the new sale range.
So while resale $PSF did rise in 2022, the rate of increase couldn’t keep pace with the new launches. Developers priced aggressively, pushed new two-bedders well beyond their resale peers, and created a price gap that has only grown over the years.
Let’s take a look at the percentage increases for some specific new launch and resale projects
% increase for new launches
Project | Average $PSF in 2021 | Average $PSF in 2022 | % increase |
THE M | $2,614 | $2,772 | 6.06% |
MIDTOWN MODERN | $2,686 | $3,205 | 19.30% |
MIDTOWN BAY | $2,878 | $3,065 | 6.52% |
% increase for resale projects
Project | Average $PSF in 2021 | Average $PSF in 2022 | % increase |
TEXTILE CENTRE | $998 | $1,065 | 6.67% |
THE PLAZA | $1,189 | $1,270 | 6.84% |
BURLINGTON SQUARE | $1,276 | $1,198 | -6.11% |
THE BENCOOLEN | $1,320 | $1,416 | 7.30% |
SUNSHINE PLAZA | $1,392 | $1,450 | 4.16% |
SOUTHBANK | $1,645 | $1,803 | 9.61% |
CONCOURSE SKYLINE | $1,759 | $1,959 | 11.40% |
CITY GATE | $1,913 | $2,028 | 5.99% |
DUO RESIDENCES | $2,141 | $2,074 | -3.15% |
From 2021 to 2022, The M and Midtown Bay rose by about six per cent each, while Midtown Modern jumped almost 20 per cent, crossing into the $3,200 psf range.
On the resale side, growth was more modest, with Southbank and Concourse Skyline seeing the strongest increases at around 10 to 11 per cent. A few, like Burlington Square and DUO Residences, even dipped slightly.
The key difference is the starting point. Because new launches already carry a much higher $PSF, even a similar percentage gain translates into a much larger dollar increase. This is one reason why the price gap continued to widen.
For instance, if we were to look at The M and City Gate in 2021:
THE M | THE BENCOOLEN | Price difference | |
Average price in 2021 | $1,889,478 | $1,226,000 | $663,478 |
Average price in 2022 | $1,941,938 | $1,250,000 | $691,938 |
The Bencoolen actually rose at a slightly faster pace percentage-wise: seven per cent compared to The M’s six per cent.
But in absolute dollar terms, seven per cent of $1.23 million works out to just $24,000, while six per cent of $1.89 million is about $113,000. The result is that the price gap widened in real terms, despite resale showing higher percentage gains.
New launches sold in 2023
Project | Completion year | Average price | Average $PSF | Average size | No. of units sold |
THE M | 2023 | $2,177,474 | $2,937 | 745 | 19 |
MIDTOWN BAY | 2024 | $2,456,097 | $3,179 | 770 | 26 |
Resale/ sub sale sold in 2023
Project | Completion year | Average price | Average $PSF | Average size | No. of units sold | Difference in average price compared to The M (has lowest average price) |
TEXTILE CENTRE | 1977 | $986,000 | $1,112 | 887 | 5 | $1,191,474 |
THE PLAZA | 1979 | $1,133,333 | $1,289 | 879 | 3 | $1,044,140 |
CITY GATE | 2018 | $1,313,000 | $2,045 | 648 | 5 | $864,474 |
BURLINGTON SQUARE | 1998 | $1,322,667 | $1,356 | 1001 | 3 | $854,807 |
SUNSHINE PLAZA | 2001 | $1,360,000 | $1,541 | 883 | 1 | $817,474 |
THE BENCOOLEN | 1999 | $1,411,675 | $1,594 | 892 | 29 | $765,799 |
THE M | 2023 | $1,715,000 | $2,570 | 667 | 1 | $462,474 |
SOUTHBANK | 2010 | $1,726,000 | $1,795 | 962 | 3 | $451,474 |
MIDTOWN BAY | 2024 | $2,000,000 | $2,693 | 743 | 1 | $177,474 |
MIDTOWN MODERN | 2025 | $2,000,000 | $3,149 | 635 | 1 | $177,474 |
DUO RESIDENCES | 2017 | $2,234,182 | $2,218 | 1011 | 11 | -$56,708 |
CONCOURSE SKYLINE | 2014 | $2,646,667 | $1,900 | 1392 | 3 | -$469,193 |
In 2023, new launches continued to climb higher, with The M averaging about $2.18 million and Midtown Bay at around $2.46 million. Average $PSF also rose, reaching almost $3,200 at Midtown Bay.
This widened the price gap versus resale and sub sale projects. Older developments like Textile Centre and The Plaza were available for under $1.2 million, while mid-2000s projects such as Sunshine Plaza and The Bencoolen stayed in the mid-$1.3 to $1.4 million range. City Gate and Southbank, both completed after 2010, remained in the $1.3 to $1.7 million bracket.
An interesting shift in 2023 was the appearance of sub sale transactions in Midtown Bay and Midtown Modern.
These units sometimes sold for less than the prevailing new launch averages, and it probably irritated developers that these stole sales from under their noses.
This meant that, at the time, buyers didn’t just have to turn to resale for cheaper options – they could sometimes find a cheaper subsale unit in the same project that they wanted.
This also underscores how wide the price gap had become: the $2.18 million needed for The M would comfortably cover almost every other resale two-bedder in D7, with the exception of DUO and Concourse.
Let’s move on to 2024:
New launches sold in 2024
Project | Completion year | Average price | Average $PSF | Average size | No. of units sold |
MIDTOWN BAY | 2024 | $2,533,216 | $3,397 | 743 | 5 |
THE M | 2023 | $2,588,000 | $2,642 | 980 | 1 |
Resale/ sub sale sold in 2024
Project | Completion year | Average price | Average $PSF | Average size | No. of units sold | Difference in average price compared to Midtown Bay (has lowest average price) |
TEXTILE CENTRE | 1977 | $1,067,176 | $1,201 | 889 | 5 | $1,466,040 |
THE PLAZA | 1979 | $1,132,000 | $1,304 | 869 | 4 | $1,401,216 |
BURLINGTON SQUARE | 1998 | $1,368,750 | $1,593 | 859 | 4 | $1,164,466 |
THE BENCOOLEN | 1999 | $1,439,000 | $1,631 | 883 | 2 | $1,094,216 |
CITY GATE | 2018 | $1,442,214 | $2,070 | 705 | 14 | $1,091,002 |
SUNSHINE PLAZA | 2001 | $1,445,000 | $1,558 | 932 | 2 | $1,088,216 |
SOUTHBANK | 2010 | $1,794,114 | $1,870 | 960 | 7 | $739,102 |
DUO RESIDENCES | 2017 | $1,975,000 | $2,248 | 881 | 8 | $558,216 |
THE M | 2023 | $2,031,222 | $2,828 | 719 | 4 | $501,994 |
MIDTOWN MODERN | 2025 | $2,400,000 | $3,328 | 721 | 1 | $133,216 |
CONCOURSE SKYLINE | 2014 | $2,960,000 | $2,099 | 1410 | 3 | -$426,784 |
In 2024, the price gap widened further if we look only at the averages. Midtown Bay and The M recorded new sales averaging around $2.53 to $2.59 million, with $PSF levels exceeding $3,300 at Midtown Bay.
Resale and sub sale activity was much more substantial, and mostly transacted at lower price points. Projects like Textile Centre and The Plaza still averaged just over $1.1 million, while Burlington Square, The Bencoolen, City Gate, and Sunshine Plaza clustered around $1.35 to $1.45 million. Even DUO, which had often been priced close to new launches, averaged just under $2 million.
On paper, this created a sharp gap: the average new launch two-bedder was close to $900,000 higher than the average resale.
But to add some nuance: only six new sale transactions took place in 2024, all at high price points, while there were many more resale deals at cheaper prices. This imbalance in volume pulled the overall resale average down, exaggerating the apparent gap.
In reality, the difference was project-specific. Buyers at Midtown Bay were comparing against resale stock priced anywhere from $1.1 to $2.0 million, and even sub sale units in The M and Midtown Modern were selling below the new sale averages. So the huge apparent gap is also due to transaction mix, rather than being reflective of the whole district.
Before moving on, it helps to frame D7’s price gap in a wider context.
We compared the difference between new and resale/sub sale two-bedders across all districts from 2014 to 2024 as well. This will give us a sense of how well they perform in a Singapore-wide context.
Year | 1 | 2 | 3 | 4 | 5 | 7 | 8 | 9 | 10 | 11 | 12 | 13 | 14 | 15 | 16 | 17 | 18 | 19 | 20 | 21 | 22 | 23 | 25 | 26 | 27 | 28 |
2014 | $567,735 | $231,634 | -$169,213 | $452,302 | $36,179 | $7,822 | -$69,571 | -$277,044 | $55,694 | -$44,346 | $516,181 | -$30,661 | -$132,479 | $137,847 | -$33,970 | -$100,300 | -$130,898 | -$174,830 | -$134,518 | -$520,314 | -$59,217 | $14,403 | -$138,084 | $29,503 | -$194,000 | |
2015 | $367,155 | $210,050 | $85,698 | $672,265 | $142,242 | $239,960 | -$125,696 | -$477,160 | -$31,583 | -$11,370 | $124,143 | -$56,176 | -$112,845 | $267,547 | -$21,265 | -$44,477 | -$89,176 | -$156,235 | $117,877 | -$120,373 | -$97,025 | -$156,953 | $12,489 | -$214,115 | ||
2016 | $518,802 | $66,011 | -$14,750 | $173,532 | -$88,803 | $272,259 | -$208,842 | -$376,803 | $607,770 | -$12,874 | -$182,749 | $66,118 | -$33,096 | $125,277 | -$6,152 | -$46,094 | -$15,750 | $1,237 | $113,234 | $3,933 | -$35,485 | -$208,200 | -$62,480 | -$76,029 | ||
2017 | $720,046 | $541,340 | $24,330 | $94,946 | -$132,365 | $449,250 | -$48,633 | -$306,546 | -$128,123 | $106,407 | $106,025 | -$3,223 | $183,980 | $106,383 | -$99,376 | -$20,559 | $20,041 | -$366,852 | $250,975 | $86,554 | -$167,407 | -$136,589 | -$9,263 | -$12,097 | -$62,836 | |
2018 | $843,976 | $1,608,130 | -$323,409 | -$68,270 | -$2,536,671 | -$62,249 | -$63,510 | $130,009 | $346,268 | -$129,322 | $291,294 | $226,833 | $82,756 | $42,124 | $44,483 | -$64,598 | -$58,649 | $119,071 | $142,477 | $97,278 | -$124,621 | $124,801 | $866 | -$30,713 | ||
2019 | $377,893 | $168,766 | -$141,395 | -$35,762 | -$709,574 | -$109,521 | -$351,584 | $376,557 | -$23,530 | $108,357 | -$2,435 | $149,094 | $413,537 | $194,121 | $23,830 | $64,645 | $32,291 | $68,374 | $215,420 | $24,513 | $156,160 | $124,455 | ||||
2020 | $2,917 | $29,378 | $72,917 | -$5,563 | -$138,250 | -$380,903 | $48,008 | $21,375 | $201,631 | $80,836 | $214,954 | $321,824 | -$171,631 | $88,390 | $92,348 | $100,867 | $142,383 | $13,624 | $202,537 | $77,766 | $169,223 | $172,927 | ||||
2021 | $101,889 | $243,090 | $698 | $77,714 | $306,155 | -$211,782 | -$297,508 | -$30,169 | -$1,752 | $286,266 | $260,706 | $300,540 | $365,557 | $174,113 | $290,023 | $172,216 | $86,943 | -$13,598 | $210,775 | $60,705 | $225,916 | $91,762 | ||||
2022 | $157,275 | $497,653 | $571,003 | $231,226 | $631,775 | $141,418 | -$158,956 | $174,285 | $16,751 | $278,177 | $332,191 | $165,713 | $321,171 | $373,882 | $70,232 | $532,892 | $310,961 | $177,296 | $65,161 | $229,733 | $376,679 | $212,259 | -$58,803 | |||
2023 | $395,190 | $356,211 | $614,889 | $473,640 | $754,053 | $21,714 | $312,249 | $98,573 | $66,109 | $353,825 | $206,073 | $264,281 | $280,652 | $502,321 | $427,120 | $376,566 | $164,526 | $617,272 | $278,354 | $167,134 | $64,235 | |||||
2024 | $178,795 | $419,612 | $350,229 | $413,830 | $606,277 | $893,058 | $219,112 | $699,179 | $162,129 | $380,081 | $307,447 | $219,835 | $338,559 | $274,101 | $632,241 | $189,633 | $267,198 | $362,100 | $420,524 | $124,891 | ||||||
% change in price gap from 2014 to 2024 | -68.51% | 81.15% | -306.97% | -8.51% | 1575.78% | 11316.85% | -179.09% | 1155.39% | -465.60% | -26.37% | -332.07% | 59.48% | -1096.65% | -373.28% | -461.63% | -136.45% | -551.22% | 2414.07% | -404.54% |
Among all the districts, D7’s divergence is among the steepest. Going from $306,000 in 2021 to almost $900,000 in 2024 makes it one of the largest jumps islandwide. This is especially significant when you consider that the gap widened so dramatically in the span of just three years, but this also has to be chalked up to the launches of headline developments that dramatically pushed up the price.
This can be partly attributed to D7’s “almost CCR” quality, where the market may have accepted that D7 is comparable to areas like D9 or D10. This is accompanied by other factors like headline integrated developments, as well as land prices, and this is a good point at which to raise the issue:
Why are the D7 new launches priced so much higher?
One factor is land cost. Looking at the land sale prices for The M, Midtown Bay, and Midtown Modern, the developers’ estimated break-even $PSF was already higher than the majority of resale projects in D7, and it remains so today.
Even before marketing and profit margins, new launches were bound to come in at price levels above older stock; and the pricing is baked in structurally by the land bids themselves. Resale projects, many of which date back to the 1990s and 2000s, were simply built on sites acquired for much cheaper.
This explains why even as resale $PSF has risen steadily, it remains difficult for these older projects to close the gap with new launches.

On top of the higher land costs, D7’s new launches are often integrated or mixed-use developments. This means office towers, hotels, and retail podiums. Several even come with direct underground connections to MRT stations, putting residents within a sheltered walk to the Bugis interchange or the Guoco Midtown network.
Integrated projects tend to be priced higher on average (and if you want more details on that, or how it affects resale, check out our study on it.)
In any case, the result is a structural pricing gap between new and resale two-bedders in D7.
The sales spiel behind some of the new launches is another factor. Midtown Bay and Midtown Modern were positioned as part of a larger vision for the rejuvenated Bugis and Beach Road corridor – a district framed by Grade-A offices, a thriving F&B and arts scene, and direct MRT links. Buyers are told they are buying into the “next big thing” for the city fringe, not just a home.
Older resale projects such as The Plaza, Burlington Square, or Textile Centre reflect a very different era. To be blunt, they’re less fancy, with fewer amenities; and they didn’t get the same lifestyle spin because D7 was a very different place in their era.
What they do offer are larger floor areas and more affordable price points, which appeal to buyers prioritising space over branding.
The resale projects provide size and value, but they cannot replicate the prestige and potential that newer counterparts were able to sell. This aspirational positioning why the pricing premium for new launches here has been maintained.
Let’s now take a look at rental yields
To round out the picture, we also need to consider rental performance.
We’ll look at rental transactions recorded between June 2024 and June 2025. On the price side, we’ll use the average resale transaction prices from 2024 to June 2025 for older projects. For the new launches – The M, Midtown Modern, and Midtown Bay – we’ll use their average new sale prices instead. This provides a fairer comparison of rental yield between new and resale units.
New launches
Project | Average rent | Average price | Rental yield |
MIDTOWN BAY | $6,065 | $2,359,395 | 3.08% |
THE M | $5,243 | $1,771,927 | 3.55% |
MIDTOWN MODERN | $5,733 | $1,776,237 | 3.87% |
Resale projects
Project | Average rent | Average price | Rental yield |
CITY GATE | $3,431 | $1,474,105 | 2.79% |
CONCOURSE SKYLINE | $7,871 | $2,960,000 | 3.19% |
SOUTHBANK | $5,104 | $1,776,480 | 3.45% |
SUNSHINE PLAZA | $4,396 | $1,446,667 | 3.65% |
THE BENCOOLEN | $4,532 | $1,445,167 | 3.76% |
BURLINGTON SQUARE | $4,708 | $1,391,000 | 4.06% |
DUO RESIDENCES | $6,882 | $2,001,111 | 4.13% |
THE PLAZA | $3,844 | $1,076,561 | 4.28% |
TEXTILE CENTRE | $4,117 | $1,085,980 | 4.55% |

For the new launches, yields ranged between 3.1 and 3.9 per cent. Midtown Modern led the way at 3.87 per cent, while The M posted 3.55 per cent and Midtown Bay came in at 3.08 per cent. These are respectable figures considering the higher entry prices, and they reflect the strong rental demand in D7.
Among resale projects, yields varied more widely; but we can see an expected result where older developments like Textile Centre and The Plaza delivered the highest yields, above four per cent, mainly because of their low purchase prices.
(Mind you, rentability is not the same as rental yield, and you may have a harder time capturing tenants who don’t like the lack of facilities or maintenance issues. Textile Centre also has a place of worship inside it, and we know some residential tenants actively dislike that.)
The takeaway is that while new launches are much more expensive, they can still achieve yields comparable to many resale counterparts. However, the very best yields are – as always – found in the older resale projects; just because they’re cheaper.
With that in mind, it’s also useful to look at actual profitability from the few sub sale and resale transactions in the three new launches.
This will show us how the early buyers have fared.
Gains
Project | Average gains | Average ROI | Average holding period (years) | No. of transactions |
MIDTOWN BAY | $56,000 | 2.9% | 3.3 | 1 |
THE M | $282,098 | 16.7% | 4.2 | 7 |
MIDTOWN MODERN | $418,593 | 22.6% | 3.3 | 3 |

Losses
Project | Average gains | Average ROI | Average holding period (years) | No. of transactions |
THE M | -$4,000 | -0.2% | 3.1 | 1 |
Performance has been broadly in line with most new launches (everywhere, not just in D7). There has only been one unprofitable transaction at The M, but the loss was negligible at about $4,000.
Despite their higher entry prices, these projects have delivered meaningful upside over a relatively short period; which is interesting for anyone considering D7.
Let’s also take a look at the profitability of the resale projects
We will look at transactions from 2024 to June 2025, and only sub sale to resale or resale to resale transactions
Gains
Project | Average gains | Average ROI | Average holding period (years) | No. of transactions |
CITY GATE | $135,000 | 10.3% | 3.4 | 2 |
SOUTHBANK | $208,000 | 14.0% | 5.6 | 6 |
BURLINGTON SQUARE | $175,000 | 15.9% | 3.0 | 1 |
CONCOURSE SKYLINE | $500,000 | 21.3% | 3.1 | 1 |
TEXTILE CENTRE | $275,960 | 32.9% | 3.7 | 3 |
THE BENCOOLEN | $432,500 | 40.0% | 5.8 | 2 |
Losses
Project | Average gains | Average ROI | Average holding period (years) | No. of transactions |
THE PLAZA | -$65,000 | -6.2% | 3.0 | 1 |
Over the past 18 months, resale transactions in D7 have also been largely profitable. The only unprofitable deal was at The Plaza, where a unit sold at a $65,000 loss (about –6.2 per cent) after three years.
Most other projects saw positive returns, with ROI ranging from 10 to 40 per cent. The standout performers were Textile Centre and The Bencoolen, where returns reached 33 to 40 per cent, helped by the aforementioned low entry prices.
Compared to the new launches, which have so far generated ROIs in the 16 to 23 per cent range, the resale results are more varied, but the overall picture is one of robust rental demand in D7.
With that in mind, it’s worth looking at where most of the activity is actually happening.
To do this, we’ll examine the price ranges in which the highest number of transactions have taken place in D7, over the past five years.
Price range | No. of transactions done |
Less than $1M | 66 |
Between $1M – $1.5M | 672 |
Between $1.5M – $2M | 471 |
Between $2M – $2.5M | 200 |
Between $2.5M – $3M | 119 |
Between $3M – $3.5M | 23 |
Between $3.5M – $4M | 34 |
Above $4M | 115 |

Looking at the past five years, the bulk of transactions in D7 have been concentrated in the $1 million to $1.5 million range, with 672 deals recorded. This was followed by the $1.5 million to $2 million range, which accounted for 471 transactions. Together, these two price bands made up the bulk of D7 transactions.
Based on the average prices from 2020 to 2024, we can surmise the bulk of activity in the $1 million to $2 million range is made up of one- and two-bedders, across both new launches and resale stock.
This reinforces the idea that compact units are accepted by buyers in D7, and that quantum is the main consideration for buyers here. We wouldn’t say it’s especially surprising, as families (who often prefer larger units) tend to be less represented in a densely built-up area like D7 – this is a district that may better attract young professional couples and landlords.
Conclusion
At first glance, the average prices of new and resale projects in D7 suggest a wide gulf; but this proved misleading, as much of this is down to transaction mix. Resale averages are often pulled down by a higher volume of older, more affordably priced units, while new launch averages are skewed upward when only a handful of higher-priced units (especially toward the tail end of a launch, when developers raise prices).
The key for D7 is to compare specific projects, which results in a very different gap from the overall averages. Despite their higher entry prices, the new launches here have shown rental yields and early sub sale profits that are equal to – and sometimes better than – resale projects.
But we also have to add the caveat that, for now, transaction volumes in the new launches remain limited; so it’s rather early for any conclusions about their longer-term performance. For now, the data suggests that D7’s new launches are holding their ground, and performing surprisingly well given their premium pricing.
The challenge with reading D7’s averages is that they don’t reflect transaction mix: small resale units bring the averages down, while large new units skew them up. The solution is to focus on project-level performance, where we see new launches holding their own despite higher entry prices.
If you’re weighing a purchase in D7, the key question isn’t “new vs resale”, it’s which projects within each segment are truly worth the premium. We can help you identify those.
Curious which specific new launches are outperforming expectations, and where the value still lies? Let’s chat.
For more comparisons on new and resale options between different districts, follow us on Stacked Pro.
Ryan J
A seasoned content strategist with over 17 years in the real estate and financial journalism sectors, Ryan has built a reputation for transforming complex industry jargon into accessible knowledge. With a track record of writing and editing for leading financial platforms and publications, Ryan's expertise has been recognised across various media outlets. His role as a former content editor for 99.co and a co-host for CNA 938's Open House programme underscores his commitment to providing valuable insights into the property market.Read next from Property Investment Insights

Property Trends Condo vs HDB: The Estates With the Smallest (and Widest) Price Gaps

Property Investment Insights Treasure at Tampines Pricing Review: How Its Prices Compare to D18, OCR, and the Wider Market

Property Investment Insights Which Resale Two-Bedroom Condos Quietly Made Buyers Six-Figure Profits In Singapore?

Property Investment Insights Low Floor vs. High Floor: What Transaction Data Reveals About the Premium
Latest Posts

Singapore Property News A Five-Room HDB Was Just Sold For A Record Fee Of $1.5m – Here’s How Much The Owners Could Have Made

Property Market Commentary 6 Upcoming New Condo Launches To Keep On Your Radar For The Rest Of 2025

Landed Home Tours We Toured A Little Known Landed Enclave Where The Last Sale Fetched Under $3 Million

Singapore Property News Decoupling Is No Longer a Property Hack: What the Courts and IRAS Have Made Clear

Property Advice The New Condos In Singapore With The Most Efficient Layouts In 2025 Revealed – And What To Look Out For

On The Market The Cheapest 4-Bedroom Condos Under $1.7M You Can Buy Today

Homeowner Stories We Could’ve Sold Our Home for More, But We Didn’t — Here’s Why We Let It Go in Just 24 Hours

Property Advice The Hidden Costs of Hiring a “Cheaper” Agent In Singapore

Property Market Commentary I Tested ChatGPT Against Claude on Singapore Condo Floor Plans — And There Was a Clear Winner

Property Market Commentary Why Developers Are Now Building for Families in Singapore’s Most Expensive Districts

Editor's Pick We Toured A Freehold Landed Estate Next To Mount Faber – With Semi-Detached Units From $5.2million

Singapore Property News Why More Singaporeans May Soon Trade Condos For Resale HDBs

Editor's Pick Singaporeans Are Buying More Overseas Homes — But Few Have Prepared For These Things

Singapore Property News This 5-Room HDB in Clementi Just Sold For $1.458M: Here’s What The Seller Could Have Made

On The Market We Found The Cheapest And Biggest 5-room Flats Over 1,400 Sq ft You Can Buy Right Now
