Analysing 10 Years of District 15 Boutique Condo Transactions: Insights Into What Drives Profitability

Get The Property Insights Serious Buyers Read First: Join 50,000+ readers who rely on our weekly breakdowns of Singapore’s property market.

A seasoned content strategist with over 17 years in the real estate and financial journalism sectors, Ryan has built a reputation for transforming complex industry jargon into accessible knowledge. With a track record of writing and editing for leading financial platforms and publications, Ryan's expertise has been recognised across various media outlets. His role as a former content editor for 99.co and a co-host for CNA 938's Open House programme underscores his commitment to providing valuable insights into the property market.
In Singapore’s property market, boutique condos have always divided opinion. Some buyers are drawn to their exclusivity, low density, and neighbourly feel; others see them as risky, offering fewer facilities, a narrower buyer pool, and sometimes higher maintenance costs.
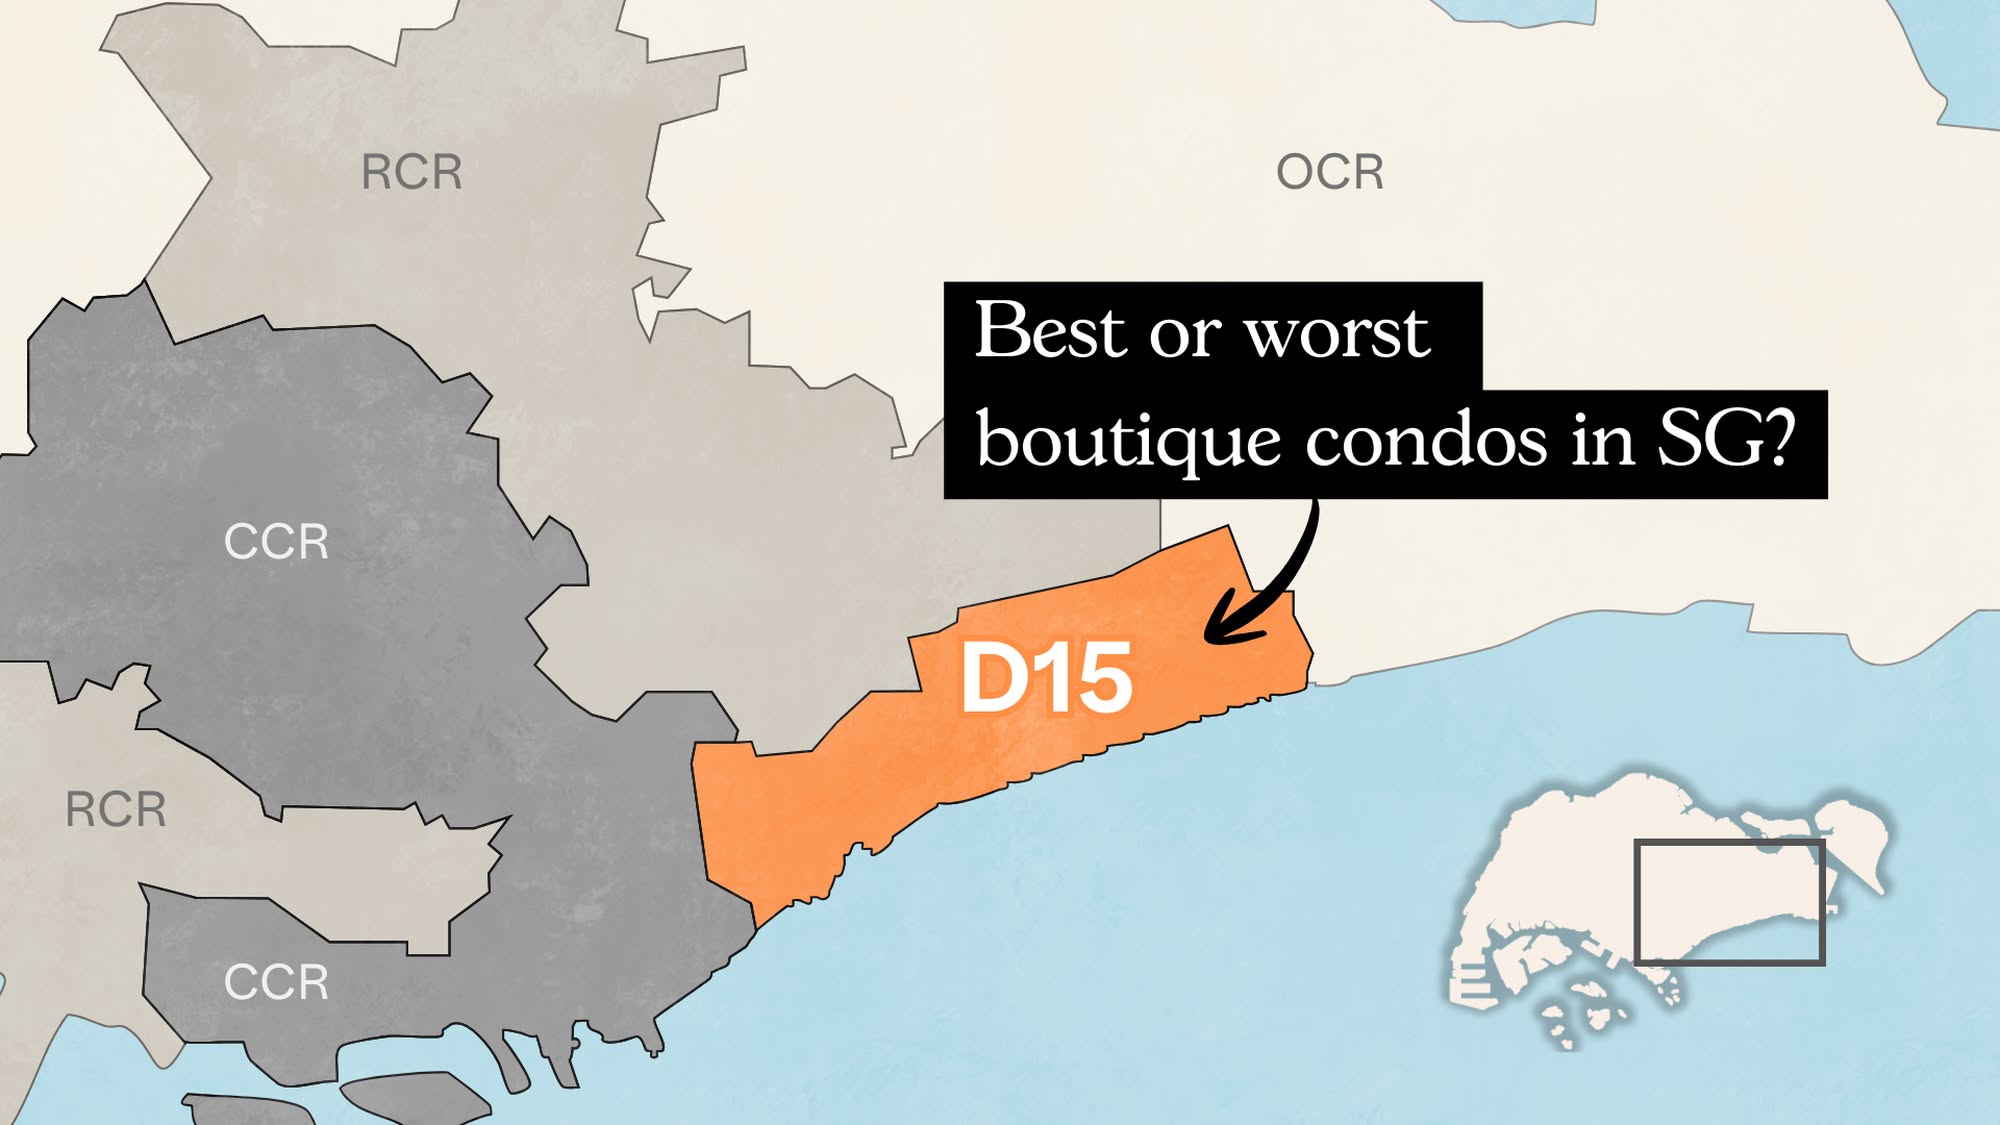
District 15 offers an ideal testing ground for this debate. With one of the highest concentrations of boutique developments in the country, it’s a place where the performance of these small-scale projects can be observed over time.
So, in such a competitive environment, have boutique condos managed to hold their own as investments? We analysed 10 years of resale transactions (2014–2024) to find out.
What counts as a boutique development?
For this analysis, we define boutique condos as those with 150 units or fewer, but note that some are much smaller – there are even tiny projects with as few as 6 units.
While we’ve gathered as much data as possible, these few ultra-small developments are so far off the market radar that transaction records are scarce. Some may even have just one or two transactions over a period of several years; so, for practical purposes and to avoid distortions, we have excluded these from the study.
Our focus is on transactions between 2014 and 2024. Out of all the data from 2014 – 2024, we have 2,364 condos in the data set.
Number of units | Number of condos | In D15 Only | % Boutique In D15 |
50 or less | 1086 | 324 | 30% |
51 to 150 | 621 | 82 | 13% |
151 or more | 656 | 48 | 7% |
Here, we can see the significance of D15 as a zone for boutique condos. Of the projects with 50 or fewer units, around a third of them are in D15.
First, let’s look at the general price movement of boutique condos versus larger condos
Year/Units | 0 to 50 | 51 – 150 | More than 150 |
2014 | $1,327 | $1,507 | $1,327 |
2015 | $1,252 | $1,473 | $1,257 |
2016 | $1,286 | $1,528 | $1,341 |
2017 | $1,286 | $1,547 | $1,390 |
2018 | $1,445 | $1,711 | $1,452 |
2019 | $1,416 | $1,804 | $1,594 |
2020 | $1,423 | $1,648 | $1,581 |
2021 | $1,466 | $1,786 | $1,682 |
2022 | $1,577 | $1,904 | $1,806 |
2023 | $1,782 | $2,016 | $1,964 |
2024 | $1,717 | $1,955 | $1,985 |
Annualised | 2.61% | 2.64% | 4.11% |

In general, boutique condos underperform their larger counterparts. This is because boutique projects tend to have limited facilities; some only have a small pool and gym, and nothing else. Boutique condo units also tend to have higher maintenance fees, as there are fewer owners to share the costs.
This isn’t to say they’re all bad; just that they have more niche appeal, and face challenges that larger counterparts don’t.
Next, we’re going to look at just resale and subsale transactions.
This is to filter out distortions from developer discounts, and the sales spikes from the launch years.
Year/Units | 0 to 50 | 51 – 150 | More than 150 |
2014 | $1,262 | $1,421 | $1,195 |
2015 | $1,214 | $1,373 | $1,193 |
2016 | $1,207 | $1,451 | $1,246 |
2017 | $1,216 | $1,497 | $1,279 |
2018 | $1,331 | $1,609 | $1,293 |
2019 | $1,367 | $1,594 | $1,357 |
2020 | $1,353 | $1,454 | $1,315 |
2021 | $1,413 | $1,556 | $1,381 |
2022 | $1,474 | $1,692 | $1,506 |
2023 | $1,647 | $1,780 | $1,636 |
2024 | $1,642 | $1,825 | $1,733 |
Annualised | 2.67% | 2.53% | 3.79% |

The results are still broadly similar – on average, larger condos see stronger $PSF.
That said, this is a broad trend, not a hard rule. Some boutique owners may point to personal success stories where their returns outpaced bigger, mass-market projects, and those cases certainly exist. But here, we’re looking purely at $PSF movement across the market, which doesn’t capture individual outliers.
Next, we’ll take a look at transaction volumes, which is a rather sticky point for boutique condos
Year/Units | 0 to 50 | 51 – 150 | More than 150 |
2014 | 747 | 1766 | 9038 |
2015 | 655 | 1452 | 10628 |
2016 | 867 | 1639 | 12168 |
2017 | 1441 | 2760 | 17554 |
2018 | 1500 | 2582 | 15188 |
2019 | 882 | 1930 | 13768 |
2020 | 1030 | 1950 | 15211 |
2021 | 1796 | 3700 | 24044 |
2022 | 1299 | 2798 | 16335 |
2023 | 1112 | 2198 | 14466 |
2024 | 1039 | 1986 | 16814 |
Total Volume | 12368 | 24761 | 165214 |

Condos with 50 units or fewer have lower transaction counts per project, but because there are so many of them, they still account for roughly a third of all boutique condo transactions in Singapore.
That said, the low volume at the individual project level means we have to be cautious when interpreting results. In very small developments, price changes are often driven by highly specific factors, like an exceptional renovation. As an aside, the low transaction volume means boutique condos are more susceptible to anchoring effects, so they can be more volatile in terms of performance.
Now let’s look at District 15 specifically, and its boutique condos.
Again, we’ll stick to resale and sub sale transactions:
Year/Units | 0 to 50 | 51 – 150 | More than 150 |
2014 | $1,123 | $1,300 | $1,272 |
2015 | $1,105 | $1,283 | $1,260 |
2016 | $1,049 | $1,256 | $1,280 |
2017 | $1,125 | $1,468 | $1,303 |
2018 | $1,177 | $1,459 | $1,373 |
2019 | $1,191 | $1,419 | $1,369 |
2020 | $1,183 | $1,380 | $1,388 |
2021 | $1,267 | $1,504 | $1,554 |
2022 | $1,390 | $1,647 | $1,647 |
2023 | $1,532 | $1,797 | $1,768 |
2024 | $1,556 | $1,869 | $1,903 |
Annualised | 3.31% | 3.70% | 4.11% |

The numbers in D15 mirror the wider pattern we saw above: lower unit counts showed lower $PSF growth.
But while this trend is consistent with the rest of Singapore, the gap between the smallest boutiques (0–50 units) and the mid-sized ones (51–150 units) is actually wider in D15, compared to the Singapore-wide average.
Let’s narrow down the data by focusing on a few specific boutique condos
We started with 406 boutique condos in D15 that had at least one transaction in the past 10 years.
To keep the analysis meaningful, we applied a few filters:
- Only condos with at least one transaction between 2014 and 2016 made the cut.
- Projects with no sales in the past two years were excluded.
- We removed developments without transactions in both the early (2014/15) and recent (2023/24) periods, as there would be no baseline to measure change.
- Any condo missing bedroom-type information was also taken out.
After these steps, we were left with 235 condos and 4,954 transactions to work with; a reasonable quantity from which to spot patterns. Here’s what we found:
Interestingly, unit count isn’t a strong driver of $PSF growth
When we broke down the $PSF movement by unit type, there wasn’t a strong relationship between the unit count of a boutique condo and its performance.
For one- to three-bedders, there was a slight negative correlation: smaller developments posted marginally higher $PSF gains, but not really enough to draw a strong conclusion.
Four-bedders showed a slight positive relationship, but the data here was limited. There weren’t enough four-bedroom transactions to meet our volume requirements.

Older boutique condos did seem to perform better
For one-, two-, and four-bedders, the data suggests older boutique projects have generally performed better; but this is with the caveat that transaction volumes are limited, and the trend is not particularly strong.

It’s possible that this is due to a lower entry price (i.e., these older condos are cheaper due to age). Newer condos – many sold as recent launches – would have started at higher $PSF levels, leaving less room for price appreciation.
For owner-occupiers, the lower quantum of older projects can also be a draw: the buyer could be getting a larger unit for the same price or less, compared to a newer project.
For these D15 projects, would being near Tao Nan or Kong Hwa Primary boost prices?
Tao Nan Primary and Kong Hwa Primary are quite sought-after schools in D15, so in theory, the projects within one kilometre of them should have a stronger selling point.
To test whether this translates into stronger price growth, we plotted the percentage $PSF change for each boutique condo on a map, then drew a ~1km radius around each school. This radius was measured from a single reference point rather than the school boundary, so we added an extra 10 metres to account for that.
Here’s what we found for one- and two-bedders:
The heat map plots each condo as a point: the redder the centre, the stronger its growth relative to others in the same bedroom category.

For one- and two-bedders, there’s no consistent cluster of deep red within the one-kilometre circles around Tao Nan or Kong Hwa.
If proximity to these schools truly pushed up values, we’d expect to see a dense patch of high-performing condos in the heart of each circle. Instead, the results are mixed:
Versailles, Suites @ Katong, Martia Residence, and Veranda have done well within the circle, but plenty of in-range projects also haven’t. Conversely, strong performers such as The Geranium and Straits View sit outside the circle entirely.
More from Stacked
This Homeowner Made $4.3m In Profit In 5 Years: The Best Performing New Launches Since 2018
Five years and one world-shaking epidemic later, the property market is like nothing we’ve ever seen. Realtors back then may…
So some agents may claim Tao Nan proximity boosts resale prices, but our data doesn’t support a clear profit advantage. What is more likely is that it improves saleability: it might be quicker and easier to find a buyer, but you won’t necessarily see better gains.
What if we look at three and four-bedders instead?
We might see more definitive results for three and four-bedders, being near the schools. This is because three and four-bedders are the preferred sizes for families, who are more likely to need school proximity:
From the map, a number of top-performing condos such as Castle Loft, Veranda, and Knox View are within one-kilometre of Tao Nan Primary.

As above though, not every condo in the radius consistently excelled. But there is a visibly strong trend: most of the best-performing larger units were located within the radius of the two schools. As such, it does appear that schools carry more weight among family buyers of larger units.
What about proximity to Thomson – East Coast Line (TEL) stations?
To test this, we compared $PSF changes between 2014 and 2016 and 2023/24. This is the period covering the construction and eventual opening of the TEL stations in D15.
The heat map shows no clear pattern. Some condos close to the new MRT stations have done well, but just as many nearby projects haven’t. In short, TEL proximity alone hasn’t guaranteed stronger price growth.
This also makes sense if you consider that D15 is a relatively pricey area. To be blunt, many of the buyers here can likely afford private transport or to regularly use PHVs. MRT stations tend to carry greater weight in heartland OCR neighbourhoods.
Now that we’ve looked at $PSF changes over the past 10 years, let’s look at actual profit and loss transactions
We started with 406 boutique condos in D15, which recorded at least one transaction in the past decade (7,037 sales in total).
To narrow the pool of condos to focus on, we filtered for the following:
- Only projects with at least one transaction between 2014 and 2016 were included, so we weren’t just looking at new launches.
- Any condo without a sale in the past two years was excluded.
That left us with 235 condos. From there, we required a minimum of 10 transactions over the 10-year period.
This reduced the list to 176 condos to focus on, with a total of 4,679 transactions.
Using this pool of condos, we’ve focused on the top five and bottom five most profitable projects to understand what sets them apart.
Top 5 in terms of ROI
Projects | Tenure | Units | Average Gains | Average ROI | Volume | Popular Schools |
FORT GARDENS | Freehold | 69 | $923,778 | 60% | 5 | None |
COASTARINA | Freehold | 56 | $521,984 | 43% | 7 | Tao Nan |
SUNNY PALMS | Freehold | 56 | $676,178 | 42% | 5 | None |
CHELSEA LODGE | Freehold | 78 | $444,833 | 40% | 6 | Kong Hwa |
FORTUNE JADE | Freehold | 85 | $606,400 | 39% | 5 | Kong Hwa |
Bottom 5 in terms of ROI
Projects | Tenure | Units | Average Gains | Average ROI | Volume | Popular Schools |
THE LINE @ TANJONG RHU | Freehold | 130 | $21,832 | -1% | 5 | None |
SUNNYVALE RESIDENCES | Freehold | 30 | $2,647 | 1% | 7 | Tao Nan |
ESPIRA SUITES | Freehold | 46 | $11,700 | 2% | 5 | None |
SUITES @ EASTCOAST | Freehold | 116 | $15,311 | 4% | 10 | None |
8M RESIDENCES | Freehold | 68 | $62,391 | 5% | 11 | None |
You’ll notice that all of these projects are freehold, but that’s normal; almost all of the boutique projects in D15 are freehold. What does stand out is that three of the top five performers – Costarina, Chelsea Lodge, and Fortune Jade – are within one kilometre of either Tao Nan or Kong Hwa.
Of the bottom five performers, only Sunny Vale Residences is within one kilometre of Tao Nan. So while school proximity isn’t a guaranteed win, it may play a supporting role in better outcomes.
Let’s look at the breakdown of each highly profitable transaction:
Projects | Date Bought | Bought At | Date Sold | Sold For | Size | Bed | Gains | ROI (%) | Holding Period | type of sale | Floor | Stack |
CHELSEA LODGE | 11/4/17 | $1,068,000 | 12/11/21 | $1,400,000 | 990 | 2 | $332,000 | 31.10% | 4.6 | Resale to Resale | 5 | 1 |
CHELSEA LODGE | 9/10/20 | $1,160,000 | 14/11/23 | $1,590,000 | 1001 | 2 | $430,000 | 37.10% | 3.1 | Resale to Resale | 5 | 16 |
CHELSEA LODGE | 28/6/17 | $1,020,000 | 26/5/23 | $1,680,000 | 1055 | 2 | $660,000 | 64.70% | 5.9 | Resale to Resale | 3 | 2 |
CHELSEA LODGE | 29/10/18 | $1,250,000 | 17/5/22 | $1,750,000 | 1195 | 3 | $500,000 | 40.00% | 3.6 | Resale to Resale | 4 | 1 |
CHELSEA LODGE | 22/9/16 | $1,150,000 | 6/11/20 | $1,430,000 | 1227 | 3 | $280,000 | 24.30% | 4.1 | Resale to Resale | 2 | 11 |
CHELSEA LODGE | 13/4/16 | $1,083,000 | 24/6/21 | $1,550,000 | 1302 | 3 | $467,000 | 43.10% | 5.2 | Resale to Resale | 1 | 11 |
COASTARINA | 29/7/16 | $805,000 | 21/2/24 | $1,228,888 | 678 | 2 | $423,888 | 52.70% | 7.6 | Resale to Resale | 2 | 10 |
COASTARINA | 24/4/19 | $1,165,000 | 1/7/22 | $1,530,000 | 840 | 3 | $365,000 | 31.30% | 3.2 | Resale to Resale | 4 | 6 |
COASTARINA | 21/9/18 | $1,088,000 | 18/5/22 | $1,568,000 | 840 | 3 | $480,000 | 44.10% | 3.7 | Resale to Resale | 3 | 8 |
COASTARINA | 3/6/14 | $955,000 | 24/4/19 | $1,165,000 | 840 | 3 | $210,000 | 22.00% | 4.9 | Resale to Resale | 4 | 6 |
COASTARINA | 25/2/19 | $1,280,000 | 26/9/22 | $2,080,000 | 1012 | 3 | $800,000 | 62.50% | 3.6 | Resale to Resale | 3 | 11 |
COASTARINA | 24/10/17 | $1,500,000 | 28/12/22 | $2,150,000 | 1389 | 3 | $650,000 | 43.30% | 5.2 | Resale to Resale | 5 | 2 |
COASTARINA | 20/8/18 | $1,525,000 | 6/5/24 | $2,250,000 | 1389 | 3 | $725,000 | 47.50% | 5.7 | Resale to Resale | 5 | 6 |
FORT GARDENS | 18/5/18 | $1,350,000 | 27/11/24 | $1,900,000 | 958 | 2 | $550,000 | 40.70% | 6.5 | Resale to Resale | 4 | 2 |
FORT GARDENS | 1/9/16 | $1,500,000 | 3/6/24 | $2,628,888 | 1346 | 3 | $1,128,888 | 75.30% | 7.8 | Resale to Resale | 13 | 3 |
FORT GARDENS | 8/8/19 | $1,900,000 | 3/4/23 | $2,650,000 | 1442 | 3 | $750,000 | 39.50% | 3.7 | Resale to Resale | 14 | 1 |
FORT GARDENS | 24/8/17 | $1,530,000 | 10/6/24 | $2,690,000 | 1442 | 3 | $1,160,000 | 75.80% | 6.8 | Resale to Resale | 7 | 1 |
FORT GARDENS | 20/5/15 | $1,530,000 | 28/6/23 | $2,560,000 | 1442 | 3 | $1,030,000 | 67.30% | 8.1 | Resale to Resale | 3 | 1 |
FORTUNE JADE | 26/6/20 | $1,828,000 | 2/5/24 | $2,628,000 | 1862 | 2 | $800,000 | 43.80% | 3.9 | Resale to Resale | 18 | 1 |
FORTUNE JADE | 28/7/20 | $1,568,000 | 18/10/23 | $2,100,000 | 1,087 | 3 | $532,000 | 33.90% | 3.2 | Resale to Resale | 15 | 3 |
FORTUNE JADE | 10/9/14 | $1,240,000 | 26/12/24 | $1,990,000 | 1098 | 3 | $750,000 | 60.50% | 10.3 | Resale to Resale | 3 | 1 |
FORTUNE JADE | 25/4/17 | $1,250,000 | 6/5/20 | $1,600,000 | 1,216 | 3 | $350,000 | 28.00% | 3 | Resale to Resale | 5 | 4 |
FORTUNE JADE | 3/9/19 | $2,180,000 | 22/12/23 | $2,780,000 | 2196 | 5 | $600,000 | 27.50% | 4.3 | Resale to Resale | 18 | 2 |
SUNNY PALMS | 21/4/21 | $1,148,000 | 16/5/24 | $1,500,000 | 1,044 | 3 | $352,000 | 30.70% | 3.1 | Resale to Resale | 2 | 6 |
SUNNY PALMS | 5/7/16 | $1,140,000 | 12/4/24 | $1,580,000 | 1184 | 3 | $440,000 | 38.60% | 7.8 | Resale to Resale | 1 | 12 |
SUNNY PALMS | 11/6/15 | $1,280,000 | 24/9/18 | $1,330,000 | 1313 | 3 | $50,000 | 3.90% | 3.3 | Resale to Resale | 1 | 15 |
SUNNY PALMS | 17/7/20 | $1,800,000 | 21/7/22 | $3,088,888 | 2971 | 3 | $1,288,888 | 71.60% | 2 | Resale to Resale | 4 | 2 |
SUNNY PALMS | 1/9/20 | $1,950,000 | 6/10/23 | $3,200,000 | 3,111 | 3 | $1,250,000 | 64.10% | 3.1 | Resale to Resale | 4 | 1 |
Most of the highly profitable transactions came from larger two- and three-bedder units, often exceeding 1,000 sq ft.
Holding periods were typically between three and eight years, with several deals achieving ROIs of over 60 per cent – particularly in Fort Gardens, Sunny Palms, and Coastarina.
Now let’s look at the bottom performers:
project_name | Date Bought | Bought At | Date Sold | Sold For | Size | Bed | Gains | ROI (%) | Holding Period | type of sale | Floor | Stack |
8M RESIDENCES | 21/5/15 | $1,020,000 | 25/5/18 | $1,100,000 | 517 | 1 | $80,000 | 7.80% | 3 | New Sale to Resale | 9 | 3 |
8M RESIDENCES | 8/6/15 | $1,083,000 | 30/3/20 | $1,150,000 | 517 | 1 | $67,000 | 6.20% | 4.8 | New Sale to Resale | 18 | 3 |
8M RESIDENCES | 7/7/15 | $1,060,000 | 31/8/23 | $1,230,000 | 678 | 1 | $170,000 | 16.00% | 8.2 | New Sale to Resale | 4 | 3 |
8M RESIDENCES | 27/2/17 | $1,358,000 | 28/10/21 | $1,380,000 | 646 | 2 | $22,000 | 1.60% | 4.7 | New Sale to Resale | 14 | 4 |
8M RESIDENCES | 9/6/17 | $1,314,000 | 10/6/22 | $1,390,000 | 646 | 2 | $76,000 | 5.80% | 5 | Resale to Resale | 7 | 4 |
8M RESIDENCES | 8/6/15 | $1,529,000 | 30/3/22 | $1,650,000 | 775 | 2 | $121,000 | 7.90% | 6.8 | New Sale to Resale | 19 | 1 |
8M RESIDENCES | 23/12/14 | $1,980,000 | 26/12/17 | $1,810,000 | 1335 | 2 | -$170,000 | -8.60% | 3 | New Sale to Resale | 20 | 4 |
8M RESIDENCES | 23/4/15 | $1,877,763 | 12/5/22 | $1,880,000 | 1421 | 2 | $2,237 | 0.10% | 7.1 | New Sale to Resale | 4 | 4 |
8M RESIDENCES | 19/9/15 | $1,644,000 | 12/11/20 | $1,630,000 | 893 | 3 | -$14,000 | -0.90% | 5.2 | New Sale to Resale | 9 | 2 |
8M RESIDENCES | 10/7/17 | $1,620,000 | 16/10/23 | $1,775,000 | 893 | 3 | $155,000 | 9.60% | 6.3 | Resale to Resale | 6 | 2 |
8M RESIDENCES | 4/11/14 | $1,622,931 | 22/3/23 | $1,800,000 | 893 | 3 | $177,069 | 10.90% | 8.4 | New Sale to Resale | 15 | 2 |
ESPIRA SUITES | 19/4/18 | $685,000 | 28/5/24 | $745,000 | 441 | 1 | $60,000 | 8.80% | 6.1 | Resale to Resale | 5 | 5 |
ESPIRA SUITES | 13/10/14 | $680,000 | 1/2/21 | $640,000 | 441 | 1 | -$40,000 | -5.90% | 6.3 | Resale to Resale | 2 | 5 |
ESPIRA SUITES | 31/3/14 | $728,500 | 27/6/23 | $715,000 | 441 | 1 | -$13,500 | -1.90% | 9.2 | Resale to Resale | 4 | 4 |
ESPIRA SUITES | 4/9/14 | $728,000 | 6/11/20 | $660,000 | 474 | 1 | -$68,000 | -9.30% | 6.2 | Resale to Resale | 2 | 4 |
ESPIRA SUITES | 3/4/17 | $680,000 | 19/7/24 | $800,000 | 484 | 1 | $120,000 | 17.60% | 7.3 | Resale to Resale | 4 | 6 |
SUITES @ EASTCOAST | 18/11/14 | $600,000 | 14/12/20 | $547,000 | 355 | 1 | -$53,000 | -8.80% | 6.1 | Resale to Resale | 2 | 13 |
SUITES @ EASTCOAST | 22/7/21 | $588,888 | 25/7/24 | $642,000 | 366 | 1 | $53,112 | 9.00% | 3 | Resale to Resale | 3 | 22 |
SUITES @ EASTCOAST | 9/3/18 | $560,000 | 22/3/22 | $600,000 | 366 | 1 | $40,000 | 7.10% | 4 | Resale to Resale | 4 | 16 |
SUITES @ EASTCOAST | 22/6/15 | $595,000 | 26/5/23 | $638,000 | 366 | 1 | $43,000 | 7.20% | 7.9 | Resale to Resale | 2 | 1 |
SUITES @ EASTCOAST | 3/2/16 | $580,000 | 19/11/24 | $660,000 | 366 | 1 | $80,000 | 13.80% | 8.8 | Resale to Resale | 1 | 1 |
SUITES @ EASTCOAST | 14/8/17 | $528,000 | 20/4/21 | $568,000 | 377 | 1 | $40,000 | 7.60% | 3.7 | Resale to Resale | 4 | 8 |
SUITES @ EASTCOAST | 10/7/14 | $1,080,000 | 19/10/21 | $1,050,000 | 947 | 1 | -$30,000 | -2.80% | 7.3 | Resale to Resale | 5 | 21 |
SUITES @ EASTCOAST | 27/8/18 | $830,000 | 18/7/23 | $905,000 | 570 | 2 | $75,000 | 9.00% | 4.9 | Resale to Resale | 2 | 6 |
SUITES @ EASTCOAST | 10/3/14 | $1,275,000 | 27/9/19 | $1,200,000 | 1292 | 2 | -$75,000 | -5.90% | 5.6 | Resale to Resale | 5 | 19 |
SUITES @ EASTCOAST | 3/7/14 | $1,700,000 | 6/7/18 | $1,680,000 | 1787 | 3 | -$20,000 | -1.20% | 4 | Resale to Resale | 5 | 15 |
SUNNYVALE RESIDENCES | 17/11/16 | $1,464,900 | 7/12/20 | $1,350,000 | 936 | 2 | -$114,900 | -7.80% | 4.1 | New Sale to Resale | 2 | 1 |
SUNNYVALE RESIDENCES | 7/1/16 | $1,433,937 | 8/7/22 | $1,560,000 | 936 | 2 | $126,063 | 8.80% | 6.5 | New Sale to Resale | 3 | 7 |
SUNNYVALE RESIDENCES | 5/6/15 | $1,470,832 | 9/3/23 | $1,610,000 | 936 | 2 | $139,168 | 9.50% | 7.8 | New Sale to Resale | 4 | 1 |
SUNNYVALE RESIDENCES | 23/2/18 | $1,826,000 | 26/4/21 | $1,550,000 | 1119 | 3 | -$276,000 | -15.10% | 3.2 | Resale to Resale | 2 | 4 |
SUNNYVALE RESIDENCES | 28/7/17 | $1,713,055 | 27/6/22 | $1,880,000 | 1119 | 3 | $166,945 | 9.70% | 4.9 | New Sale to Resale | 4 | 4 |
SUNNYVALE RESIDENCES | 16/7/14 | $1,674,000 | 20/4/21 | $1,650,000 | 1130 | 3 | -$24,000 | -1.40% | 6.8 | New Sale to Resale | 5 | 2 |
SUNNYVALE RESIDENCES | 8/1/15 | $1,686,747 | 10/1/19 | $1,688,000 | 1367 | 3 | $1,253 | 0.10% | 4 | New Sale to Resale | 1 | 2 |
THE LINE @ TANJONG RHU | 1/11/17 | $1,211,000 | 20/8/20 | $1,020,000 | 420 | 1 | -$191,000 | -15.80% | 2.8 | Resale to Resale | 17 | 8 |
THE LINE @ TANJONG RHU | 19/12/17 | $1,038,000 | 4/7/22 | $960,000 | 420 | 1 | -$78,000 | -7.50% | 4.5 | Resale to Resale | 9 | 8 |
THE LINE @ TANJONG RHU | 22/4/17 | $1,034,600 | 19/10/23 | $1,080,000 | 420 | 1 | $45,400 | 4.40% | 6.5 | New Sale to Resale | 16 | 8 |
THE LINE @ TANJONG RHU | 21/3/14 | $1,890,000 | 13/12/24 | $2,050,000 | 893 | 3 | $160,000 | 8.50% | 10.7 | New Sale to Resale | 17 | 2 |
THE LINE @ TANJONG RHU | 8/10/21 | $2,287,240 | 28/11/24 | $2,460,000 | 1055 | 3 | $172,760 | 7.60% | 3.1 | Resale to Resale | 9 | 7 |
Most of the least profitable transactions came from smaller units, especially one-bedders under 500 sq ft, which tended to have minimal gains or even losses.
Holding periods varied widely, but even longer ownership often failed to deliver strong returns. For example, at Suites @ East Coast, a 947 sq ft one-bedder was held for more than seven years yet still sold at a loss; as did a 1,292 sq ft two-bedder sold after 5.6 years.
Note that Sunnyvale Residences saw a 1,119 sq ft three-bedder lose 15.1 per cent in just over three years, despite being within range of Tao Nan.
What the transactions tell us
From the above, we can see the winners are typically larger units, particularly three-bedders. On the other hand, the one-bedders often underperform. This aligns with a broader trend we’ve seen across Singapore over the last few years: bigger homes tend to deliver stronger ROI:
Profitable
Bed | Average Size | Average ROI (%) | Average Sale Price | Volume |
2 | 1091 | 45.02% | $1,737,815 | 6 |
3 | 1368 | 45.11% | $2,018,608 | 21 |
5 | 2196 | 27.50% | $2,780,000 | 1 |
Grand Total | 1338 | 44.46% | $1,985,631 | 28 |
Unprofitable
Bed | Average Size | Average ROI (%) | Average Sale Price | Volume |
1 | 466 | 2.97% | $822,500 | 18 |
2 | 949 | 2.04% | $1,473,500 | 10 |
3 | 1115 | 2.78% | $1,816,300 | 10 |
Grand Total | 764.1578947 | 2.68% | $1,255,342 | 38 |
Interestingly, unit size within the same bedroom category also made a difference.
For two-bedders, profitable sales averaged 1,091 sq ft, compared to 949 sq ft for unprofitable ones. Among three-bedders, the winners averaged 1,368 sq ft, versus 1,115 sq ft for those that underperformed.
In other words, more space usually meant better returns, even when the bedroom count was the same.
While we’ve discussed the MRT issues above, let’s take a look at these specific condos’ proximity to MRT stations
Perhaps we’ll see a strong pattern or correlation:
Profitable projects | Closest MRT | Walking Time |
FORT GARDENS | Katong Park | 4 minutes |
COASTARINA | Marine Terrace | 12 minutes |
SUNNY PALMS | Kembangan | 8 minutes |
CHELSEA LODGE | Tanjong Katong | 9 minutes |
FORTUNE JADE | Dakota | 9 minutes |
Less profitable projects | Closest MRT | Walking Time |
THE LINE @ TANJONG RHU | Tanjong Katong | 5 minutes |
SUNNYVALE RESIDENCES | Marine Terrace | 15 minutes |
ESPIRA SUITES | Kembangan | 7 minutes |
SUITES @ EASTCOAST | Siglap | 11 minutes |
8M RESIDENCES | Katong Park | 5 minutes |
Unfortunately, there’s no obvious pattern emerging here. The least profitable development, The Line @ Tanjong Rhu, sits just five minutes from Tanjong Katong MRT station, while Costarina (the second most profitable) is over 12 minutes from Marine Terrace MRT station.
Poorly laid-out floor plans may have contributed to The Line @ Tanjong Rhu’s weaker showing, but location efficiency alone rarely tells the whole story. Factors like buyer demographics, unit mix, and even timing of entry and exit likely play a role, suggesting that for boutique condos in D15, MRT proximity on its own isn’t a reliable predictor of returns.
Conclusion
Our analysis of $PSF changes from 2014/16 to 2023/24, along with transaction-level profit and loss data, found no strong link between the number of units in a boutique condo and its profitability.
While some older projects showed better appreciation, the effect was modest. Similarly, being within one-kilometre of a sought-after primary school (Tao Nan or Kong Hwa) didn’t guarantee higher returns: some nearby projects indeed performed well, but there are others outside the radius that also performed well.
MRT proximity, including to the new TEL stations, also showed no clear advantage.
Where we did see a clear pattern was in unit type and size. Larger units, especially three-bedders, consistently delivered better returns. Even for units with the same designated number of bedrooms, a higher square footage resulted in better performance.
So while there’s no definitive formula for the “ideal” boutique condo here, we can conclude that the odds line up for the following:
An older freehold development – with larger units – within one-kilometre of a popular Primary school.
This is likely due to the lower entry price and wider pool of prospective resale buyers; these qualities determine a good base from which to start shortlisting options.
While many buyers size up boutique condos based on single factors, MRT proximity, school radius, or number of units, we hope this analysis has shed light on why those alone don’t reliably predict returns in D15. It’s not about finding the smallest project near the nearest station; it’s about identifying the mix of fundamentals that consistently deliver value over time.
In this case, older freehold developments with larger units (especially three-bedders) within one kilometre of a sought-after primary school stood out. Lower entry prices and a broader resale buyer pool make these a stronger starting point when shortlisting options.
Stay open to finding similar opportunities in other districts that most agents aren’t discussing in depth.
Curious how these principles apply to your own investment goals? Let’s chat.
For more deep dives into various property segments in Singapore, in different districts, follow us on Stacked Pro.
Ryan J
A seasoned content strategist with over 17 years in the real estate and financial journalism sectors, Ryan has built a reputation for transforming complex industry jargon into accessible knowledge. With a track record of writing and editing for leading financial platforms and publications, Ryan's expertise has been recognised across various media outlets. His role as a former content editor for 99.co and a co-host for CNA 938's Open House programme underscores his commitment to providing valuable insights into the property market.Read next from Property Investment Insights

Property Investment Insights District 7 vs District 9: Which Prime Location Has Delivered Better Condo Value?

New Launch Condo Analysis Springleaf Residence Pricing Review: How It Compares To Nearby Resale And New Launches

Property Investment Insights New Launch vs Resale Condos in District 9: Which Bedroom Types Offer Better Value Today?

New Launch Condo Analysis Canberra Crescent Residences Pricing Breakdown: A Price Comparison With Nearby Condos
Latest Posts

Homeowner Stories Ex-Police Officer Reveals the ‘Simple’ Investment Strategy That Helped Him Secure 40 Property Deals

Property Advice The Ideal Size for Each Room of Your Condo to Actually Feel Liveable Revealed

Property Advice 5 Mistakes You Make When Comparing Condo Prices – Your ‘Good Deal’ Might Be Hiding a Secret

Overseas Property Investing 4 Hidden Risks To Avoid When Buying Property In Malaysia (A Guide For Singaporeans)

Homeowner Stories I Bought a Freehold Property in Singapore and Regret It — Here’s the Big Mistake I Made

Editor's Pick We Toured A Rare Part Of Singapore Where Terrace Houses Are Bigger Than The Semi-Detached Units

Singapore Property News What Buyers Overlook When Purchasing Older Condos (Until It’s Too Late)

Editor's Pick 5 Ways Housing Shapes Singapore’s National Identity

On The Market 5 Attractive Freehold Condos With Private Pools (Under $2M)

Editor's Pick Springleaf Residence Review: A 941 Mega-Development Near The MRT From $1,995 Psf

Property Market Commentary 4 Condo Layouts And Features Buyers Are Moving Away From in 2025

Editor's Pick Summer Suites Condo Review: A Freehold Johor Bahru Condo Near The RTS Link

Editor's Pick Over 900 Units Sold in One Weekend: The Surprising Lessons From River Green, Promenade Peak & Canberra Crescent

Singapore Property News Is Property Decoupling To Avoid ABSD Now Illegal?

Editor's Pick I Visited Freehold Terraces, Semi-Ds, and Detached Homes in the East Ranging from $2.5 Million to $11 Million
