


There’s always one: a condo unit that ends up with negative profit, even as the neighbours are raking in gains. The reasons are hard to see from data alone: a poorer view in a given stack, a rushed sale by a panicked seller, renovations that look like the contractor was colourblind, going through a bad divorce, etc. We may never know the full reasons for sure – but sometimes there are correlations and patterns that stick out. In light of that, we present the condo transactions that have somehow lost money, despite the post-Covid boom market:
So many readers write in because they're unsure what to do next, and don't know who to trust.
If this sounds familiar, we offer structured 1-to-1 consultations where we walk through your finances, goals, and market options objectively.
No obligation. Just clarity.
Learn more here.
Why were losses unusual during the post-COVID period
To put all of this in context, it’s necessary to grasp what happened during COVID; this will help to frame why the following losses are so improbable. So there’s a little bit of a sidetrack into the issue here:
When people talk about Singapore’s “COVID years,” they usually mean the period from 2020 to 2022, when restrictions were at their strongest. This was when the property market was most severely affected – agents couldn’t conduct viewings, for example, and construction slowed or stopped entirely.
The first local case appeared in January 2020, and by April, the country had gone into the Circuit Breaker. Even as reopening began in phases after June, masks, SafeEntry check-ins, and small group limits impacted the real estate industry. It meant a sudden pause in viewings and launches, but also the beginnings of pent-up demand that would spill into later years.
By 2021, things loosened up, only for the Delta wave to bring back tighter measures under “Phase 2 (Heightened Alert).” The property market was a bit less affected by then: buyers had adapted to virtual viewings, new launches still sold briskly, and low interest rates kept demand resilient.
(Interest rates tend to drop during times of crisis like COVID, as the US Federal Reserve will cut rates to stimulate the economy.)
The real inflection came in 2022. By March and April of that year, major easing began. Group size limits expanded, masks became optional outdoors, and our borders reopened. By 2H 2022, most restrictions were gone. Coupled with household savings built up during the pandemic, housing demand surged, helping to fuel the post-COVID boom in both HDB and private home prices.
By early 2023, the property market shifted into a new phase: sellers were emboldened by rising prices, and buyers faced record-high prices. For most owners, simply holding through these years was enough to secure appreciation.
That’s why negative-profit transactions stand out so sharply: In a boom market, the baseline is growth; going against it requires either bad timing, poor luck, or both. That may be what happened to the unusual cases below:
Unexpected losses during COVID
We’ll treat the COVID years as 2020 to 2022 for the reasons mentioned above, and look at transactions during this period. We’ll break the results down by bedroom type and then by transaction type. This way, we can pinpoint whether the rare losses are concentrated in certain unit sizes or tied more to the timing and nature of the purchase.
One-bedroom units
New sale to sub sale/resale
| Project | Average losses | Average ROI | Average holding period (years) | No. of transactions | Average purchase price | Completion year | Tenure |
| ONE PEARL BANK | -$84,500 | -6.96% | 3.9 | 2 | $1,244,500 | 2024 | 99 yrs |
| FOURTH AVENUE RESIDENCES | -$65,667 | -5.58% | 3.6 | 3 | $1,170,000 | 2022 | 99 yrs |
| NORMANTON PARK | -$39,750 | -3.94% | 3.2 | 2 | $1,009,500 | 2023 | 99 yrs |
Sub sale/resale to resale
| Project | Average losses | Average ROI | Average holding period (years) | No. of transactions | Average purchase price | Completion year | Tenure |
| MARINA ONE RESIDENCES | -$115,820 | -6.72% | 4.1 | 4 | $1,635,320 | 2017 | 99 yrs |
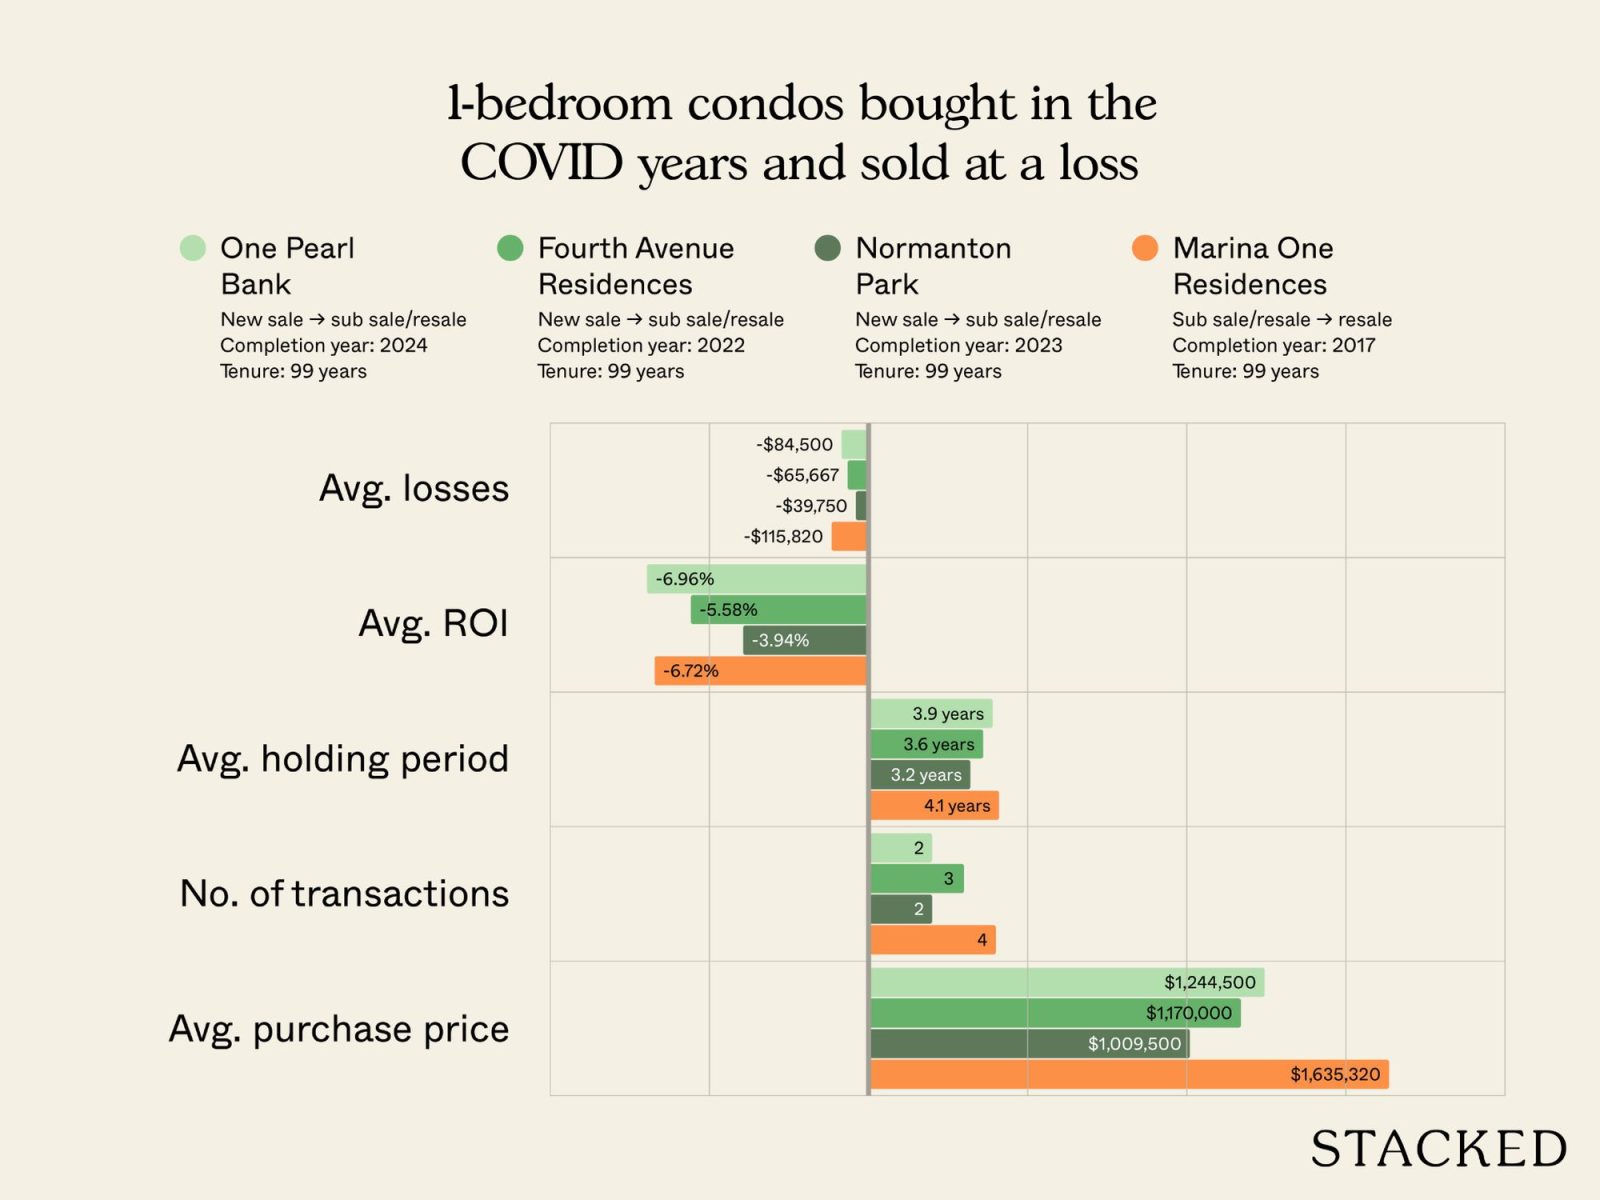
The most notable one-bedder losses are at One Pearl Bank, Fourth Avenue Residences, and Normanton Park. Here we see average losses between about $40,000 and $85,000.
Whilst this post-COVID period did allow some sellers to see strong gains over a short holding period, some fundamental risks remain. Short holding periods – as seen from many of the transactions above – can also bring about the inability to ride out certain issues. A “fire sale” due to incidents like divorce, loss of income, etc., often correlates with shorter holding periods, for example.
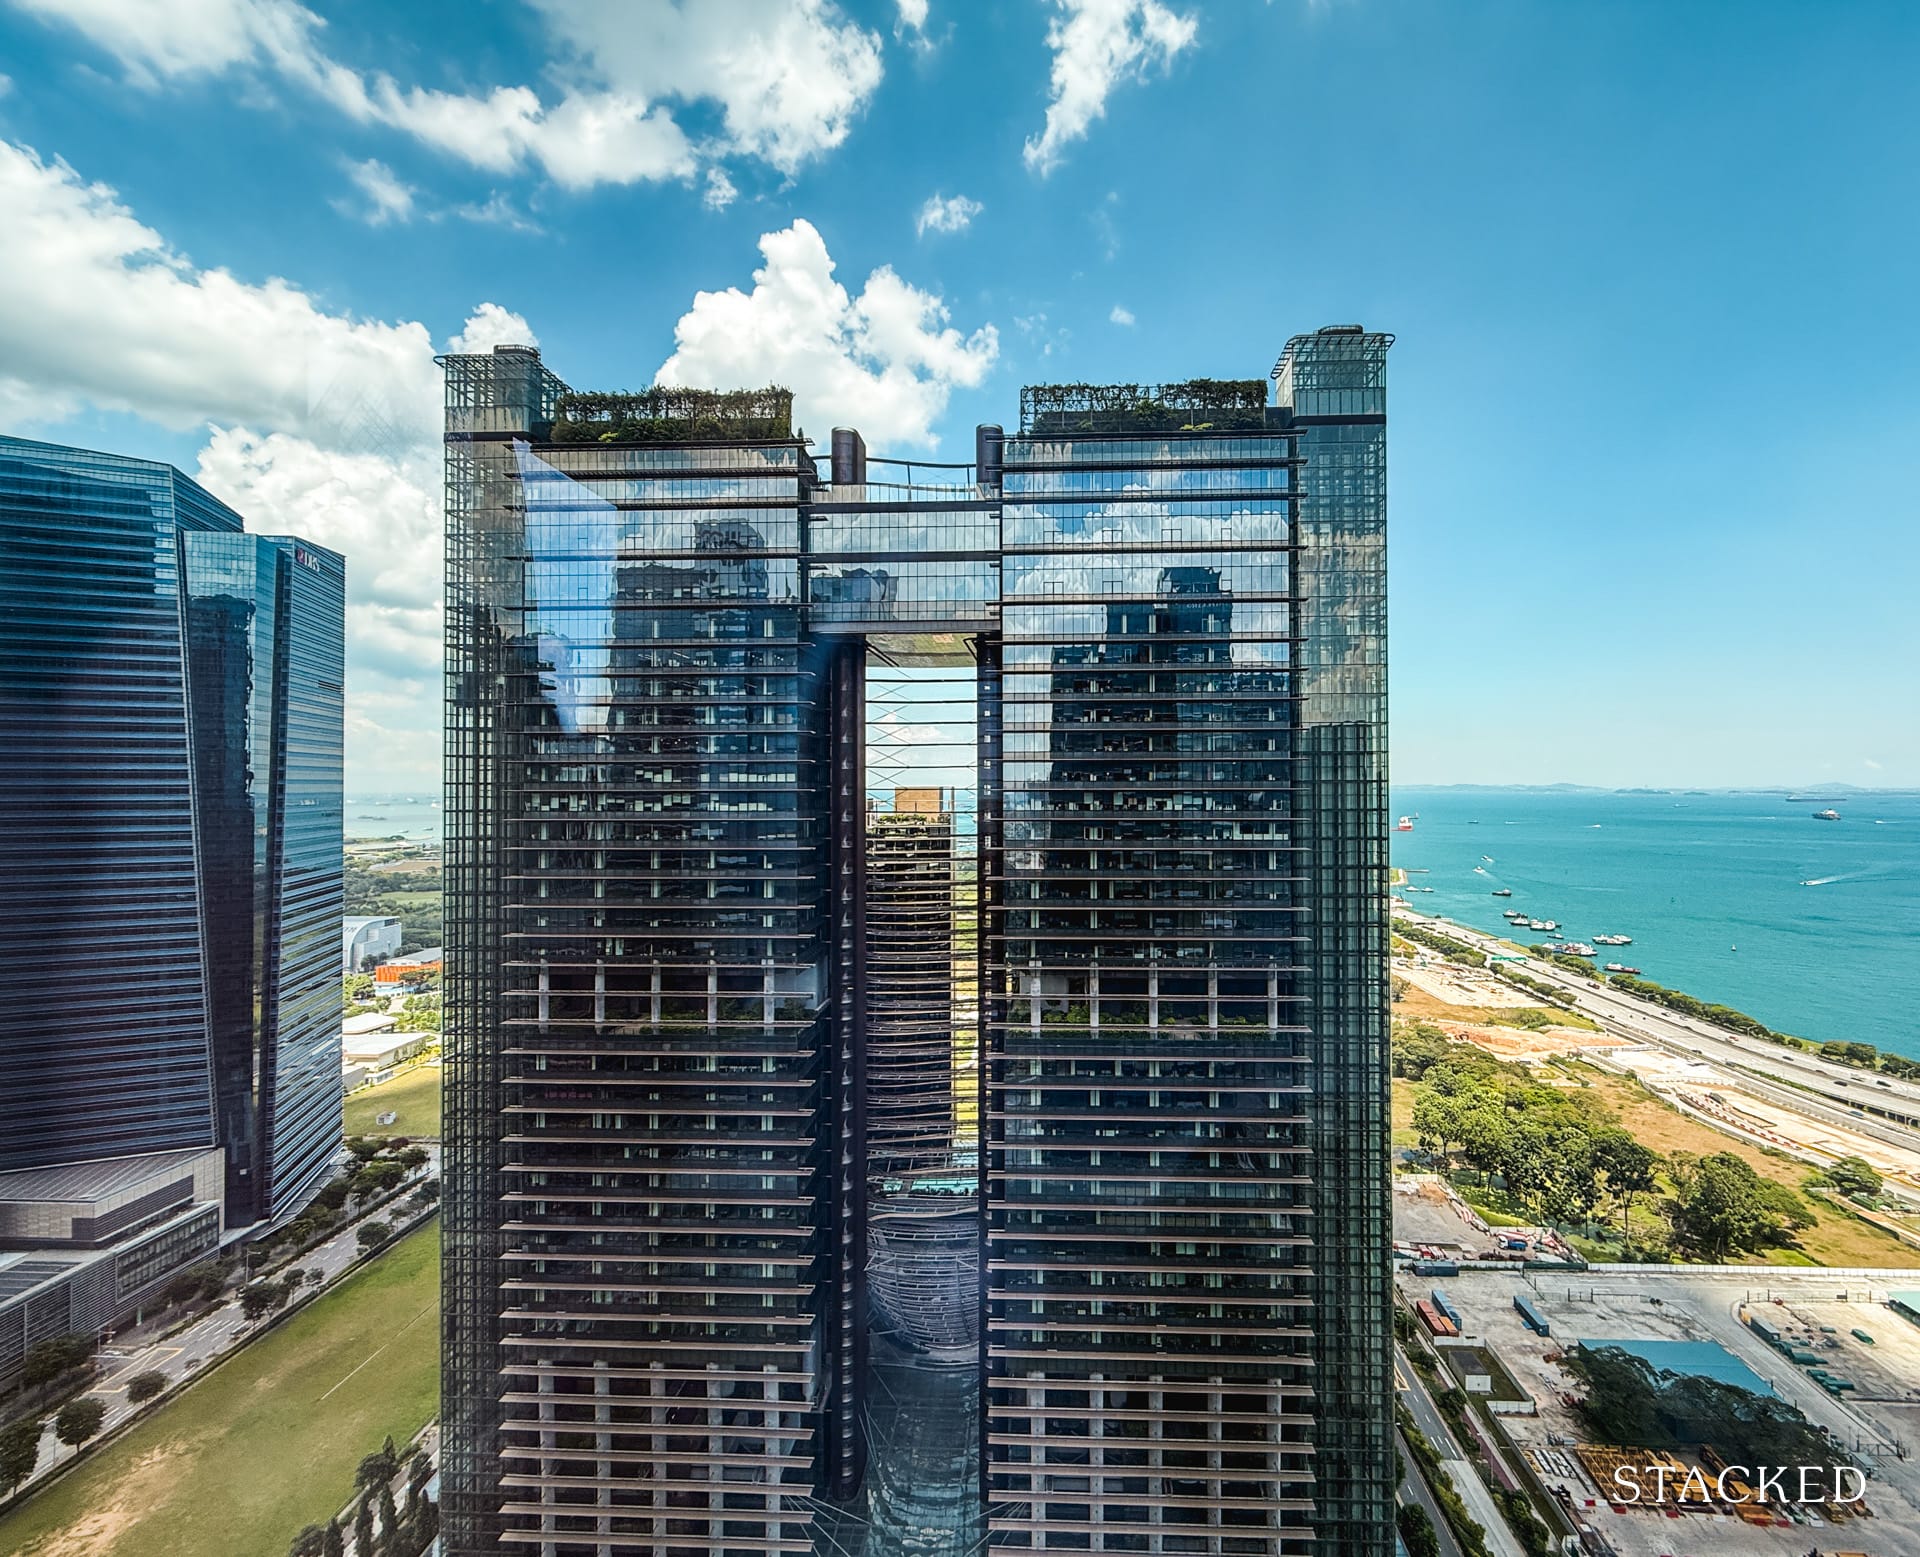
That said, we notice Marina One Residences still shows up with losses averaging about $116,000. From word on the ground, this is due to the high quantum of its one-bedders. The buyer pool for high-priced one-bedders is quite niche; and some realtors note that recent launches such as Skye at Holland, River Green, and Promenade Peak have one-bedders at a more competitive or realistic quantum; and the location is arguably as strong as Marina, if not stronger, due to being more family-friendly.
Two-bedroom units
New sale to sub sale/resale
| Project | Average losses | Average ROI | Average holding period (years) | No. of transactions | Average purchase price | Completion year | Tenure |
| THE FLORENCE RESIDENCES | -$48,500 | -4.14% | 3.3 | 2 | $1,208,500 | 2023 | 99 yrs |
| MARTIN MODERN | -$70,500 | -3.48% | 3.5 | 2 | $2,020,500 | 2021 | 99 yrs |
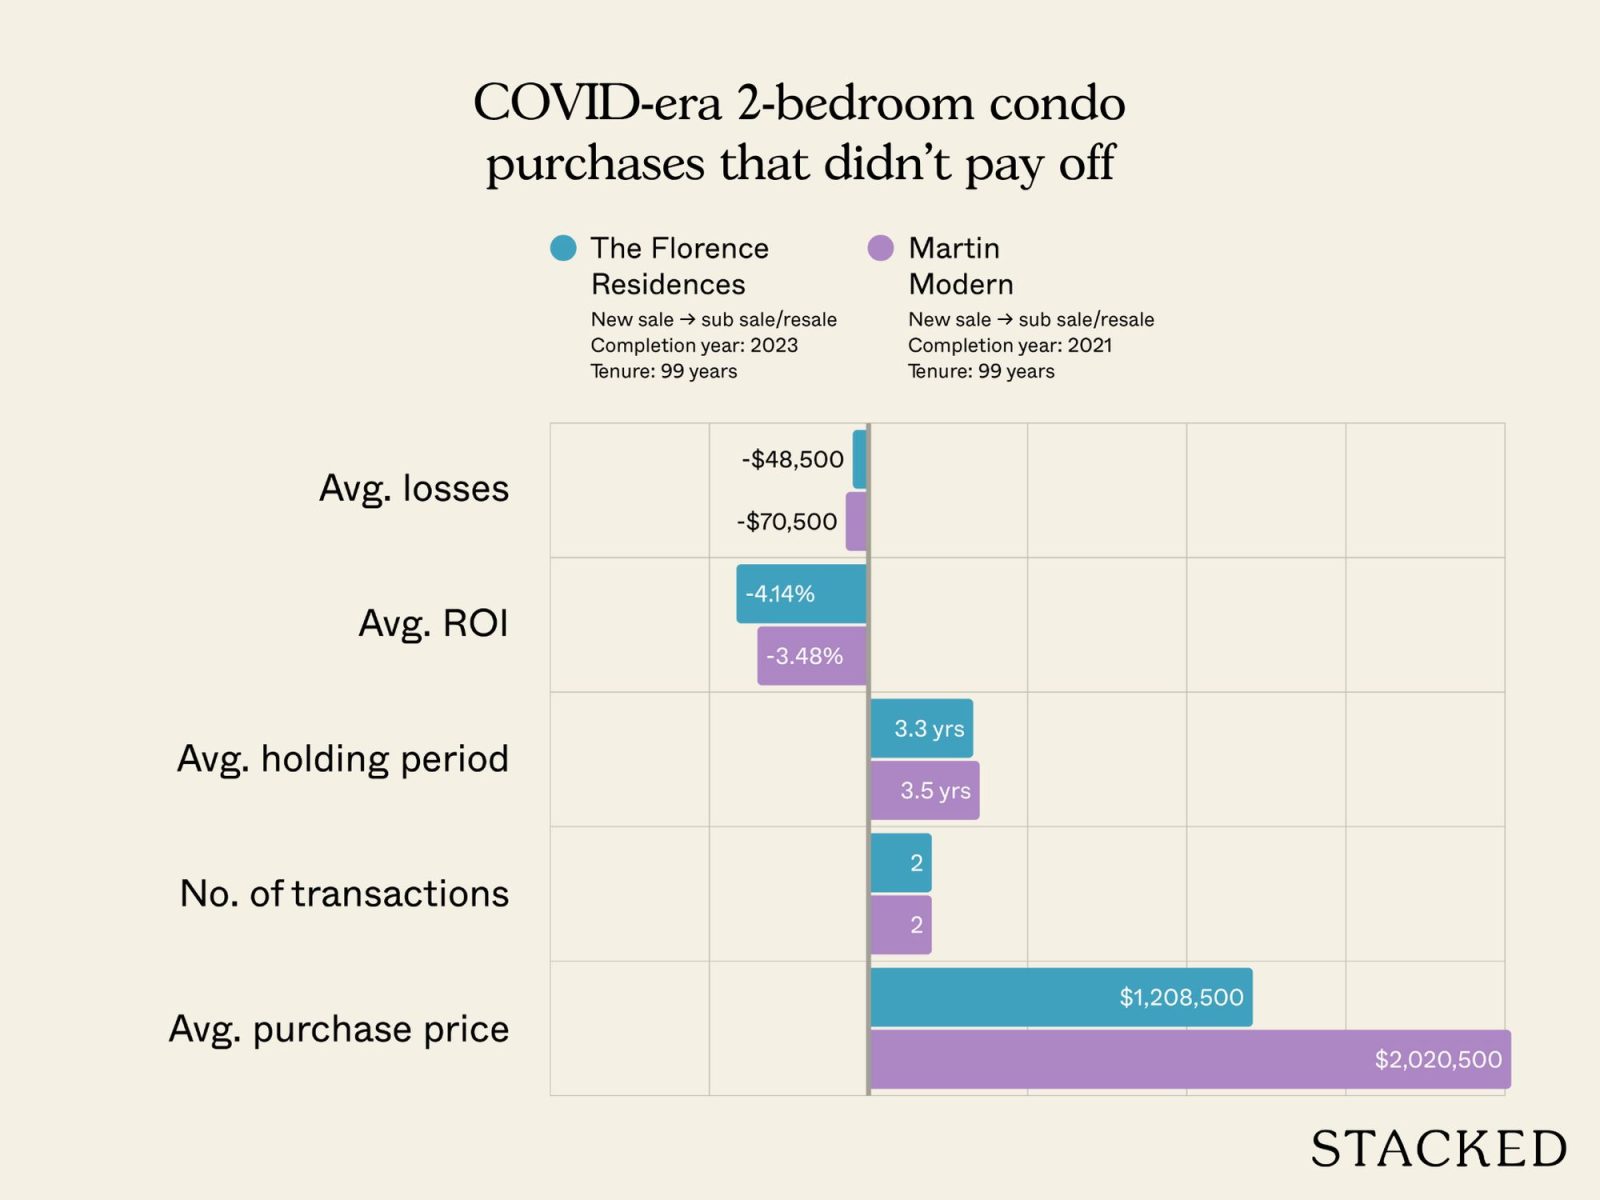
Recent losses were recorded at The Florence Residences and Martin Modern, both with short holding periods of three to four years. Losses were between roughly $48,000 and $70,000. Both developments are well-known projects that were completed recently; in these cases, we’d say the sellers exited too quickly after TOP. In the case of Martin Modern, the seller also bought in 2021 – the Martin Modern buyers who made their purchase in 2017 (a down market) mostly saw gains instead.
They do demonstrate, however, that higher entry prices make holding power even more important. Some realtors also opined that launches in recent years, following the completion of Martin Modern and The Florence Residences, have released a higher supply of two-bedders or compact three-bedders (2+ Study units).
This potentially provided new launch alternatives – some still with developer discounts – at the same time the Martin Modern and Florence Residences were trying to sell.
3-bedroom units
Sub sale/resale to resale
| Project | Average losses | Average ROI | Average holding period (years) | No. of transactions | Average purchase price | Completion year | Tenure |
| MARINA ONE RESIDENCES | -$405,362 | -9.87% | 3.0 | 2 | $4,138,893 | 2017 | 99 yrs |
| REFLECTIONS AT KEPPEL BAY | -$181,532 | -6.38% | 3.3 | 3 | $2,819,203 | 2011 | 99 yrs |
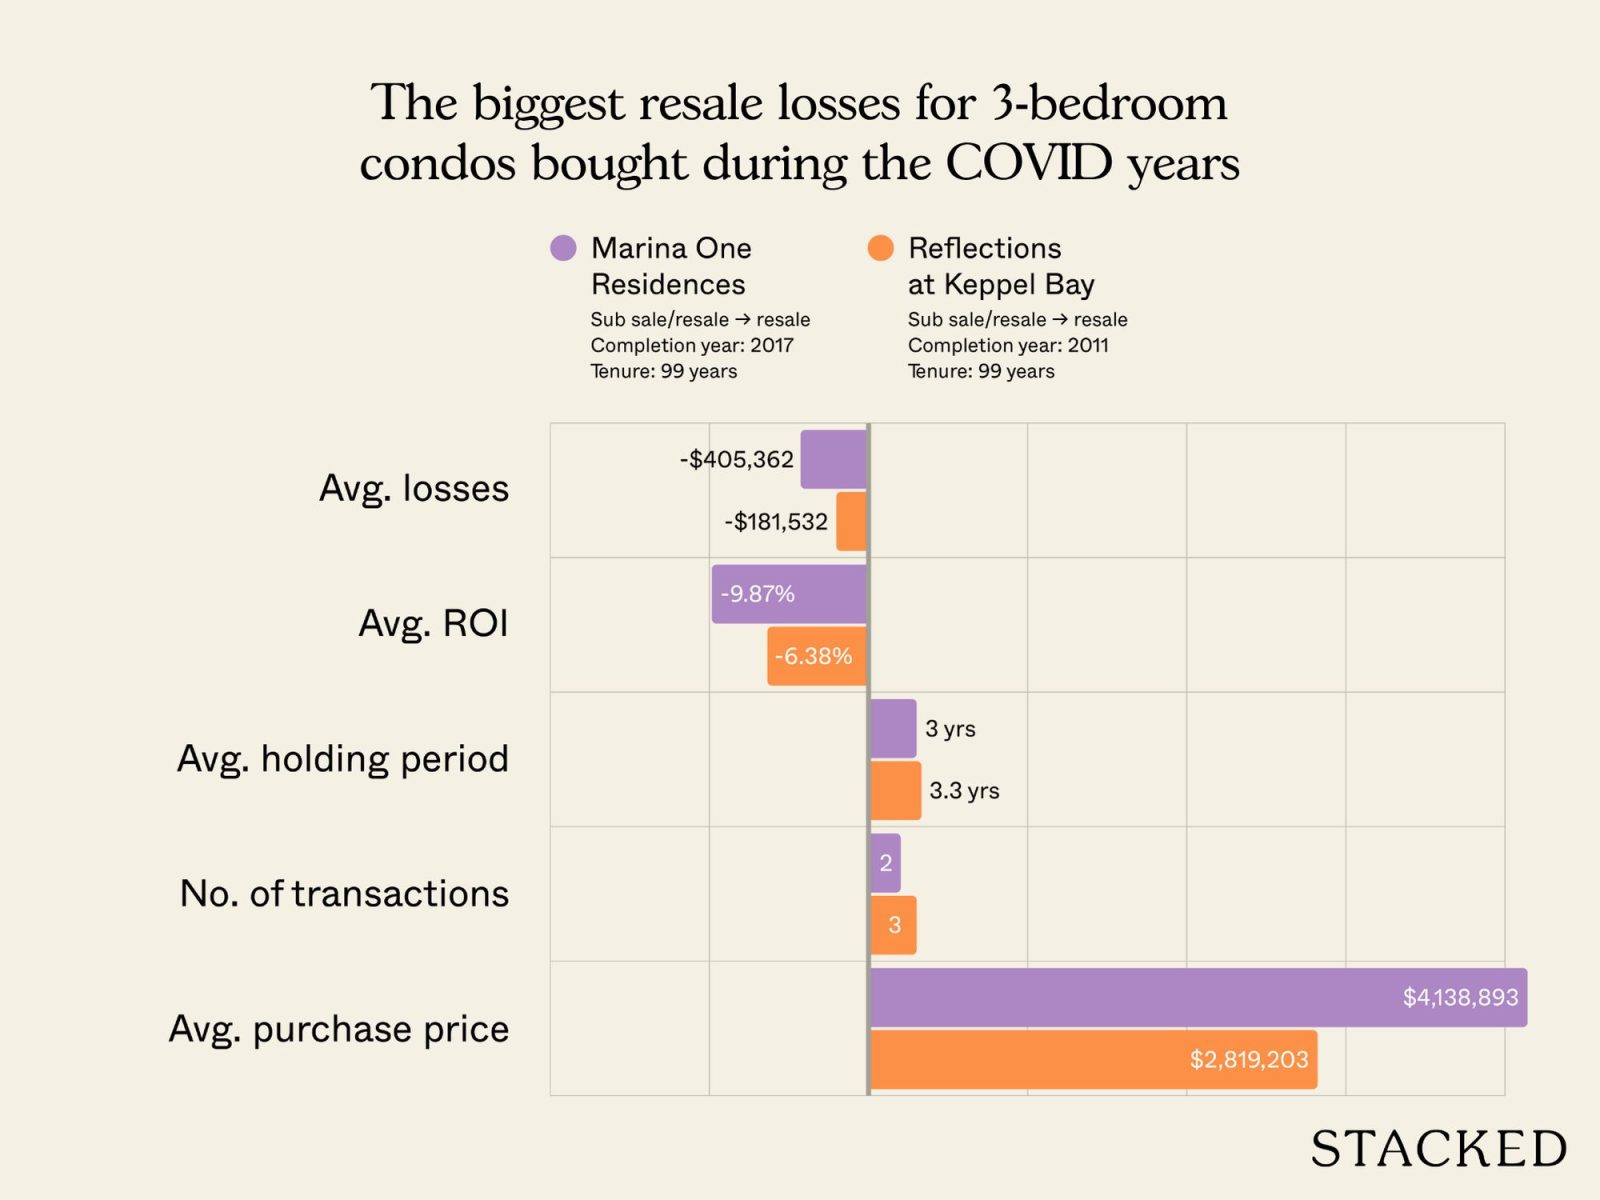
Marina One Residences and Reflections at Keppel Bay are high-quantum, luxury projects. So by now the pattern is familiar: resale gains are especially impacted when the entry price is high and the holding period is too short. There’s nothing much new to learn here.
Four-bedroom units
New sale to sub sale/resale
| Project | Average losses | Average ROI | Average holding period (years) | No. of transactions | Average purchase price | Completion year | Tenure |
| BUKIT 828 | -$92,000 | -4.64% | 1.6 | 1 | $1,982,000 | 2022 | Freehold |
| REZI 24 | -$62,900 | -3.41% | 4.0 | 1 | $1,842,900 | 2023 | Freehold |
Sub sale/resale to resale
| Project | Average losses | Average ROI | Average holding period (years) | No. of transactions | Average purchase price | Completion year | |
| GRAMERCY PARK* | -$1,550,000 | -17.13% | 3.1 | 1 | $9,050,000 | 2016 | Freehold |
| MARINA ONE RESIDENCES | -$562,000 | -8.83% | 1.5 | 1 | $6,362,000 | 2017 | 99-years |
| NOUVEL 18 | -$548,000 | -6.81% | 1.5 | 1 | $8,048,000 | 2014 | Freehold |
| SKYLINE 360 @ SAINT THOMAS WALK | -$150,000 | -3.16% | 0.5 | 1 | $4,750,000 | 2012 | Freehold |
| HORIZON TOWERS | -$50,000 | -1.39% | 3.2 | 1 | $3,600,000 | 1984 | 99-years |
*Gramercy Park had four units involved in a money-laundering scandal, and we can’t ascertain if this is one of the specific units involved. Note that procedures such as forced liquidation can account for losses.
New sale to resale losses were recorded for Bukit 828 and Rezi 24. These are expectedly volatile though: for Bukit 828, there are only 34 units. This makes transaction volumes very low and unpredictable, so we can’t consider the loss to be representative of much. As for Rezi 24, it’s in a bit of a stigmatised area, as Geylang Lorong 24 is considered too close to the vice areas for some buyers.
The resale losses list is led by Gramercy Park, Marina One Residences, and Nouvel 18, with smaller declines at Skyline 360 and Horizon Towers.
A special note on Gramercy Park
Four units at Gramercy Park were involved in a money laundering case. One of the sold units (reportedly a 13th-floor unit) belonged to Su Baolin, a notable figure in a $3 billion money laundering incident. The other three units were also owned by individuals who had ties to the case.
We’ve also heard from realtors that these original buyers lost the units, which were later up for sale. We can’t verify completely that these losing transactions were the involved units, but there is a chance that they may be. If so, the losses aren’t really due to any fundamental issues with the project, but the legal circumstances.
Overall takeaways
Looking across all unit types, a few common threads stand out. First, short holding periods are common throughout: many of these transactions happened within three to four years, often just as the projects were completing. That’s too soon for appreciation to outweigh upfront costs.
Also note that buying close to the TOP date usually means buying at the highest developer price; couple that with a shorter holding period, and you can see why it makes losses more common.
Second, high-quantum units tend to suffer the worst absolute losses. Whether it’s one-bedders in Wallich Residence, two-bedders in 8 Saint Thomas, or four-bedders in Gramercy Park, the pattern is the same: the higher the entry price, the thinner the resale market. When a distressed or urgent sale occurs, the loss can be magnified in both percentage and absolute terms.
Third, boutique or low-volume projects tend to show up more often. They only have a handful of transactions, but that in itself is the explainer: when you buy into a boutique project, you need to brace for less predictable outcomes.
In short, the post-COVID boom tended to punish flippers. Owners who held through 2022 to 2024, when housing shortages peaked, generally saw strong gains. Those who sold too quickly, or bought at the wrong quantum, missed this important wave.
At Stacked, we like to look beyond the headlines and surface-level numbers, and focus on how things play out in the real world.
If you’d like to discuss how this applies to your own circumstances, you can reach out for a one-to-one consultation here.
And if you simply have a question or want to share a thought, feel free to write to us at stories@stackedhomes.com — we read every message.


0 Comments