

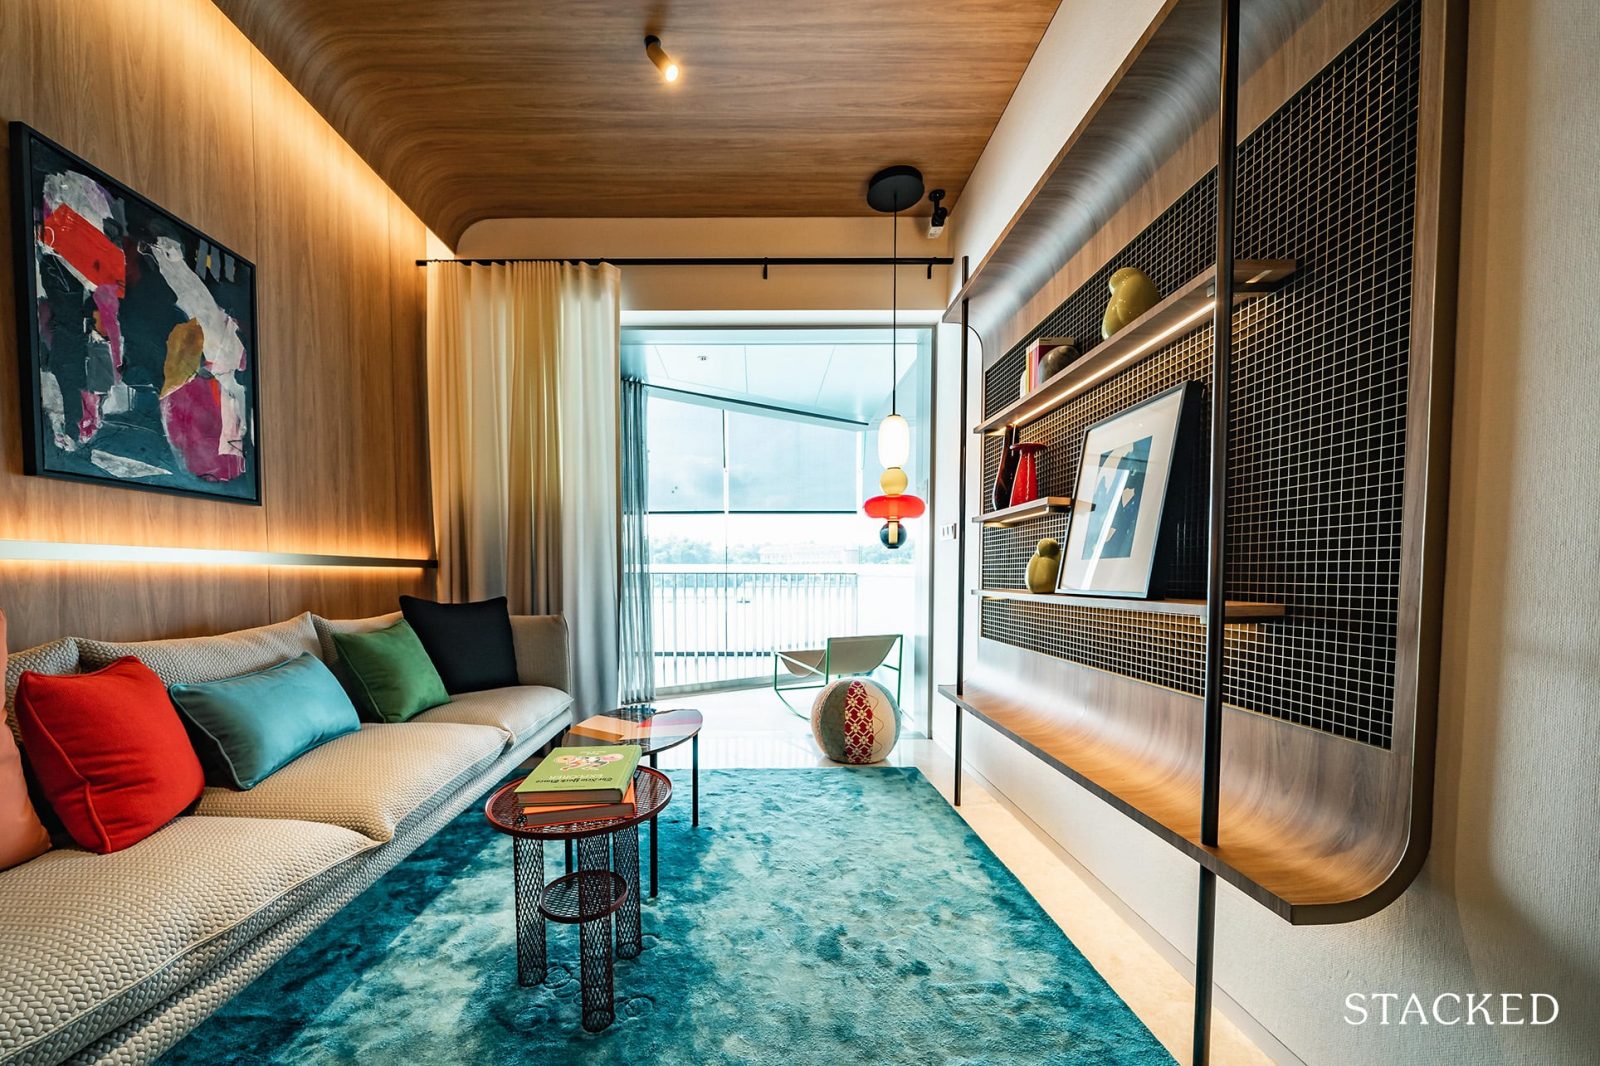
Over the past couple of years, 2 bedroom units have almost become the default choice among investors. The rationale is simple: big enough to accommodate a roommate or small families, but still at a low enough quantum, these are among the fastest sellers at any launch. Well, since we've already done a study on 1 bedroom units, it was about time to look at its bigger neighbour. So, are 2 bedroom units a good investment? And if so, which districts have seen the best yields or gains? Here’s a rundown of what you could expect:
The challenge for many buyers today isn't access to information.
It's interpreting that information in a way that makes sense for their finances, goals, and stage of life.
Over time, that's also why we decided to work with agents who shared the same data-driven and advisory-led approach behind our editorial, consultants who could help readers think through decisions more objectively, rather than simply push transactions.
Today, the team has worked with more than 2,000 clients across over $5B in property transactions.
How did we get the data below?
The data below is based on recorded URA transactions. We have kept the comparison to condos built from 2010 onward, because the definition of a “two-bedder” is quite different before that (e.g., in the 1990’s, even 1,000+ sq. ft. units were sometimes categorized as two-bedders). Executive Condominiums (ECs) were excluded.
We have also kept to units that are from 600 to 850 sq. ft. Developers can be quite loose with what defines a two-bedder. For example, some might be willing to market an 800 sq. ft. unit as a three-bedder. As much as we'd like to have a perfect data set, there will be some stragglers that we have not accounted for.
For rental data, we looked at the time period between January to end-July 2021. We rounded down the unit size, and matched it to the lower range of the rental data (e.g., a 650 sq. ft. unit is rounded down to 600 sq. ft., and matched to the 600 – 700 sq. ft. rental data of the development).
Common sales pitches and theories surrounding 2 bedroom units
It’s common advice for landlords to buy 2 bedroom units if they can, rather than one-bedders.
The rationale is that 2 bedrooms can accommodate a wider pool of tenants. For example, it allows for a tenant to take on a roommate to split the costs, which can sometimes make it more affordable than a one-bedder. Likewise, some of the bigger two-bedders (700 sq. ft. or more) can accommodate a couple plus a young child, whereas a one-bedder is quite restrictive.
In terms of resale gains, the same logic applies. It’s assumed that the only buyers interested in one-bedders are other investors (who may prefer new launches with developer discounts). As such, a 2 bedroom unit could draw more prospective buyers.
While two-bedders have a higher price psf on average, they tend to have a lower overall quantum. This should – on paper – result in superior rental yields compared to their family-sized counterparts.
Here’s how the theories bear up:
What is the typical gross rental yield you can expect?
The gross rental yield is ((annual rental income / total cost of unit) x 100)
| Size Range | Yield |
| 600 - 699 sqft | 3.15% |
| 700 - 799 sqft | 2.98% |
| 800 - 850 sqft | 2.98% |
| Grand Total | 3.04% |
Unsurprisingly, the smallest units have the highest yield, as they also have the lowest quantum. However, it’s interesting to note that between 700 to 850 sq. ft., there appears to be little difference in terms of gross yield.
This suggests buyers can consider larger units, if the options are 700 sq. ft. or over; the bigger units tend to have higher rentability and are easier to resell, but don’t appear to have a drag on the yield.
Overall, we found that 2 bedroom units are on the high end of the typical residential condo yields today (the average, across the board, is between two to three per cent).
However, contrary to some sales pitches, they do not match their shoebox counterparts, which can have gross yields of between four to five per cent.
What are the returns you can expect, based on unit size?
| Size Category | No. of Breakeven | No. of Losses | Average % Loss | Average Quantum Loss | No. of Profitable | Average % Profit | Average Quantum Profit | Total Tnx | Proportion Gains |
| 600 - 699 sqft | 24 | 337 | -7.4% | -$78,592.8 | 1031 | 10.8% | $88,140.6 | 1392 | 74.1% |
| 700 - 799 sqft | 15 | 237 | -6.2% | -$74,379.2 | 1240 | 11.8% | $99,021.4 | 1492 | 83.1% |
| 800 - 850 sqft | 5 | 104 | -7.6% | -$94,540.0 | 390 | 9.5% | $94,824.0 | 499 | 78.2% |
Across all sizes, there were more profitable than unprofitable transactions. However, units that were in the 700+ sq. ft. range saw the highest ratio of profitable to unprofitable transactions.
Units in the 700+ sq. ft. range also saw the lowest losses on average (down six per cent for unprofitable transactions), and the highest gains (up 11 per cent for profitable transactions).
That being said, do note that transaction volumes play a part. For the largest units of 800 to 850 sq. ft., there were fewer overall transactions; so this could make them come off looking worse.
What returns can you expect, based on district?
| District | No. of Breakeven | No. of Losses | Average % Loss | Average Quantum Loss | No. of Profitable | Average % Profit | Average Quantum Profit |
| 1 | 14 | -10.2% | -$176,950 | 9 | 8.0% | $122,869 | |
| 2 | 23 | -8.0% | -$120,443 | 35 | 6.6% | $85,014 | |
| 3 | 2 | 15 | -4.8% | -$60,119 | 95 | 12.9% | $151,099 |
| 4 | 1 | 16 | -6.6% | -$97,405 | 19 | 6.6% | $87,879 |
| 5 | 4 | 25 | -7.9% | -$93,243 | 62 | 9.7% | $88,494 |
| 7 | 7 | -6.9% | -$93,837 | 20 | 10.9% | $136,604 | |
| 8 | 18 | -12.3% | -$119,783 | 9 | 9.0% | $73,354 | |
| 9 | 5 | 42 | -12.8% | -$199,388 | 16 | 9.1% | $110,823 |
| 10 | 29 | -8.0% | -$111,546 | 57 | 8.5% | $88,872 | |
| 11 | 1 | 24 | -10.4% | -$140,764 | 18 | 7.0% | $72,854 |
| 12 | 5 | 44 | -7.1% | -$69,741 | 162 | 9.3% | $88,950 |
| 13 | 1 | 16 | -7.4% | -$89,025 | 84 | 10.3% | $107,746 |
| 14 | 3 | 28 | -6.3% | -$55,977 | 144 | 10.5% | $88,234 |
| 15 | 3 | 52 | -7.0% | -$75,015 | 132 | 9.4% | $98,683 |
| 16 | 35 | -8.5% | -$82,014 | 111 | 8.7% | $72,718 | |
| 17 | 22 | -3.8% | -$29,266 | 131 | 9.3% | $61,201 | |
| 18 | 32 | -5.9% | -$50,322 | 307 | 14.1% | $100,349 | |
| 19 | 11 | 86 | -4.2% | -$40,031 | 578 | 11.4% | $93,356 |
| 20 | 1 | 6 | -6.7% | -$77,087 | 120 | 15.8% | $157,045 |
| 21 | 4 | 8 | -7.0% | -$63,961 | 7 | 6.4% | $61,099 |
| 22 | 4 | -2.8% | -$28,250 | 45 | 9.6% | $96,405 | |
| 23 | 3 | 87 | -5.7% | -$54,734 | 159 | 8.3% | $68,998 |
| 25 | 25 | -5.0% | -$35,602 | 67 | 8.0% | $48,717 | |
| 26 | 6 | 3.5% | $29,167 | ||||
| 27 | 13 | -5.8% | -$45,679 | 129 | 12.4% | $88,404 | |
| 28 | 7 | -8.1% | -$67,262 | 139 | 14.5% | $100,955 |
As you move further from the prime region, gains generally outweigh losses
Within the Core Central Region (CCR), there are districts where losses outweigh gains (Districts 1, 9, and 11).
Toward the Rest of Central Region (RCR), gains and losses can be very close. In District 4 (HarbourFront and Sentosa), for example, the average gains and losses are both exactly 6.6 per cent.
However moving closer toward the fringe regions, you can see that RCR districts such as District 14 (Paya Lebar, Geylang) show gains that significantly outweigh losses. Also, District 20 (Thomson, Bishan) stands out the most, with the highest gains at 15.8 per cent, compared to average losses of just 6.7 per cent.
In the Outside of Central Region (OCR) however, average losses hover at about six to seven percent, while average gains often reach nine per cent. District 18 (Tampines), for example, has average gains of 14.1 per cent, with average losses of just 5.9 per cent.

Why are the prime districts seemingly worse off?
Districts with more unprofitable transactions mostly came from the CCR. These were Districts 1 (Marina, Raffles), 9 (Orchard), and 11 (Newton, Bukit Timah).
This is likely due to high premiums in these areas, where many of the developments are also freehold – this would place them at prices 15 to 20 per cent higher than leasehold counterparts. As the developments only date back to 2010, this can be insufficient time for the benefits of freehold status to really show, in the resale price (more on this below).
It could also come down to the foreign demand in these prime areas, where the past few years have not been as popular as before.
That said, CCR districts are not alone in producing more unprofitable transactions. District 8 (Little India, Farrer Park) has also seen more losers than winners, and District 21 (Clementi, Upper Bukit Timah) narrowly falls into this group, with one more losing than winning transaction.
Should you pick a leasehold or freehold two-bedder?
| Tenure | No. of Breakeven | No. of Losses | Average % Loss | Average Quantum Loss | No. of Profitable | Average % Profit | Average Quantum Profit |
| Freehold | 18 | 260 | -8.2% | -$98,337 | 416 | 8.7% | $84,333 |
| Leasehold (60-yr)* | 6 | -6.3% | -$47,953 | 3 | 8.3% | $55,573 | |
| Leasehold (900+ years) | 2 | 23 | -5.9% | -$57,209 | 46 | 7.2% | $61,072 |
| Leasehold (99-yr/103-yr) | 24 | 389 | -6.3% | -$68,738 | 2196 | 11.6% | $96,804 |
| Grand Total | 44 | 678 | -7.0% | -$79,545 | 2661 | 11.0% | $94,190 |
As is generally the case with a 10-year time frame, we tend to see leasehold properties outperforming freehold ones. This may be different as the condos get significantly older, at which point freehold properties will not be faced with financing issues, but leasehold properties will.
(Freehold properties may sometimes also be more attractive in en-bloc terms, as developers won’t have to top up the lease).
As an aside, remember that tenants often don’t care about the remaining lease. A cheap unit with fewer years remaining can still generate comparable rental income, to others in the area. This translates to potentially higher rental yields, for older leasehold developments.
In any case, it’s clear that investors looking at periods of five to 10 years should mainly focus on leasehold options. The premium for 999-year leases, or freehold status, isn’t well justified unless you’re looking much further down the road.
How long should you keep your two-bedder?
| Holding Period | No. of Breakeven | No. of Losses | Average % Loss | Average Quantum Loss | No. of Profitable | Average % Profit | Average Quantum Profit | Total Tnx | Proportion Gains |
| < 3 Years | 28 | 32 | -8.4% | -$99,937 | 82 | 8.6% | $79,954 | 142 | 57.7% |
| 3 - 5 years | 5 | 140 | -7.1% | -$78,081 | 914 | 12.6% | $108,990 | 1059 | 86.3% |
| More than 5 Years) | 11 | 506 | -6.9% | -$78,657 | 1665 | 10.3% | $86,768 | 2182 | 76.3% |
Those who sell within the first three years are more likely to take a hit, and see lower gains. This will come as no surprise, as many of these are also urgent sales (perhaps from some kind of crisis).
Interestingly, those who sold within three to five years saw the highest proportion of gains. We’re not sure why; some realtors we asked surmised that, if any units were sold in 2018 or just after, gains may have been lower due to harsher cooling measures.
This seems reasonable, although there isn’t a conclusive way to prove it.
Overall, we can say most 2 bedroom units have performed “as advertised”, with one reservation: it’s a stretch to call the rental yield “almost the same” or “close” to shoebox units, which average around four to five per cent.
Nonetheless, with the preference swinging toward larger units, and their still affordable quantum, a two-bedder is a good starting point for new investors. The key seems to be lower quantum, leasehold units, in high rentability RCR and OCR areas.
For more updates on the Singapore private property market, follow us on Stacked. You can also check out in-depth reviews of new and resale condos alike.
At Stacked, we like to look beyond the headlines and surface-level numbers, and focus on how things play out in the real world.
If you'd like to discuss how this applies to your own circumstances, you can reach out for a one-to-one consultation here.
And if you simply have a question or want to share a thought, feel free to write to us at stories@stackedhomes.com. We read every message.





0 Comments