

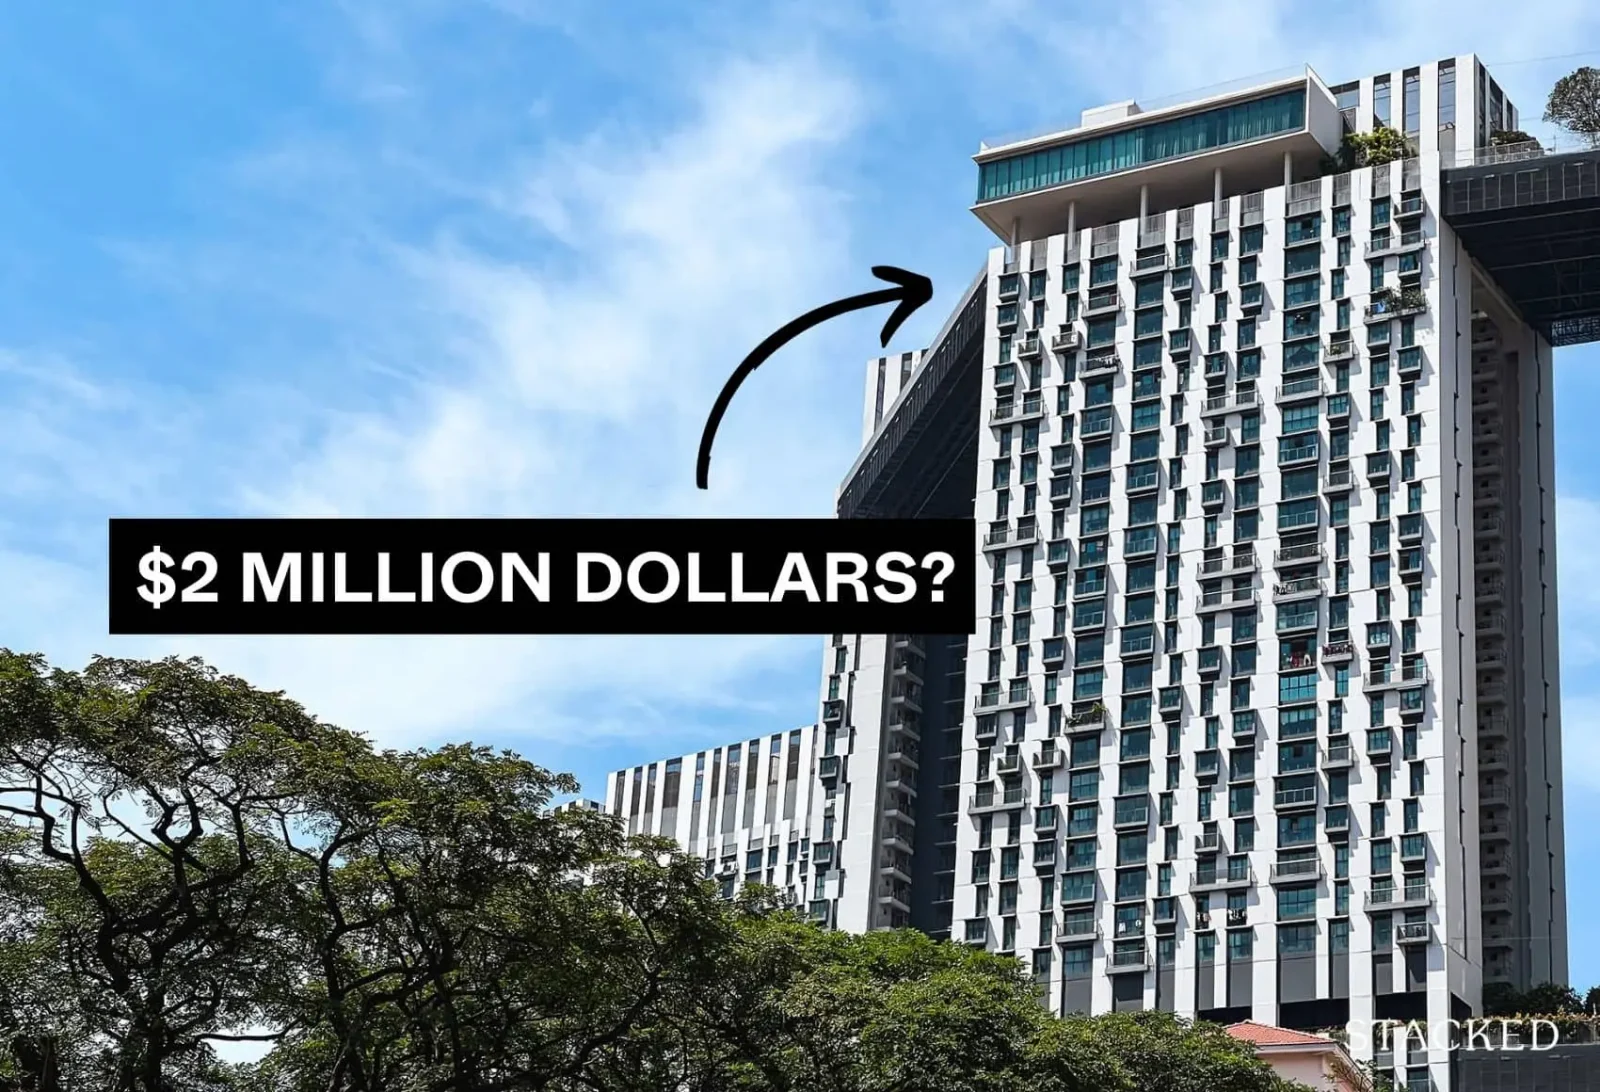
I remember the first time we hit a million dollars for an HDB flat (this was an Executive HDB at Mei Ling Street in 2012). The idea of spending a seven-figure sum on an old resale HDB flat seemed ludicrous to many at the time, with some experts even deeming million-dollar HDB flats an unlikely phenomenon.
Fast-forward to the present day, the past three years have rewritten the narrative with an influx of million-dollar HDB flats hitting the market. As of the end of October 2023, we’ve witnessed 369 transactions of this nature, matching last year’s total and positioning us on the cusp of setting a new record. This surge in high-value transactions brings forth an intriguing question: at this current pace, how long will it be before we see HDB flats reaching the $2 million mark?
An important point to note
This is not a statement that resale HDB flats are going to reach $2 million, nor is it a guaranteed timeline of any sort. It’s a hypothetical question that doesn’t take into account certain factors like government intervention (for example, if there's a possibility of an HDB oversupply in the future); we have no doubt that HDB impose restrictions, or take whatever actions become necessary if need be.
(And then, there are potential black swan issues like another pandemic or a major war. Touch wood!)
One of the factors is also going to be lease decay: many of the priciest flats today are also among the oldest (e.g., in towns like Queenstown, Tiong Bahru, and Marine Parade). These may not keep climbing in value, once they reach a certain point in their lease.
Also, we are aware that predicting property market prices is a complex task involving advanced statistical and modelling techniques that are very time-consuming. However, such methods aren't foolproof either as external shocks are very unpredictable (such as COVID-19). People have attempted this, but there's no method that accurately predicts prices over and over again in a repeated manner. If they could tell the future accurately, well, they'd be billionaires.
So with that out of the way, let's start off by looking at HDB prices over the years!
A look at HDB prices over the years
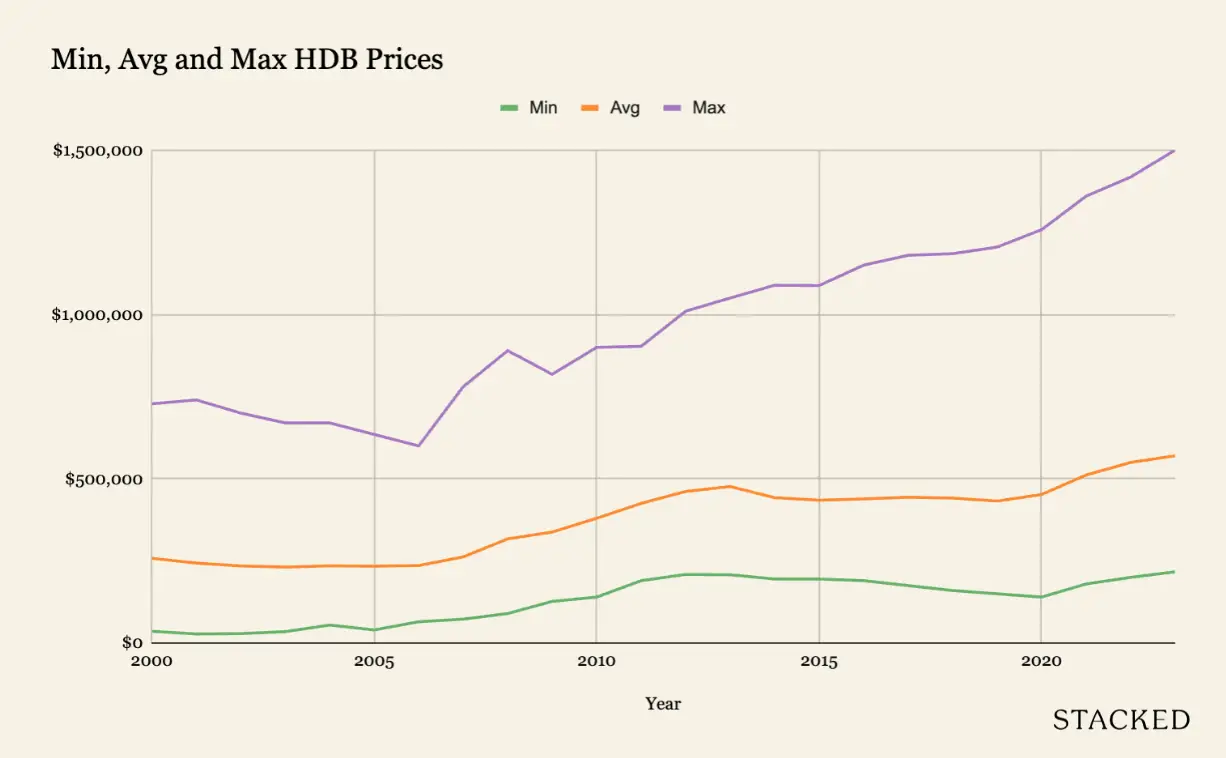
| Year | Min | Avg | Max |
| 2000 | $36,000 | $258,057 | $728,000 |
| 2001 | $28,000 | $243,470 | $740,000 |
| 2002 | $29,000 | $234,834 | $700,000 |
| 2003 | $35,000 | $231,343 | $670,000 |
| 2004 | $55,000 | $235,169 | $670,000 |
| 2005 | $40,000 | $234,165 | $635,000 |
| 2006 | $65,000 | $236,079 | $600,000 |
| 2007 | $73,000 | $262,277 | $780,000 |
| 2008 | $90,000 | $317,142 | $890,000 |
| 2009 | $127,000 | $337,913 | $818,000 |
| 2010 | $140,000 | $379,939 | $900,000 |
| 2011 | $190,000 | $425,382 | $903,000 |
| 2012 | $209,000 | $461,493 | $1,010,000 |
| 2013 | $208,000 | $476,441 | $1,050,000 |
| 2014 | $195,000 | $442,716 | $1,088,888 |
| 2015 | $195,000 | $434,710 | $1,088,000 |
| 2016 | $190,000 | $438,839 | $1,150,000 |
| 2017 | $175,000 | $443,889 | $1,180,000 |
| 2018 | $160,000 | $441,282 | $1,185,000 |
| 2019 | $150,000 | $432,138 | $1,205,000 |
| 2020 | $140,000 | $452,279 | $1,258,000 |
| 2021 | $180,000 | $511,376 | $1,360,000 |
| 2022 | $200,000 | $549,715 | $1,418,000 |
| 2023 | $217,000 | $570,144 | $1,500,000 |
At first glance, it looks as if the price disparity between the most expensive flats, versus the average, is increasing. However, let’s look at the actual percentage difference between the maximum and average prices:
| Year | Avg | Max | % Difference |
| 2000 | $258,057 | $728,000 | 182.1% |
| 2001 | $243,470 | $740,000 | 203.9% |
| 2002 | $234,834 | $700,000 | 198.1% |
| 2003 | $231,343 | $670,000 | 189.6% |
| 2004 | $235,169 | $670,000 | 184.9% |
| 2005 | $234,165 | $635,000 | 171.2% |
| 2006 | $236,079 | $600,000 | 154.2% |
| 2007 | $262,277 | $780,000 | 197.4% |
| 2008 | $317,142 | $890,000 | 180.6% |
| 2009 | $337,913 | $818,000 | 142.1% |
| 2010 | $379,939 | $900,000 | 136.9% |
| 2011 | $425,382 | $903,000 | 112.3% |
| 2012 | $461,493 | $1,010,000 | 118.9% |
| 2013 | $476,441 | $1,050,000 | 120.4% |
| 2014 | $442,716 | $1,088,888 | 146.0% |
| 2015 | $434,710 | $1,088,000 | 150.3% |
| 2016 | $438,839 | $1,150,000 | 162.1% |
| 2017 | $443,889 | $1,180,000 | 165.8% |
| 2018 | $441,282 | $1,185,000 | 168.5% |
| 2019 | $432,138 | $1,205,000 | 178.8% |
| 2020 | $452,279 | $1,258,000 | 178.1% |
| 2021 | $511,376 | $1,360,000 | 165.9% |
| 2022 | $549,715 | $1,418,000 | 158.0% |
| 2023 | $570,144 | $1,500,000 | 163.1% |
| Average | 163.7% |
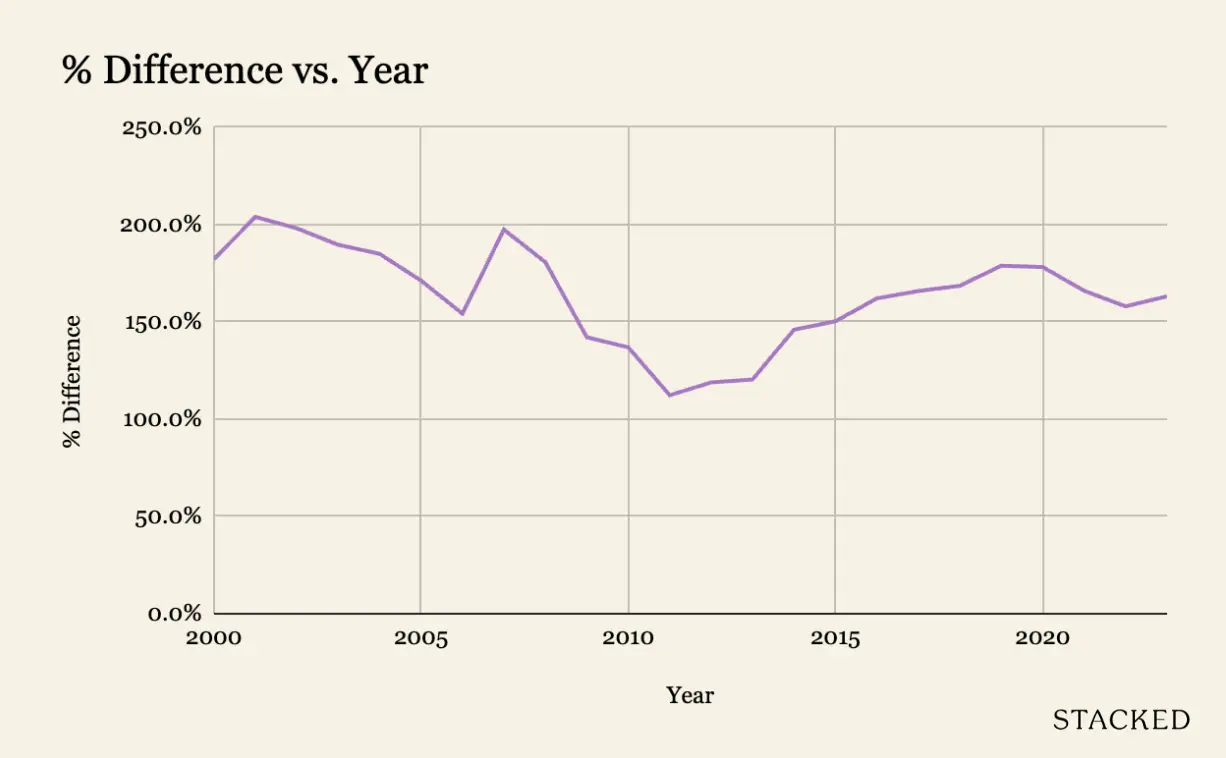
Notice that the price disparity was actually bigger from 2000 to 2008, when the percentage difference was around 180 per cent. But in recent years, the disparity has shrunk. As of today, the average difference is around 163.7%.
So despite the ever-rising quantum of million-dollar flats ($1.5 million in Moh Guan is the record-holder as we write this), the price disparity is actually less than it was in the pre-2009 period.
Next, we’ll use this figure (163.7 per cent) to try and determine when we might see flats reach $2 million, assuming we maintain the current pace:
The challenge for many buyers today isn't access to information.
It's interpreting that information in a way that makes sense for their finances, goals, and stage of life.
Over time, that's also why we decided to work with agents who shared the same data-driven and advisory-led approach behind our editorial, consultants who could help readers think through decisions more objectively, rather than simply push transactions.
Today, the team has worked with more than 2,000 clients across over $5B in property transactions.
Assuming a disparity of 163.7 per cent, it means the average flat price must hit $758,399, for us to see the most expensive flats reach $2 million.
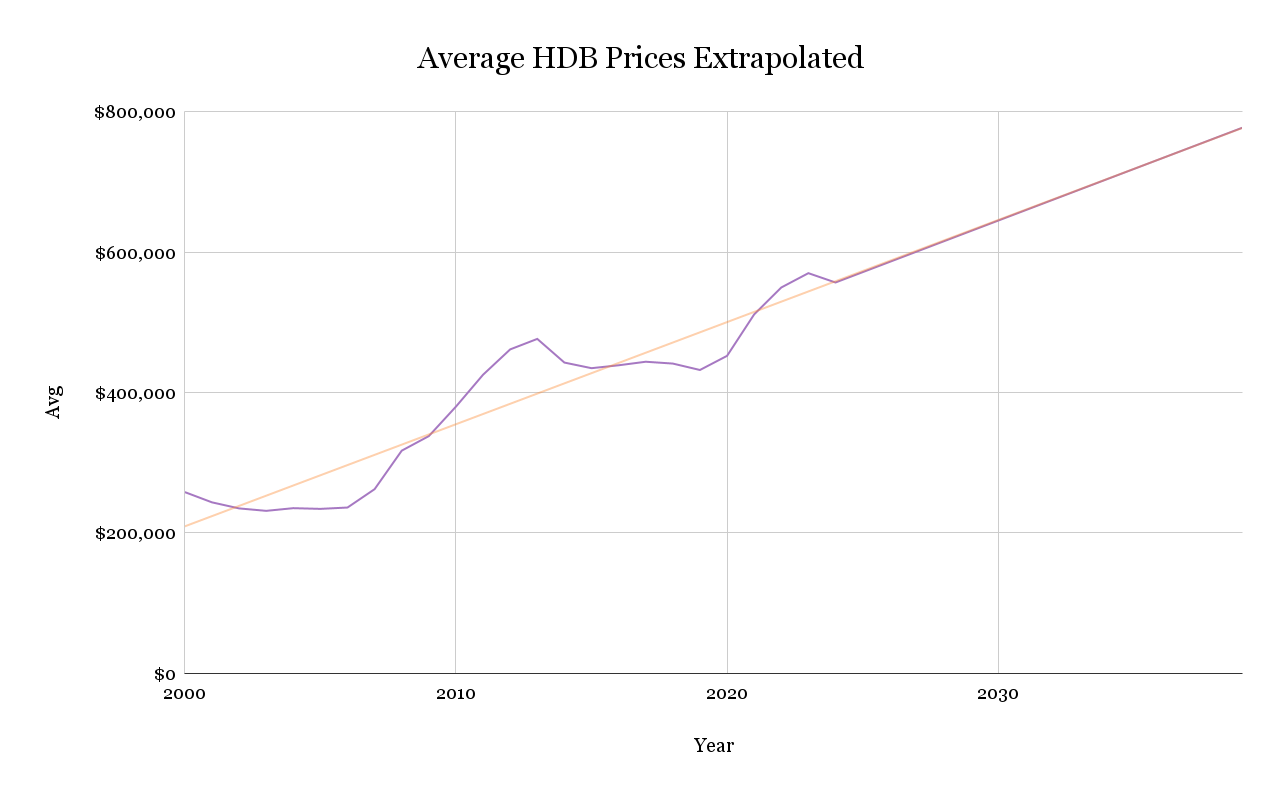
If we assume HDB growth rates remain consistent from the year 2000 onward, here’s how long it may take:
| Year | Avg |
| 2000 | $258,057 |
| 2001 | $243,470 |
| 2002 | $234,834 |
| 2003 | $231,343 |
| 2004 | $235,169 |
| 2005 | $234,165 |
| 2006 | $236,079 |
| 2007 | $262,277 |
| 2008 | $317,142 |
| 2009 | $337,913 |
| 2010 | $379,939 |
| 2011 | $425,382 |
| 2012 | $461,493 |
| 2013 | $476,441 |
| 2014 | $442,716 |
| 2015 | $434,710 |
| 2016 | $438,839 |
| 2017 | $443,889 |
| 2018 | $441,282 |
| 2019 | $432,138 |
| 2020 | $452,279 |
| 2021 | $511,376 |
| 2022 | $549,715 |
| 2023 | $570,144 |
| 2024 | $556,848 |
| 2025 | $571,550 |
| 2026 | $586,252 |
| 2027 | $600,954 |
| 2028 | $615,656 |
| 2029 | $630,358 |
| 2030 | $645,060 |
| 2031 | $659,762 |
| 2032 | $674,464 |
| 2033 | $689,166 |
| 2034 | $703,868 |
| 2035 | $718,570 |
| 2036 | $733,272 |
| 2037 | $747,974 |
| 2038 | $762,676 |
At the current rate we’re going, the average price of an HDB flat might reach the $758,000 mark sometime in 15 years (the year 2038). When that happens, we might also see the first $2 million flats.
What if we base it on resident population growth?
A higher resident population means more demand, and that does weigh on flat prices. So we looked at it from the angle of population growth as well.
Here is the increase in average flat prices, alongside population growth:
| Year | Singapore Residents | Max |
| 2000 | 3273363 | $728,000 |
| 2001 | 3325902 | $740,000 |
| 2002 | 3382944 | $700,000 |
| 2003 | 3366891 | $670,000 |
| 2004 | 3413266 | $670,000 |
| 2005 | 3467814 | $635,000 |
| 2006 | 3525894 | $600,000 |
| 2007 | 3583082 | $780,000 |
| 2008 | 3642659 | $890,000 |
| 2009 | 3733876 | $818,000 |
| 2010 | 3771721 | $900,000 |
| 2011 | 3789251 | $903,000 |
| 2012 | 3818205 | $1,010,000 |
| 2013 | 3844751 | $1,050,000 |
| 2014 | 3870739 | $1,088,888 |
| 2015 | 3902690 | $1,088,000 |
| 2016 | 3933559 | $1,150,000 |
| 2017 | 3965796 | $1,180,000 |
| 2018 | 3994283 | $1,185,000 |
| 2019 | 4026209 | $1,205,000 |
| 2020 | 4044210 | $1,258,000 |
| 2021 | 3986842 | $1,360,000 |
| 2022 | 4073239 | $1,418,000 |
| 2023 | 4149253 | $1,500,000 |
Now when we first did this, we tried to compare the population growth percentage to the maximum flat prices. This didn’t work out, as the estimated rate was way off when we compared it to the first 10 years. So instead, we compared it to the average flat prices, and then it started to make more sense:
| Year | Singapore Residents | Avg |
| 2000 | 3273363 | $258,057 |
| 2001 | 3325902 | $243,470 |
| 2002 | 3382944 | $234,834 |
| 2003 | 3366891 | $231,343 |
| 2004 | 3413266 | $235,169 |
| 2005 | 3467814 | $234,165 |
| 2006 | 3525894 | $236,079 |
| 2007 | 3583082 | $262,277 |
| 2008 | 3642659 | $317,142 |
| 2009 | 3733876 | $337,913 |
| 2010 | 3771721 | $379,939 |
| 2011 | 3789251 | $425,382 |
| 2012 | 3818205 | $461,493 |
| 2013 | 3844751 | $476,441 |
| 2014 | 3870739 | $442,716 |
| 2015 | 3902690 | $434,710 |
| 2016 | 3933559 | $438,839 |
| 2017 | 3965796 | $443,889 |
| 2018 | 3994283 | $441,282 |
| 2019 | 4026209 | $432,138 |
| 2020 | 4044210 | $452,279 |
| 2021 | 3986842 | $511,376 |
| 2022 | 4073239 | $549,715 |
| 2023 | 4149253 | $570,144 |
We can see that, when the population increased by 15.2 per cent between 2000 to 2010, average flat prices went up by 47.2 per cent. As such, a one per cent increase in population might result in an increase of 3.1 per cent in average prices.
Based on this assumption, flat prices in the year 2020 should have seen a 22.4 per cent growth rate, based on the 7.2 per cent increase in population. Checking against the numbers, we can see that we’re fairly close: we’re off by around $13,000 for the average price at the time (we’re off by just around a difference of 2.8 per cent).
If you consider this to be close enough, we can use it to guess when the most expensive flats might reach $2 million. This means we’d need a 10.65 per cent increase in resident population (a resident population of around 4,591,148 people), to hit an average flat price of $758,399. Only then might we see the first $2 million flats start to appear.
But when is this likely to happen?
If we go by the disparity between average and maximum prices, as well as population growth, the likely time seems to be around 2034 to 2035.
What if we go by wage increment?
Most of us would assume wages and home prices are tied, as housing affordability is a perennial issue. So we looked at how HDB prices have risen along with wages, to try and determine when flats might reach $2 million:
Median wage increases over the years:
| Year | Median (50th Percentile) | HDB Max Price |
| 2001 | $2,387 | $728,000 |
| 2002 | $2,380 | $740,000 |
| 2003 | $2,410 | $700,000 |
| 2004 | $2,326 | $670,000 |
| 2006 | $2,449 | $600,000 |
| 2007 | $2,543 | $780,000 |
| 2008 | $2,897 | $890,000 |
| 2009 | $2,927 | $818,000 |
| 2010 | $3,000 | $900,000 |
| 2011 | $3,249 | $903,000 |
| 2012 | $3,480 | $1,010,000 |
| 2013 | $3,705 | $1,050,000 |
| 2014 | $3,770 | $1,088,888 |
| 2015 | $3,949 | $1,088,000 |
| 2016 | $4,056 | $1,150,000 |
| 2017 | $4,232 | $1,180,000 |
| 2018 | $4,437 | $1,185,000 |
| 2019 | $4,563 | $1,205,000 |
| 2020 | $4,534 | $1,258,000 |
| 2021 | $4,680 | $1,360,000 |
| 2022 | $5,070 | $1,418,000 |
| 2023 | $4,993 | $1,396,464 |
| 2024 | $5,129 | $1,434,501 |
| 2025 | $5,265 | $1,472,538 |
| 2026 | $5,401 | $1,510,576 |
| 2027 | $5,537 | $1,548,613 |
| 2028 | $5,673 | $1,586,650 |
| 2029 | $5,809 | $1,624,687 |
| 2030 | $5,945 | $1,662,724 |
| 2031 | $6,081 | $1,700,761 |
| 2032 | $6,217 | $1,738,798 |
| 2033 | $6,353 | $1,776,835 |
| 2034 | $6,489 | $1,814,872 |
| 2035 | $6,625 | $1,852,909 |
| 2036 | $6,761 | $1,890,946 |
| 2037 | $6,897 | $1,928,983 |
| 2038 | $7,033 | $1,967,021 |
| 2039 | $7,169 | $2,005,058 |
Note: Data for 2000 and 2005 is not available, as the Labour Force Survey was not conducted for those two years.
The first thing we notice is that, despite intuitive assumptions about wages and housing affordability, the two don’t always move in tandem. As you can see from above, the HDB price cycle is not as linear as wage growth.
Nonetheless, if you look at the decade between 2001 and 2022, wages grew 112.4 per cent, whilst maximum flat prices grew by 94.78 per cent. Looking at the first 10 years, we can see the increase in maximum prices is not too far off the estimate. We then extrapolate from this, to see when $2 million flats might appear:
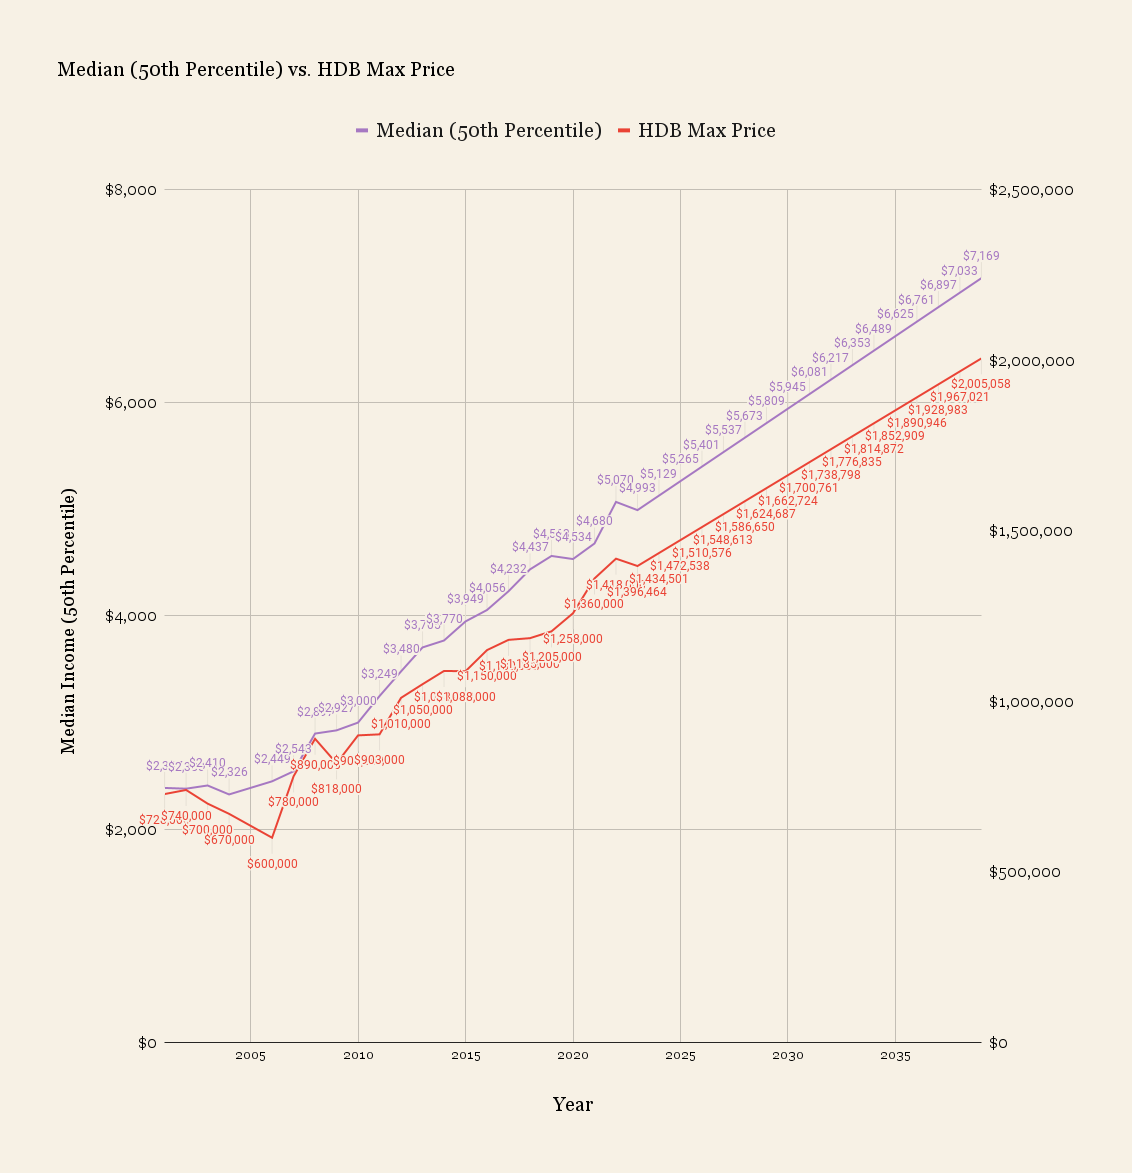
Going by wage increment, we can hazard a guess of around 2039.
The end-conclusion seems to be sometime in the late 2030’s, and before 2040.
As we wrote the article, one thing began to stand out: perhaps we should be more afraid of the rate at which average prices are going up, rather than the maximum prices.
Affluent buyers who can afford maisonettes, DBSS projects, Pinnacle@Duxton, etc. can look after themselves; but the thought of average prices soaring past $700,000 is a worry. 15+ years is not a long time, and it is something the coming generation will have to deal with (in the resale market, that is).
Hopefully, a combination of wage increments, and a healthy supply of new flats, will keep housing affordable.
At Stacked, we like to look beyond the headlines and surface-level numbers, and focus on how things play out in the real world.
If you'd like to discuss how this applies to your own circumstances, you can reach out for a one-to-one consultation here.
And if you simply have a question or want to share a thought, feel free to write to us at stories@stackedhomes.com. We read every message.





0 Comments