

Is it possible to make money from your property, even if you buy it at a peak? We last looked at this among buyers from 2013; but to corroborate it, we also looked at the 2007/8 peak. The results are not what you may expect. In fact, there are revelations here that don’t correspond to what we found in 2013. Regardless, they constitute some key lessons to know about, if you’re buying this year (since 2021 is shaping up to be a possible new peak):
The challenge for many buyers today isn't access to information.
It's interpreting that information in a way that makes sense for their finances, goals, and stage of life.
Over time, that's also why we decided to work with agents who shared the same data-driven and advisory-led approach behind our editorial, consultants who could help readers think through decisions more objectively, rather than simply push transactions.
Today, the team has worked with more than 2,000 clients across over $5B in property transactions.
How did we derive the following data?
The following is based on transactions between Q3 2007 to Q2 2008.
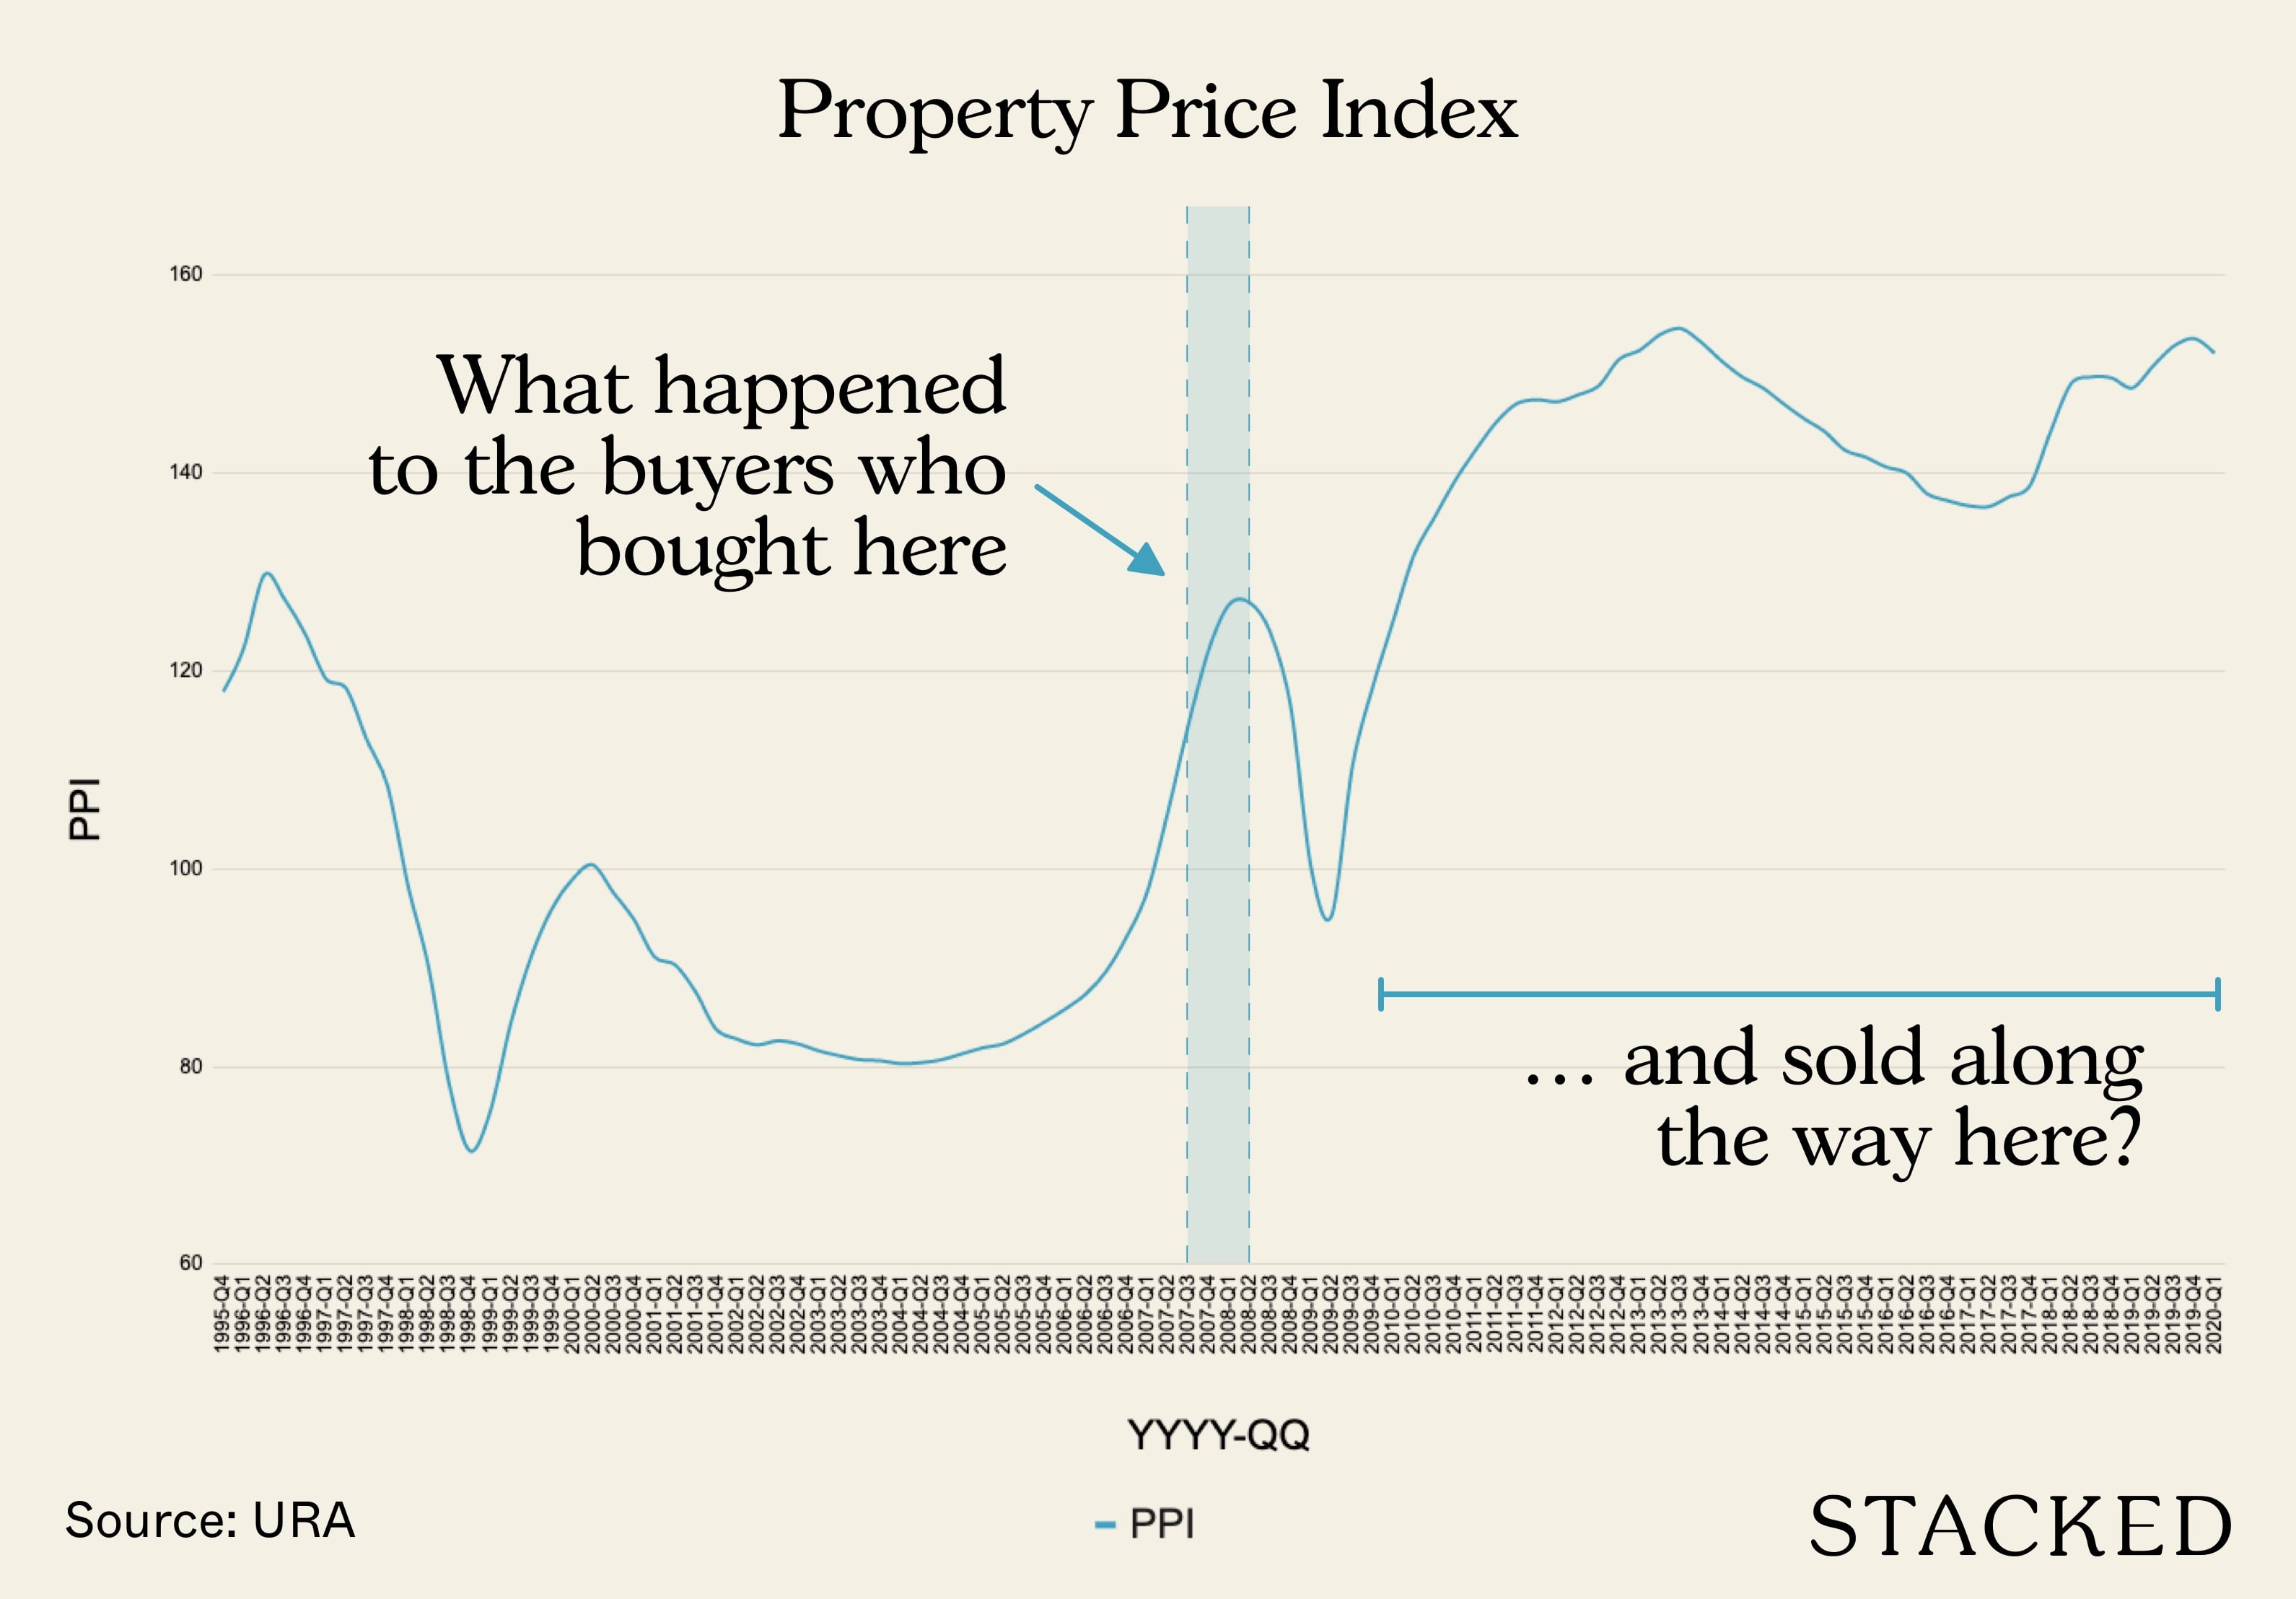
This was the peak of the cycle at the time. We compared the transactions during this period, to their subsequent transaction.
For each of the units, we used only the last transaction during the property peak (e.g. of a property was bought and sold between Q3 2007 and Q3 2008, we only tracked the sold transaction in this time frame, to determine profit or loss up till July 2021.
We have excluded any properties that were held for less than three years (this avoids distortions from special-case sales). And well, also to mimic the current Seller Stamp Duty (SSD) environment. However, we have not made exclusions based on sale types – so the following also includes new sales, resale, or even sub-sale to sub-sale transactions (as long as they are three or more years apart). In total, there were 2,480 transactions in this period, after exclusions.
Overall findings:
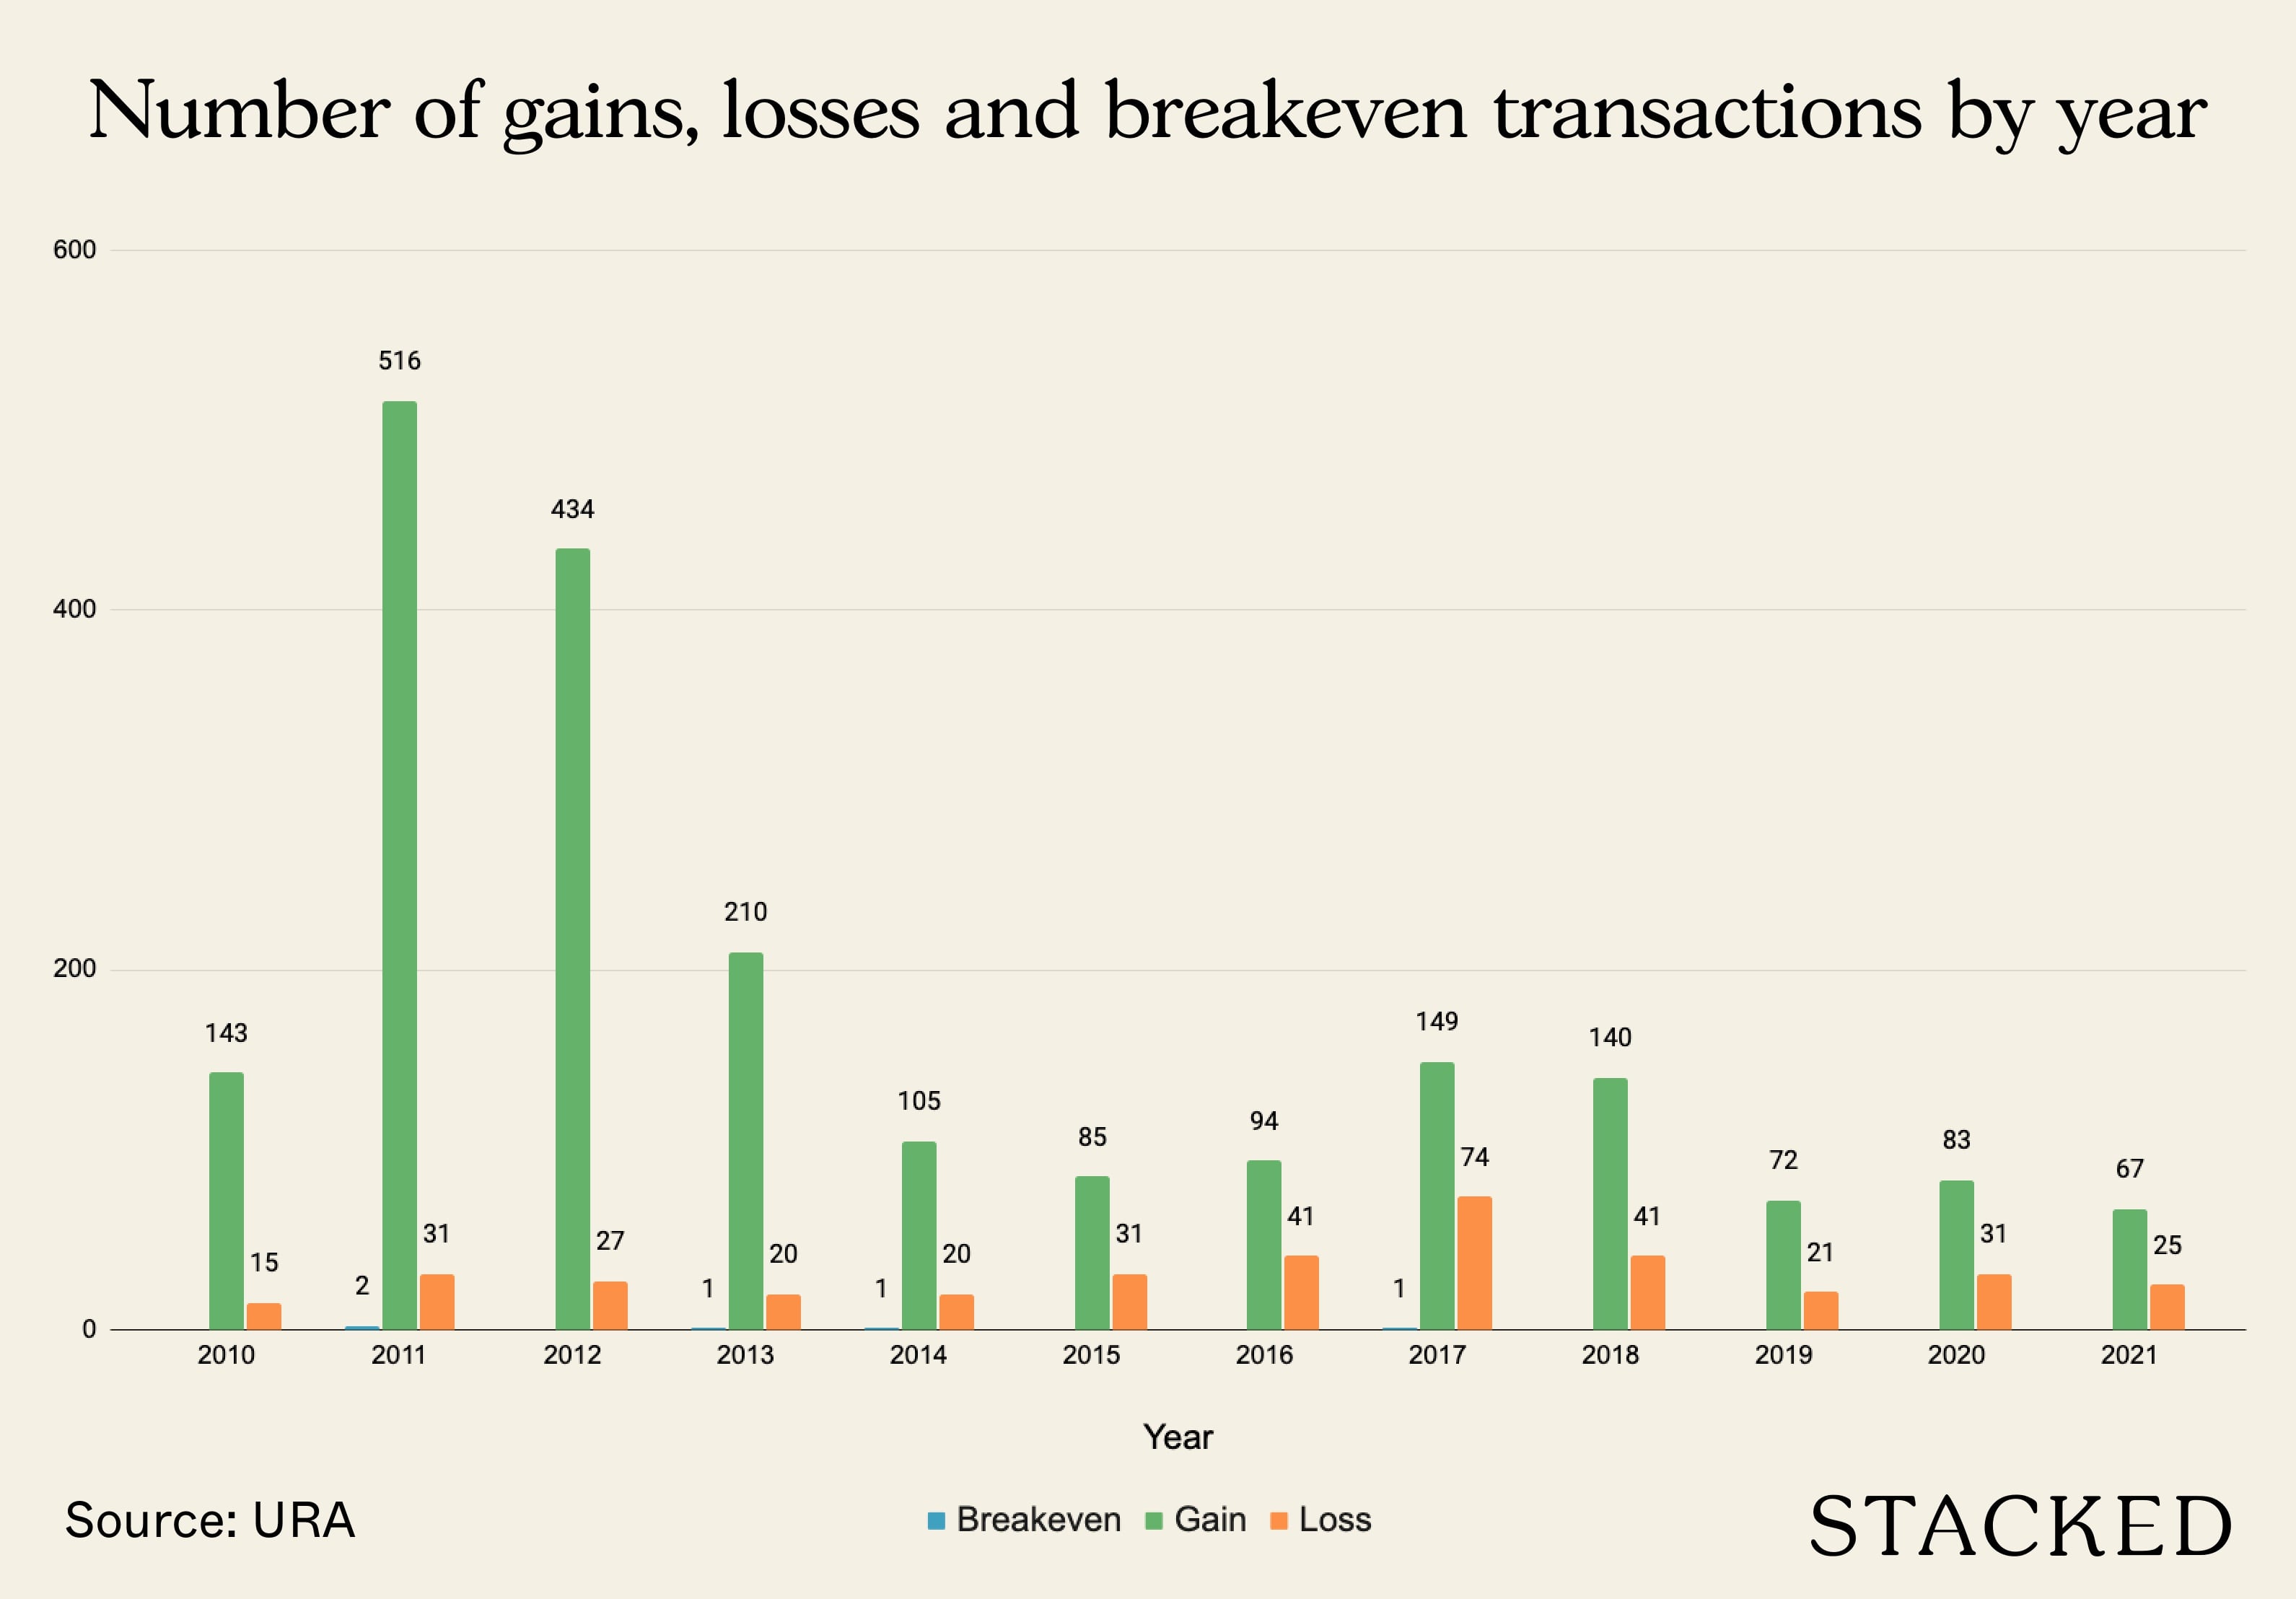
Overall, we can see that profitable transactions significantly outweighed unprofitable ones, even for those who bought in the 2007/8 peak.
Here, the proportion of gains to losses have narrowed since 2011; and the number of losing transactions was notably higher in 2017/18. This is likely a result of the slew of cooling measures, which has significantly changed the market since the heydays of 2007/8.
Do note that, up till 2010, there was no Sellers Stamp Duty (SSD), and that Additional Buyers Stamp Duty (ABSD) first reared its head in 2011. The Total Debt Servicing Ratio (TDSR) was only introduced in 2013, so financing was also less restrictive.
Key lessons:
- The old adage about holding power may not be true for all places
- “Golden postal codes” don’t fare well when bought at a peak
- A handful of developments can greatly skew the numbers
- Resale condos often performed better than new launch counterparts
1. The old adage about holding power may not be true for all places
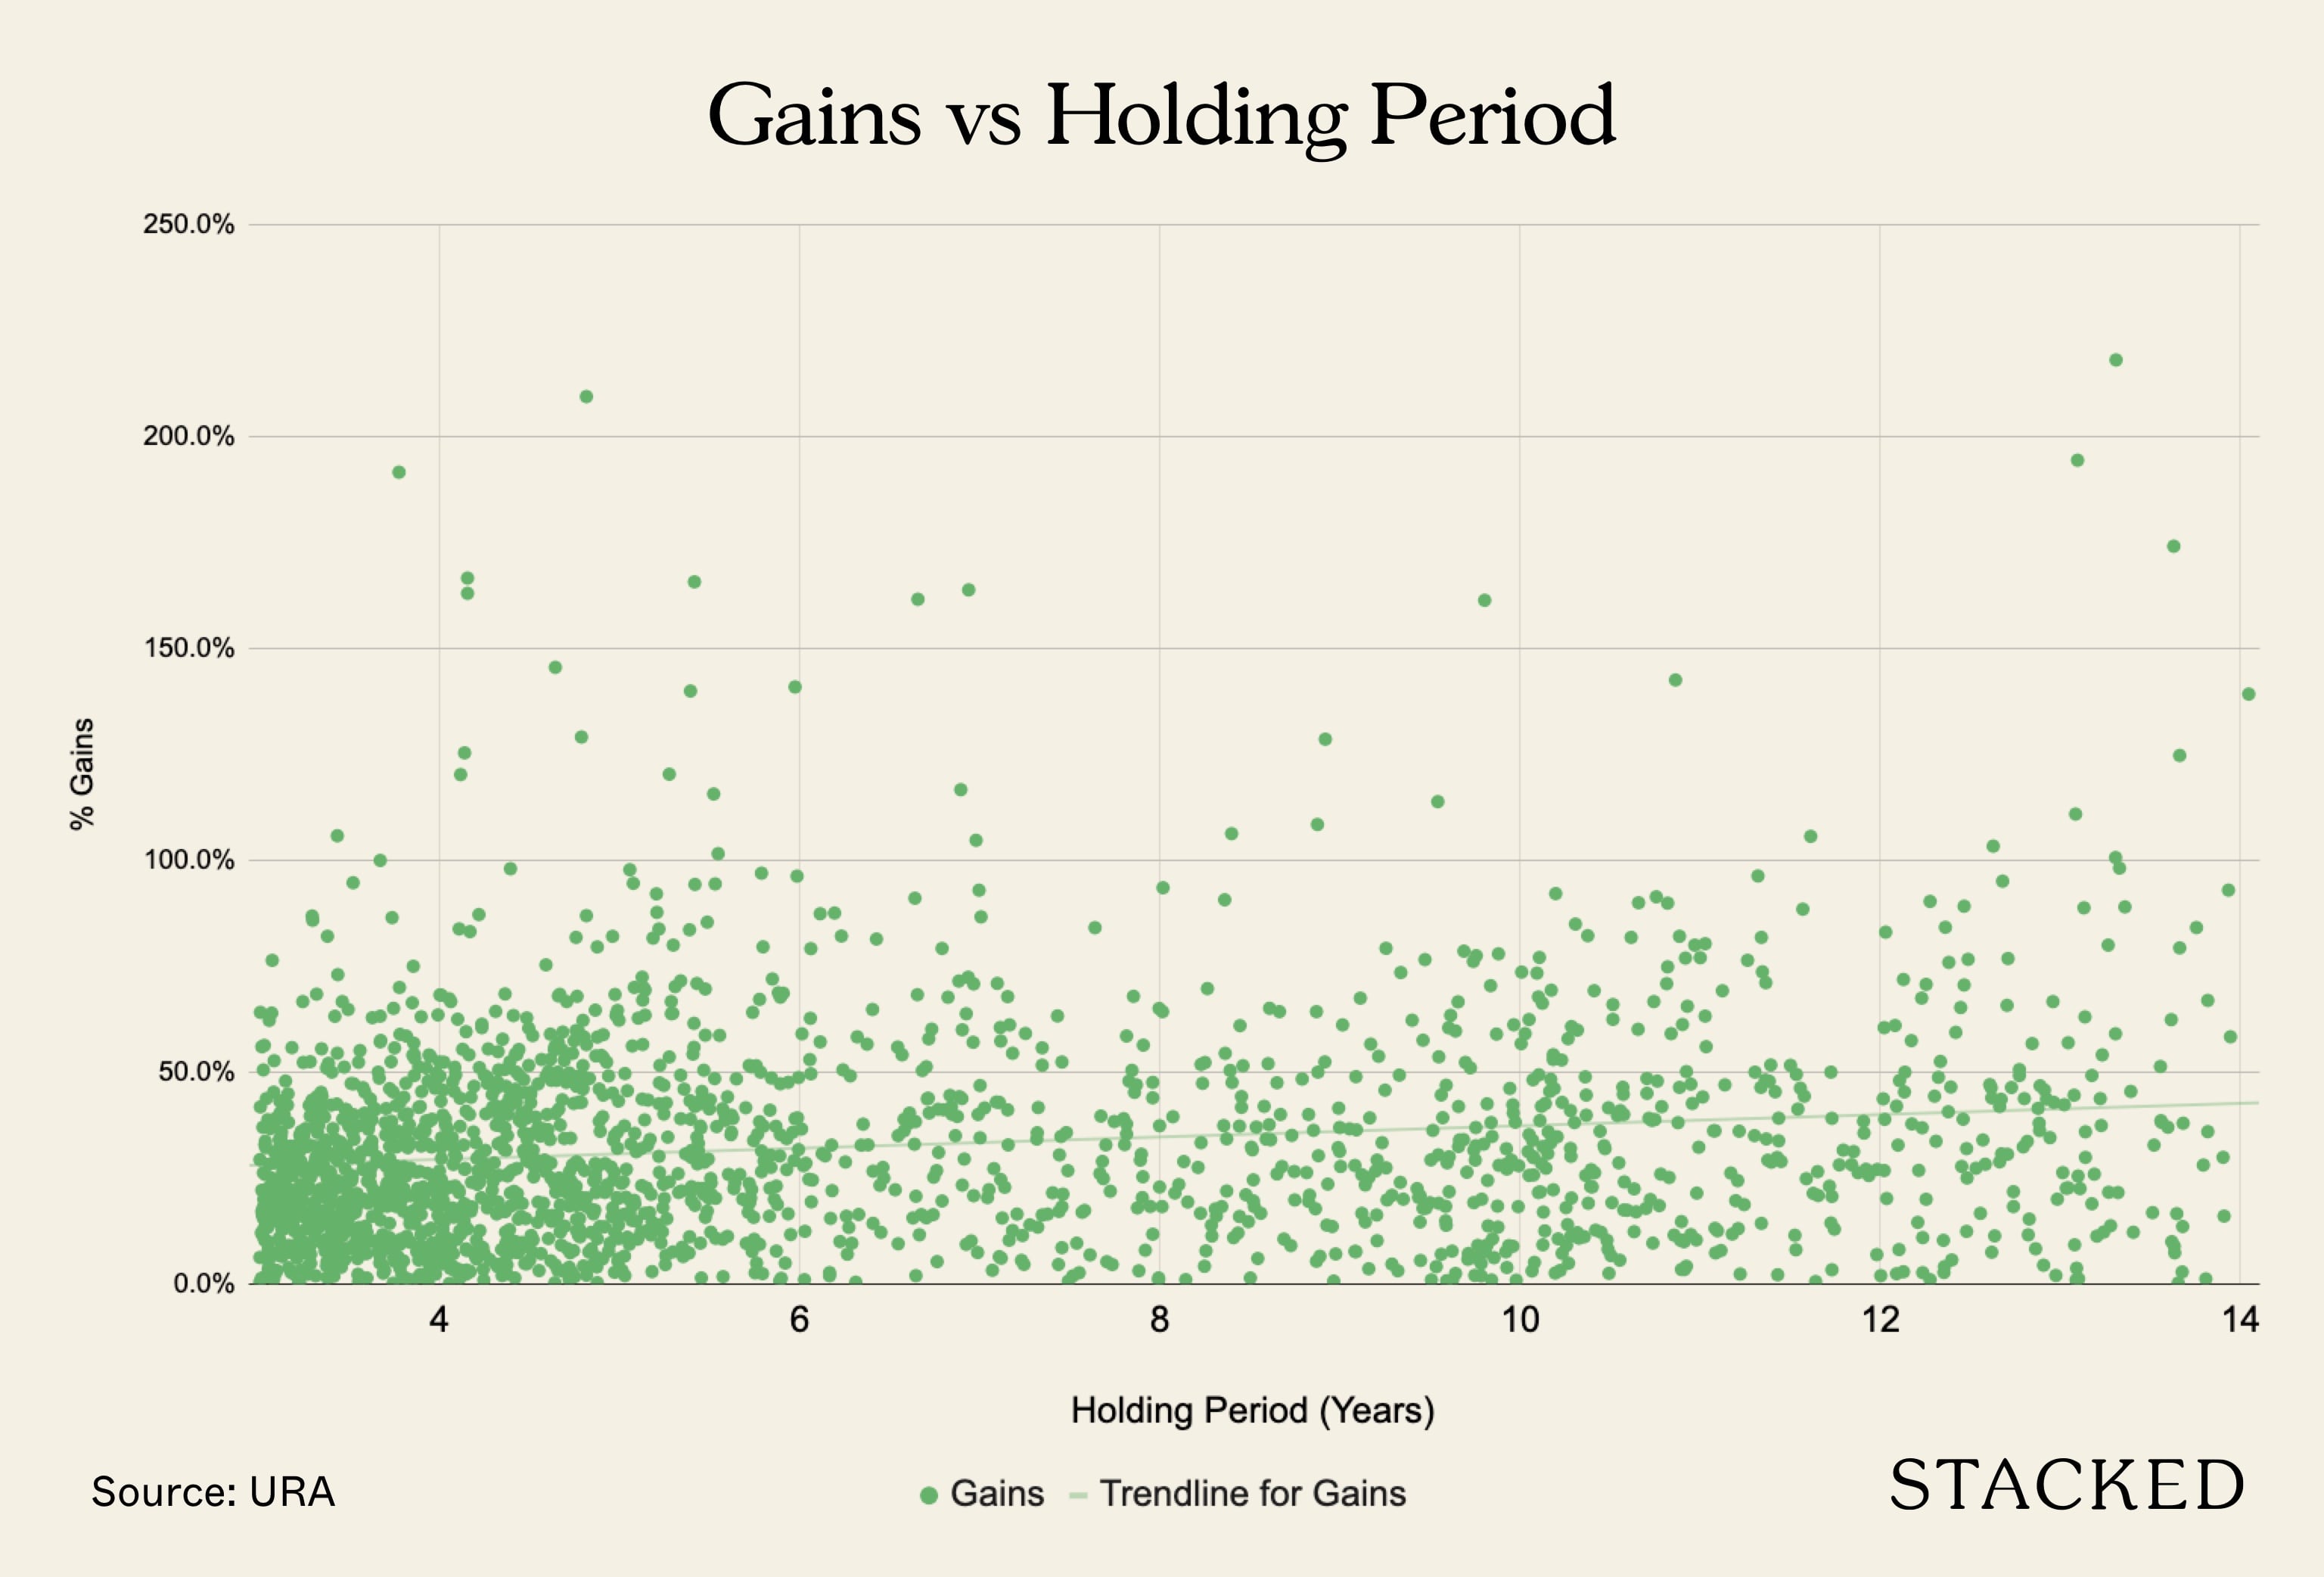
In most cases, we would expect that sellers with more holding power – or who hold on to their properties for longer – would see better profits. However, this seems to apply only in an “all things being equal” environment.
For those who saw gains, a longer holding time showed little correlation to profit. At the same time, there’s a (very weak) inverse relationship for those who lost money (the longer you hold onto your losses, the more losses you'll make).
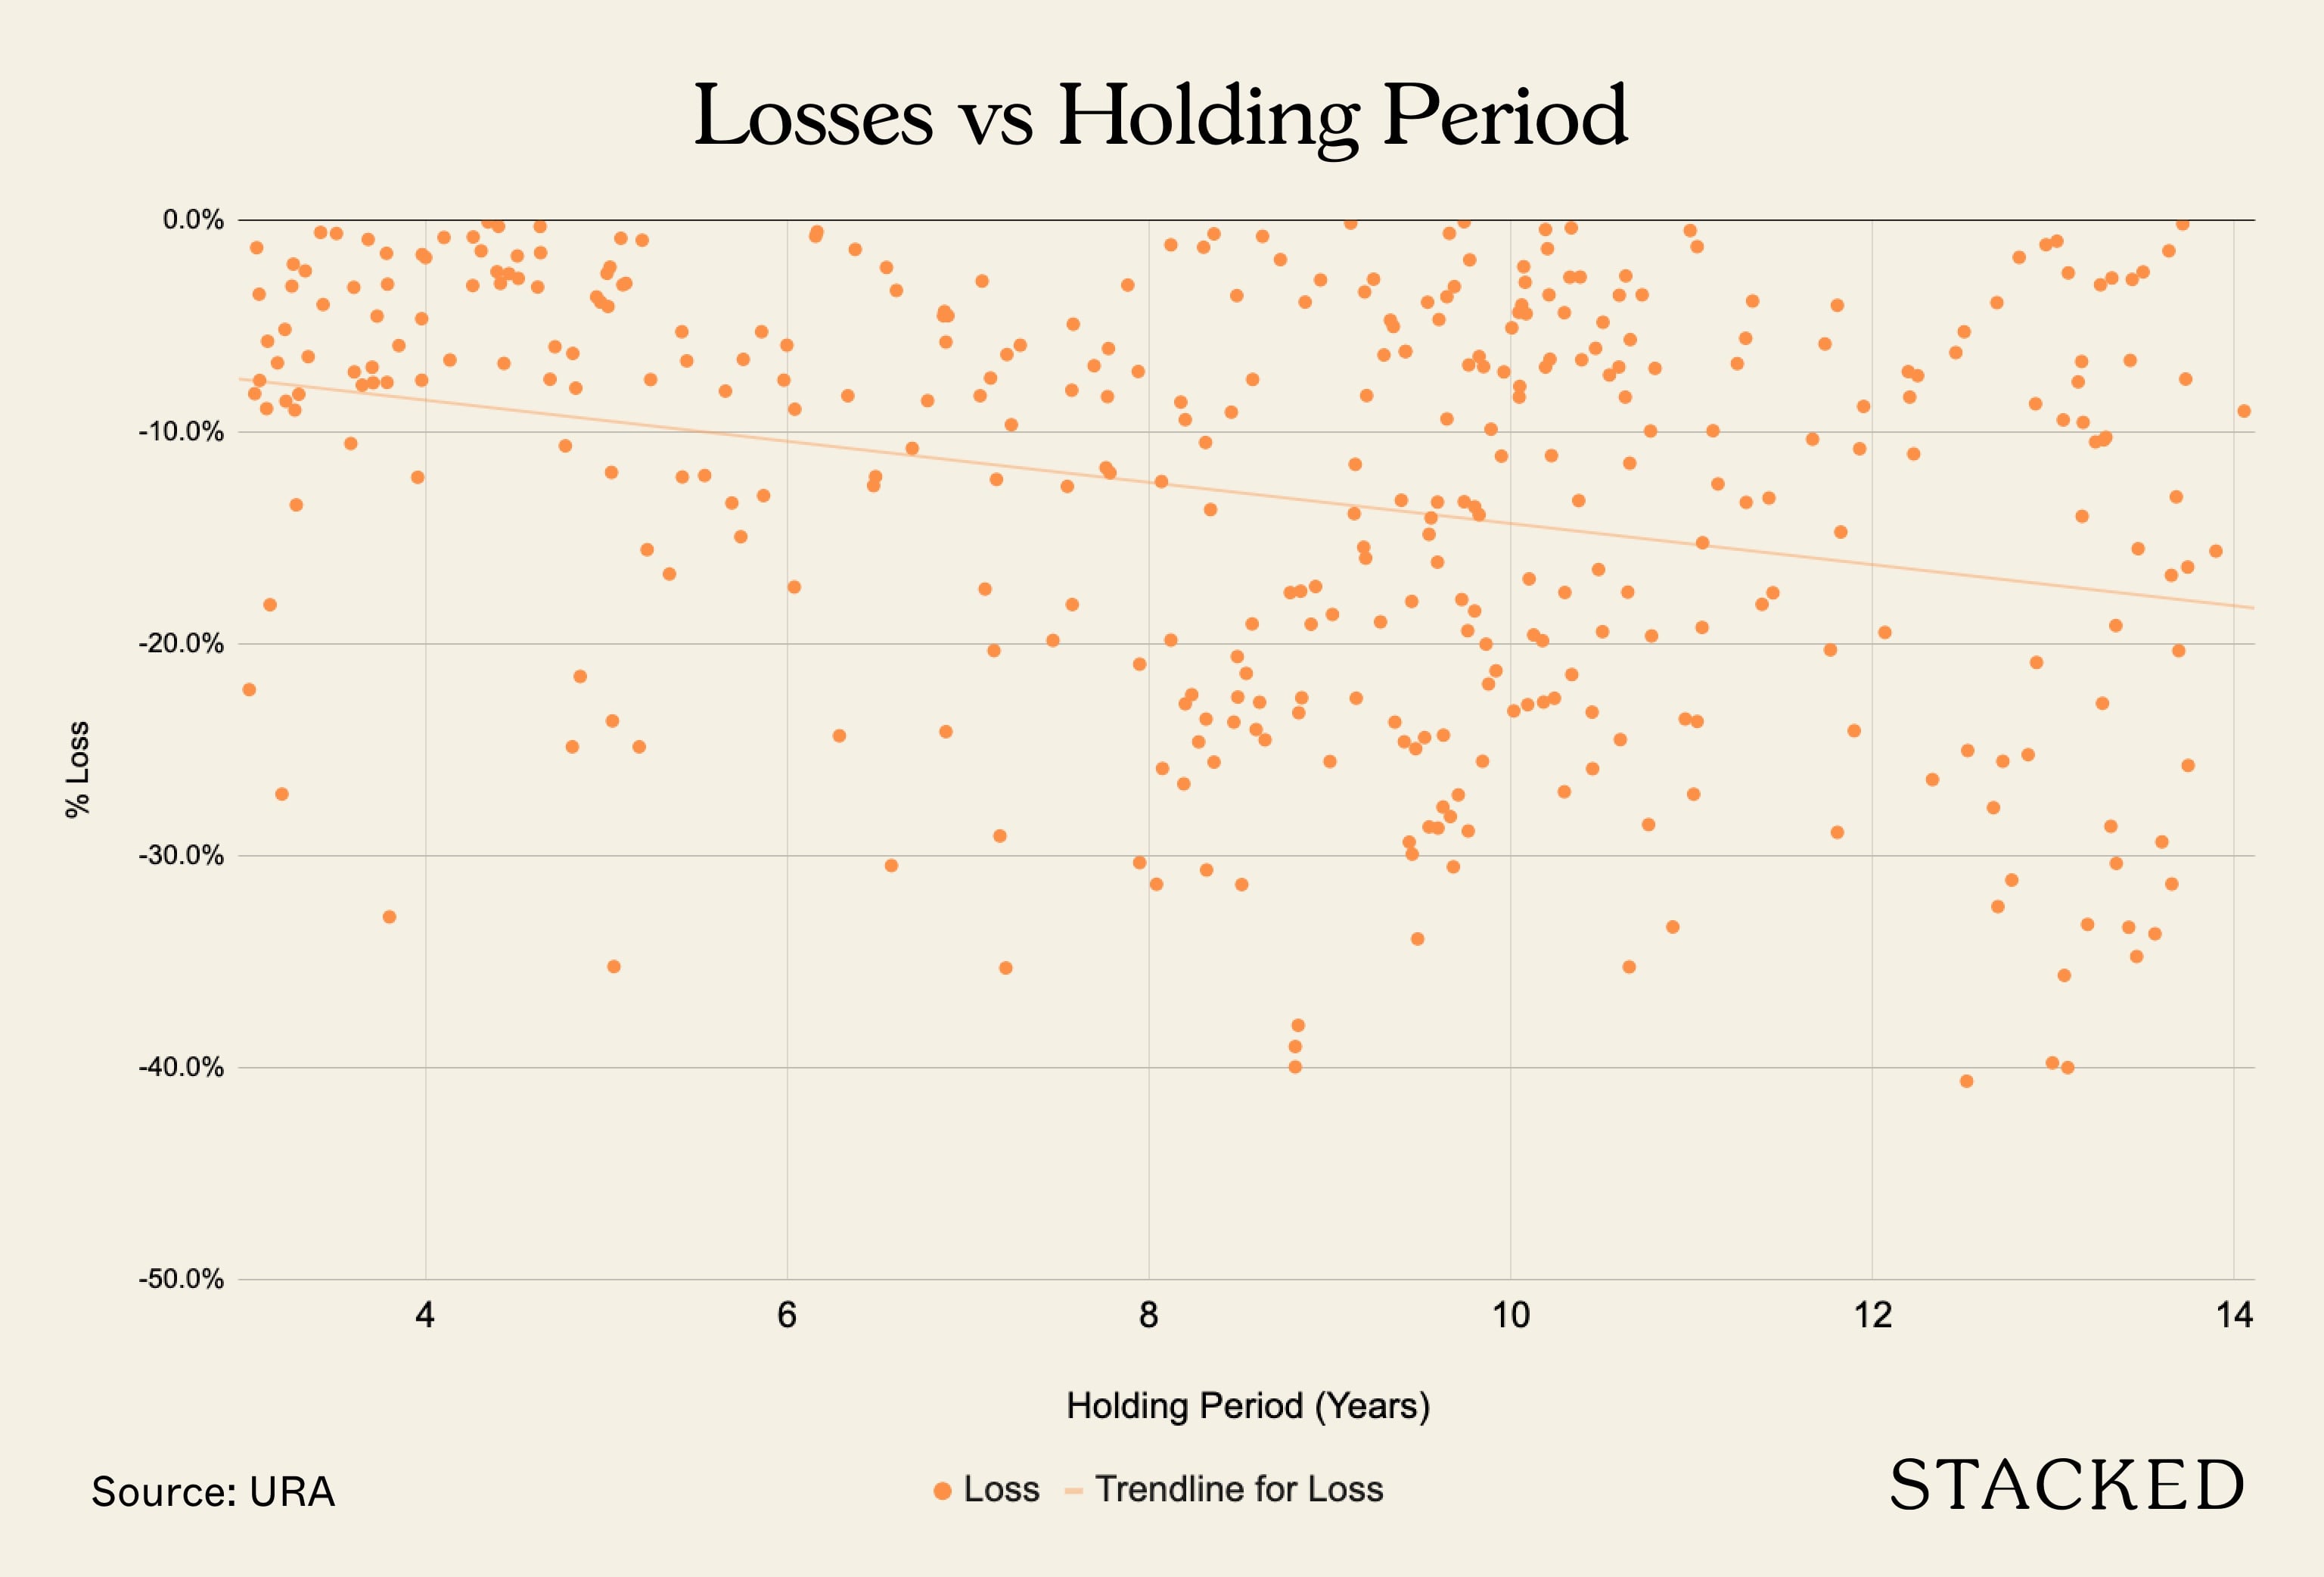
Why would this happen? Here’s an inference:
Those who waited for a long time may have seen prospective buyers impacted by cooling measures, such as the ABSD, or affected by loan curbs like the TDSR.
For example, if they had sold their condo to a foreigner in 2010, said foreigner would have paid no ABSD. If they had sold it in a little later in 2011, said foreigner would have paid 10 per cent ABSD. If they had sold it in 2013, the foreigner would have paid 15 per cent ABSD.
(It’s currently 20 per cent for foreign buyers, since 2018).
Likewise, 2013 saw the introduction of the TDSR, which capped home loan amounts to 60 per cent of monthly income. This further impeded financing, and high-quantum units – such as bigger units or prime region condos – would have been the first to bear the brunt.
As such, policy changes could have made profits worse over time, for sellers who held on only to be hit by further cooling measures.
We can understand why some of them may have done that, as the cooling measures were first described then as being temporary. These property owners already bought at peak price, so they may have decided to wait out the cooling measures before selling.
Today, the market has mostly accepted the cooling measures as being indefinite.
2. “Golden postal codes” don’t fare well when bought at a peak
Among buyers at the 2007/8 peak, those who bought in Core Central Region (CCR) districts saw higher rates of losses.
| Postal Districts | Breakeven | Gain | Loss | Total Transactions | % Profitable |
| 1 | 80 | 54 | 134 | 59.7% | |
| 2 | 54 | 15 | 69 | 78.3% | |
| 3 | 15 | 4 | 19 | 78.9% | |
| 4 | 1 | 1 | 100.0% | ||
| 5 | 132 | 32 | 164 | 80.5% | |
| 7 | 39 | 39 | 100.0% | ||
| 8 | 78 | 78 | 100.0% | ||
| 9 | 1 | 230 | 155 | 386 | 59.6% |
| 10 | 4 | 106 | 41 | 151 | 70.2% |
| 11 | 104 | 22 | 126 | 82.5% | |
| 12 | 219 | 10 | 229 | 95.6% | |
| 13 | 28 | 28 | 100.0% | ||
| 14 | 173 | 3 | 176 | 98.3% | |
| 15 | 421 | 39 | 460 | 91.5% | |
| 16 | 28 | 1 | 29 | 96.6% | |
| 17 | 20 | 20 | 100.0% | ||
| 18 | 31 | 31 | 100.0% | ||
| 19 | 153 | 1 | 154 | 99.4% | |
| 20 | 31 | 31 | 100.0% | ||
| 21 | 30 | 30 | 100.0% | ||
| 22 | 25 | 25 | 100.0% | ||
| 23 | 91 | 91 | 100.0% | ||
| 25 | 5 | 5 | 100.0% | ||
| 26 | 1 | 1 | 100.0% | ||
| 27 | 3 | 3 | 100.0% |
Districts 1, 2, 9, 10, and 11 are all CCR districts (District 6, near City Hall and High Street, is excluded as there are too few residential properties here).
Only district 5 is not part of the CCR, being on the city fringe (Pasir Panjang and Buona Vista).
These are all the districts where less than 90 per cent of transactions were profitable. In particular, District 9 was the worst for peak buyers – the last buyers in the ‘07/08 cycle have a 50 per cent chance of losing money, between then and now. District 1 (Marina, Chinatown, Boat Quay) follows close behind District 9.
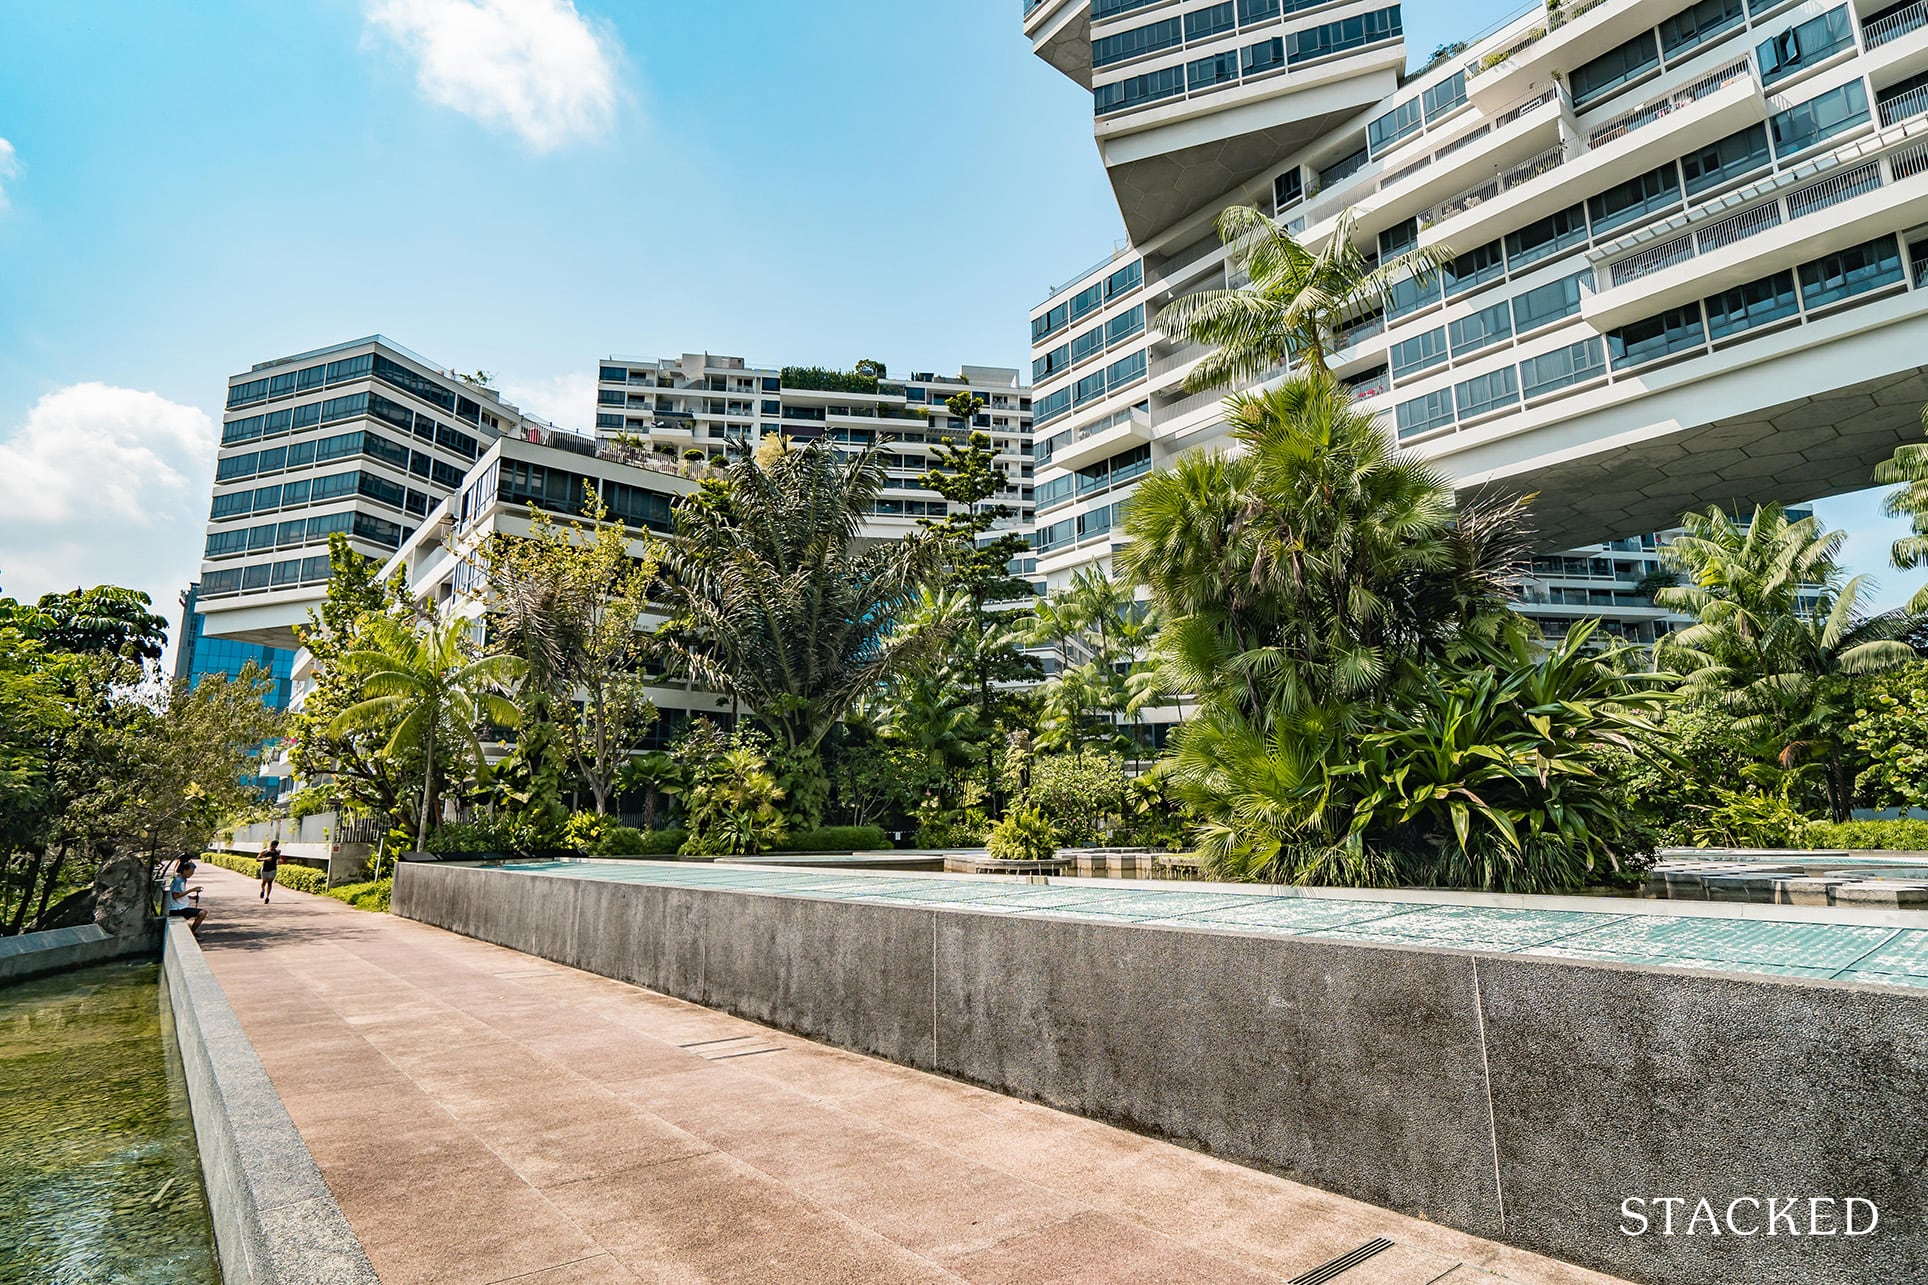
A combination of subsequent cooling measures, a weakening rental market, and already sky-high prices seem to have made “golden postal codes” one of the worst choices during this peak.
However, it’s also worth noting that…
3. A handful of developments can greatly skew the numbers
While it doesn’t change the fact that the CCR fared the worst, it’s fair to point out that a handful of developments did skew the average; this was on the back of dramatic losses.
| Projects | Biggest Loss | Average Loss | Biggest Gains | Total Transactions |
| 2 RVG | $80,000 | $170,000 | $260,000 | 2 |
| 8 Rodyk | $90,800 | $296,495 | $600,971 | 6 |
| Cairnhill Plaza | -$230,000 | -$230,000 | -$230,000 | 1 |
| Cairnhill Residences | -$306,550 | -$32,315 | $241,920 | 2 |
| Casa Novacrest | $180,000 | $445,000 | $710,000 | 2 |
| Cavenagh Court | $178,000 | $178,000 | $178,000 | 1 |
| Claremont | $96,000 | $132,650 | $169,300 | 2 |
| Claymore Plaza | -$480,000 | -$480,000 | -$480,000 | 1 |
| Emerald Hill Conservation Area | $242,000 | $373,500 | $505,000 | 2 |
| Estilo | -$201,380 | -$3,590 | $98,031 | 22 |
| Euro-Asia Court | -$100,000 | $173,333 | $320,000 | 3 |
| Gambier Court | $40,000 | $40,000 | $40,000 | 1 |
| Helios Residences | -$1,980,100 | -$1,317,013 | -$302,770 | 13 |
| High Point | -$1,130,000 | -$1,130,000 | -$1,130,000 | 1 |
| La Crystal | $125,000 | $230,833 | $355,000 | 6 |
| Langston Ville | $150,000 | $237,267 | $366,800 | 3 |
| Le Wilkie | $288,000 | $288,000 | $288,000 | 1 |
| Leonie Parc View | -$2,450,000 | -$2,152,667 | -$1,886,000 | 3 |
| Leonie Suites | -$360,000 | -$122,250 | $40,000 | 8 |
| Lucky Plaza | -$100,000 | $53,400 | $206,800 | 2 |
| Luma | -$753,874 | -$610,533 | -$440,264 | 3 |
| Mackenzie 138 | $230,000 | $230,000 | $230,000 | 1 |
| Mackenzie 88 | -$52,427 | $118,048 | $266,101 | 28 |
| Mount Sophia Suites | -$70,000 | $84,645 | $153,283 | 10 |
| N.A. | $140,000 | $140,000 | $140,000 | 1 |
| One Oxley Rise | -$299,000 | -$54,238 | $100,000 | 5 |
| Orchard Court | $730,000 | $730,000 | $730,000 | 1 |
| Pacific Mansion | $25,000 | $25,000 | $25,000 | 1 |
| Paterson Linc | -$1,872,000 | -$694,032 | -$211,790 | 5 |
| Residences At 338A | -$68,000 | $24,500 | $117,000 | 2 |
| Rivergate | -$106,000 | $365,605 | $585,650 | 19 |
| Riveria Gardens | -$523,840 | -$343,947 | -$133,200 | 3 |
| Riviera Point | -$220,000 | -$103,000 | -$9,000 | 3 |
| Robertson 100 | $92,000 | $247,500 | $400,000 | 6 |
| Robertson Blue | -$100,000 | $246,667 | $600,000 | 3 |
| Robertson Edge | $200,000 | $263,835 | $388,340 | 4 |
| Scotts Square | -$1,558,330 | -$708,001 | $265,160 | 49 |
| Sophia 98 | -$165,000 | -$165,000 | -$165,000 | 1 |
| The Abode At Devonshire | $0 | $37,500 | $75,000 | 2 |
| The Centrepoint | $370,000 | $1,055,251 | $1,550,502 | 4 |
| The Lumos | -$1,877,000 | -$1,869,200 | -$1,861,400 | 2 |
| The Mkz | -$277,500 | -$277,500 | -$277,500 | 1 |
| The Orchard Residences | -$3,319,000 | -$1,057,244 | $1,620,000 | 9 |
| The Oxley | $340,000 | $355,000 | $370,000 | 2 |
| The Paterson Edge | -$180,000 | -$80,000 | $20,000 | 2 |
| The Pier At Robertson | -$175,000 | $113,817 | $251,200 | 7 |
| The Quayside | -$350,000 | $241,065 | $570,000 | 6 |
| The Regalia | -$120,000 | $276,667 | $900,000 | 3 |
| Townhouse Apartments | $50,000 | $250,000 | $450,000 | 2 |
| UE Square | $97,000 | $241,082 | $700,000 | 11 |
| Vida | -$766,469 | -$327,977 | $28,300 | 10 |
| Visioncrest | -$725,500 | -$107,566 | $533,000 | 33 |
| Waterford Residence | -$10,000 | $119,132 | $168,400 | 4 |
| Watermark Robertson Quay | -$554,740 | $242,325 | $874,400 | 26 |
| Wilkie 80 | -$4,000 | $117,696 | $239,000 | 28 |
| Wilkie 87 | $395,000 | $395,000 | $395,000 | 1 |
| Wilkie Court | $380,000 | $380,000 | $380,000 | 1 |
| Wilkie Studio | -$740,000 | -$406,910 | -$138,460 | 5 |
| Projects | Biggest Loss | Average Loss | Biggest Gains | Total Transactions |
| One Shenton | -$1,026,880 | -$236,983 | $292,300 | 16 |
| People's Park Centre | $380,000 | $380,000 | $380,000 | 1 |
| People's Park Complex | $100,000 | $127,500 | $150,000 | 4 |
| Riverwalk Apartments | -$220,000 | -$220,000 | -$220,000 | 1 |
| The Clift | -$350,000 | $88,862 | $422,500 | 41 |
| The Riverside Piazza | $180,000 | $207,500 | $235,000 | 2 |
| The Sail @ Marina Bay | -$2,311,500 | -$156,567 | $607,150 | 69 |
For example, in District 9, Scotts Square showed average losses of $708,000, with the highest gains at just $265,160. It made up 49 of the 386 transactions in the district, which can make the Orchard area look worse than it really is. Likewise, in District 1, The Sail @ Marina Bay saw average losses of $73,631, was maximum gains of $607,150. It accounted for 69 of the 136 transactions here.
As an interesting aside, we note that many prime region condos – such as Scotts Square in District 9 – are freehold condos. Their poor performance could suggest that freehold status is sometimes more of a drawback; particularly given the initial price premiums (freehold units tend to cost 15 to 20 per cent more than leasehold counterparts).
It may be that freehold status takes a much longer time for its benefits to show, such as when a condo starts creeping past the 30- or 40-year mark. If a condo goes en-bloc or is sold before that, then the lack of lease decay may not be a huge advantage anyway.
4. Resale condos often performed better than new launch counterparts
In general, buyers who purchased resale condos in the ‘07/08 peak, and then resold them, had a better chance of seeing gains. This is compared to those who bought new launches.
| Type of Sale | Breakeven | Gain | Loss | Total | % Gained |
| New Sale To Resale | 701 | 219 | 920 | 76.20% | |
| New Sale To Sub Sale | 202 | 19 | 221 | 91.40% | |
| Resale To Resale | 4 | 881 | 53 | 938 | 93.92% |
| Sub Sale To Resale | 1 | 286 | 84 | 371 | 77.09% |
| Sub Sale To Sub Sale | 28 | 2 | 30 | 93.33% | |
| Grand Total | 5 | 2098 | 377 | 2480 | 84.60% |
This is likely due to the lower prices of resale condos, which allows more room for appreciation. However, we should point out that sub sales are sometimes not accounted for. For example, in ‘07/08, you could buy a unit with a developer discount, and then sell it (even before completion) as soon as the developer raised the price. This could result in profiting off a condo unit, even before it’s built.
In fact, it wasn’t unheard of for units to be sold and resold repeatedly this way; such that the last buyer would actually have ended up paying the highest price*.
Unfortunately, we can’t account for these instances; but setting them aside, resale units seemed to be more forgiving to peak buyers.
*This is no longer possible today, due to the Sellers Stamp Duty (SSD)
Ultimately, no one can really time the market, but we are still firm believers in holding power and research in choosing the right property
It’s less about when you buy, and more about what you buy. For example, most fringe region buyers saw a good return on their condo assets, even when they bought at the peak of the cycle.
Everyone wants to buy low and sell high, but knowing about market trends today, and what will likely still be in vogue in the future is the key.
For one, with the CCR yet to breach its highs, and with the vaccination rates of Singapore up - foreign buying could see more interest in the CCR in the future. We'd be keeping a close eye on the CCR and what this may entail in further articles.
You can also get the latest reviews of new and resale properties alike, by giving us a follow.
At Stacked, we like to look beyond the headlines and surface-level numbers, and focus on how things play out in the real world.
If you'd like to discuss how this applies to your own circumstances, you can reach out for a one-to-one consultation here.
And if you simply have a question or want to share a thought, feel free to write to us at stories@stackedhomes.com. We read every message.





0 Comments