


Despite the Coronavirus showing no signs of abating around the world, it does seem like there is no separating Singapore from its love of property. Just last weekend, the M has sold a quite frankly astonishing 75 percent of its units, while Luxus Hills managed to sell out its final phase as well – and even managed to set a new benchmark for pricing along the way.
So is there a reason why certain new launch condos do well – even with the current uncertain climate that they are launched in?
Is it always about selling price?
Or do other factors like the size of the development have a big role to play in the performance of the new launch?
In this article, we’ve taken the data from our new launch 2020 cheat sheet to analyse and see if there is any commonality in the data.
As always, let me just lay out the disclaimer first.
There were only 96 new launches that we’ve accounted for – so truthfully, it is a small sample size to really glean anything statistically sound.
For example, certain districts might really only have one new launch, so comparing it wouldn’t exactly be fair.
Let’s start with a couple of highlights.
The challenge for many buyers today isn't access to information.
It's interpreting that information in a way that makes sense for their finances, goals, and stage of life.
Over time, that's also why we decided to work with agents who shared the same data-driven and advisory-led approach behind our editorial, consultants who could help readers think through decisions more objectively, rather than simply push transactions.
Today, the team has worked with more than 2,000 clients across over $5B in property transactions.
Highlights: Key pointers
- The average take-up rate for all new launches is at 3.62%. This means most new launch condos sell an average of 3.62% of its total units every month.
- The M has sold a staggering 392 of its 522 units – in 2 weeks. Because of that, it has been an anomaly in all the data such that we’ve taken it out of all except the comparison in districts.
- (If you don’t account for the M) District 2 surprisingly had an average take-up rate of 9.54% – almost 3 times the average take-up rate.
New Launch Condos Take-Up Rate 2020
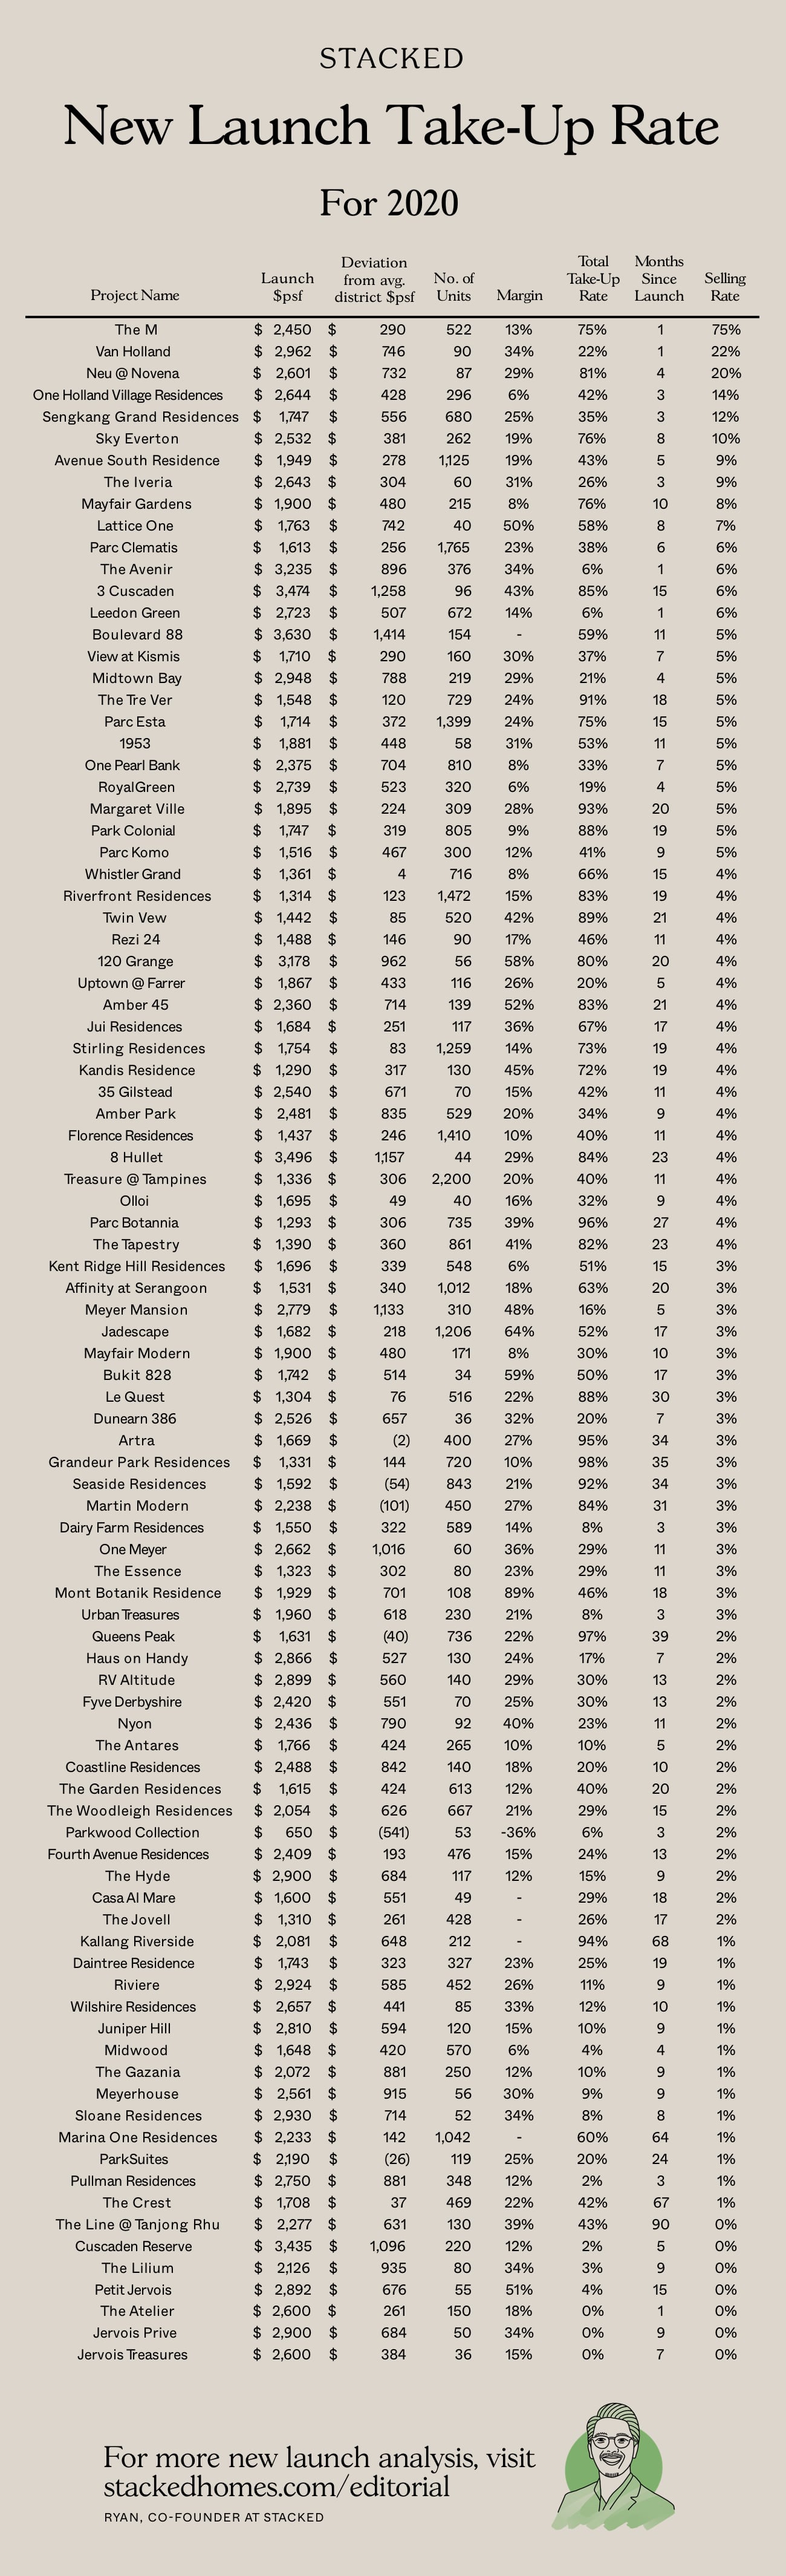
Selling Prices vs Average Take-Up Rate
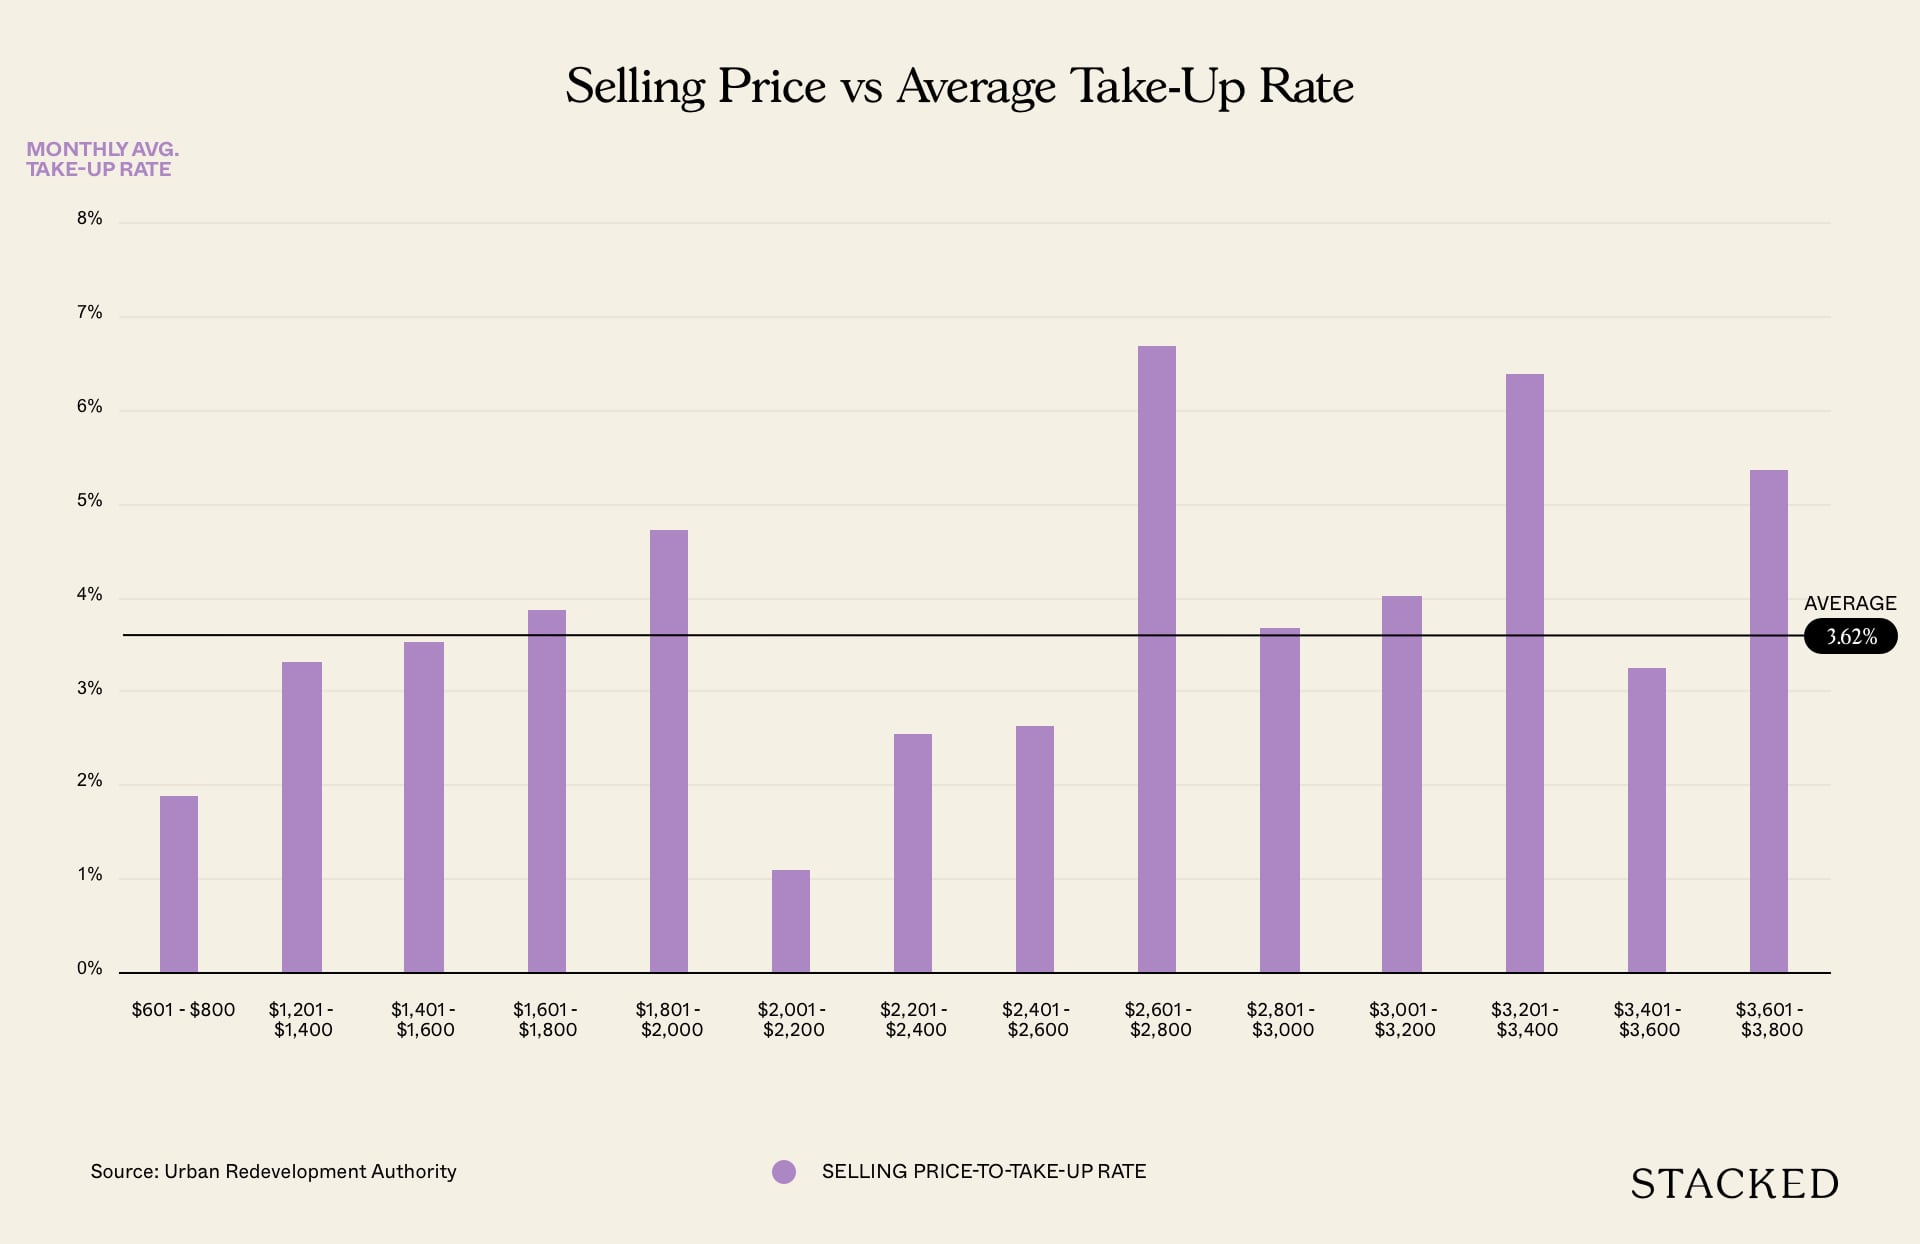
This was an interesting one for us. Ask anyone prior to this and most people would think that a lower selling price means a faster take-up rate.
Well, from the chart you can see that that isn’t the case at all.
In fact, properties in the luxury market sold faster – with new launch condos in the $2601 to $2,800 PSF category achieving a 6.69% monthly average take-up rate. Properties in the $3,201 to $3,400 PSF category weren’t far off at all too at 6.4%.
Difference in Selling Price to District Price vs Average Take-Up Rate
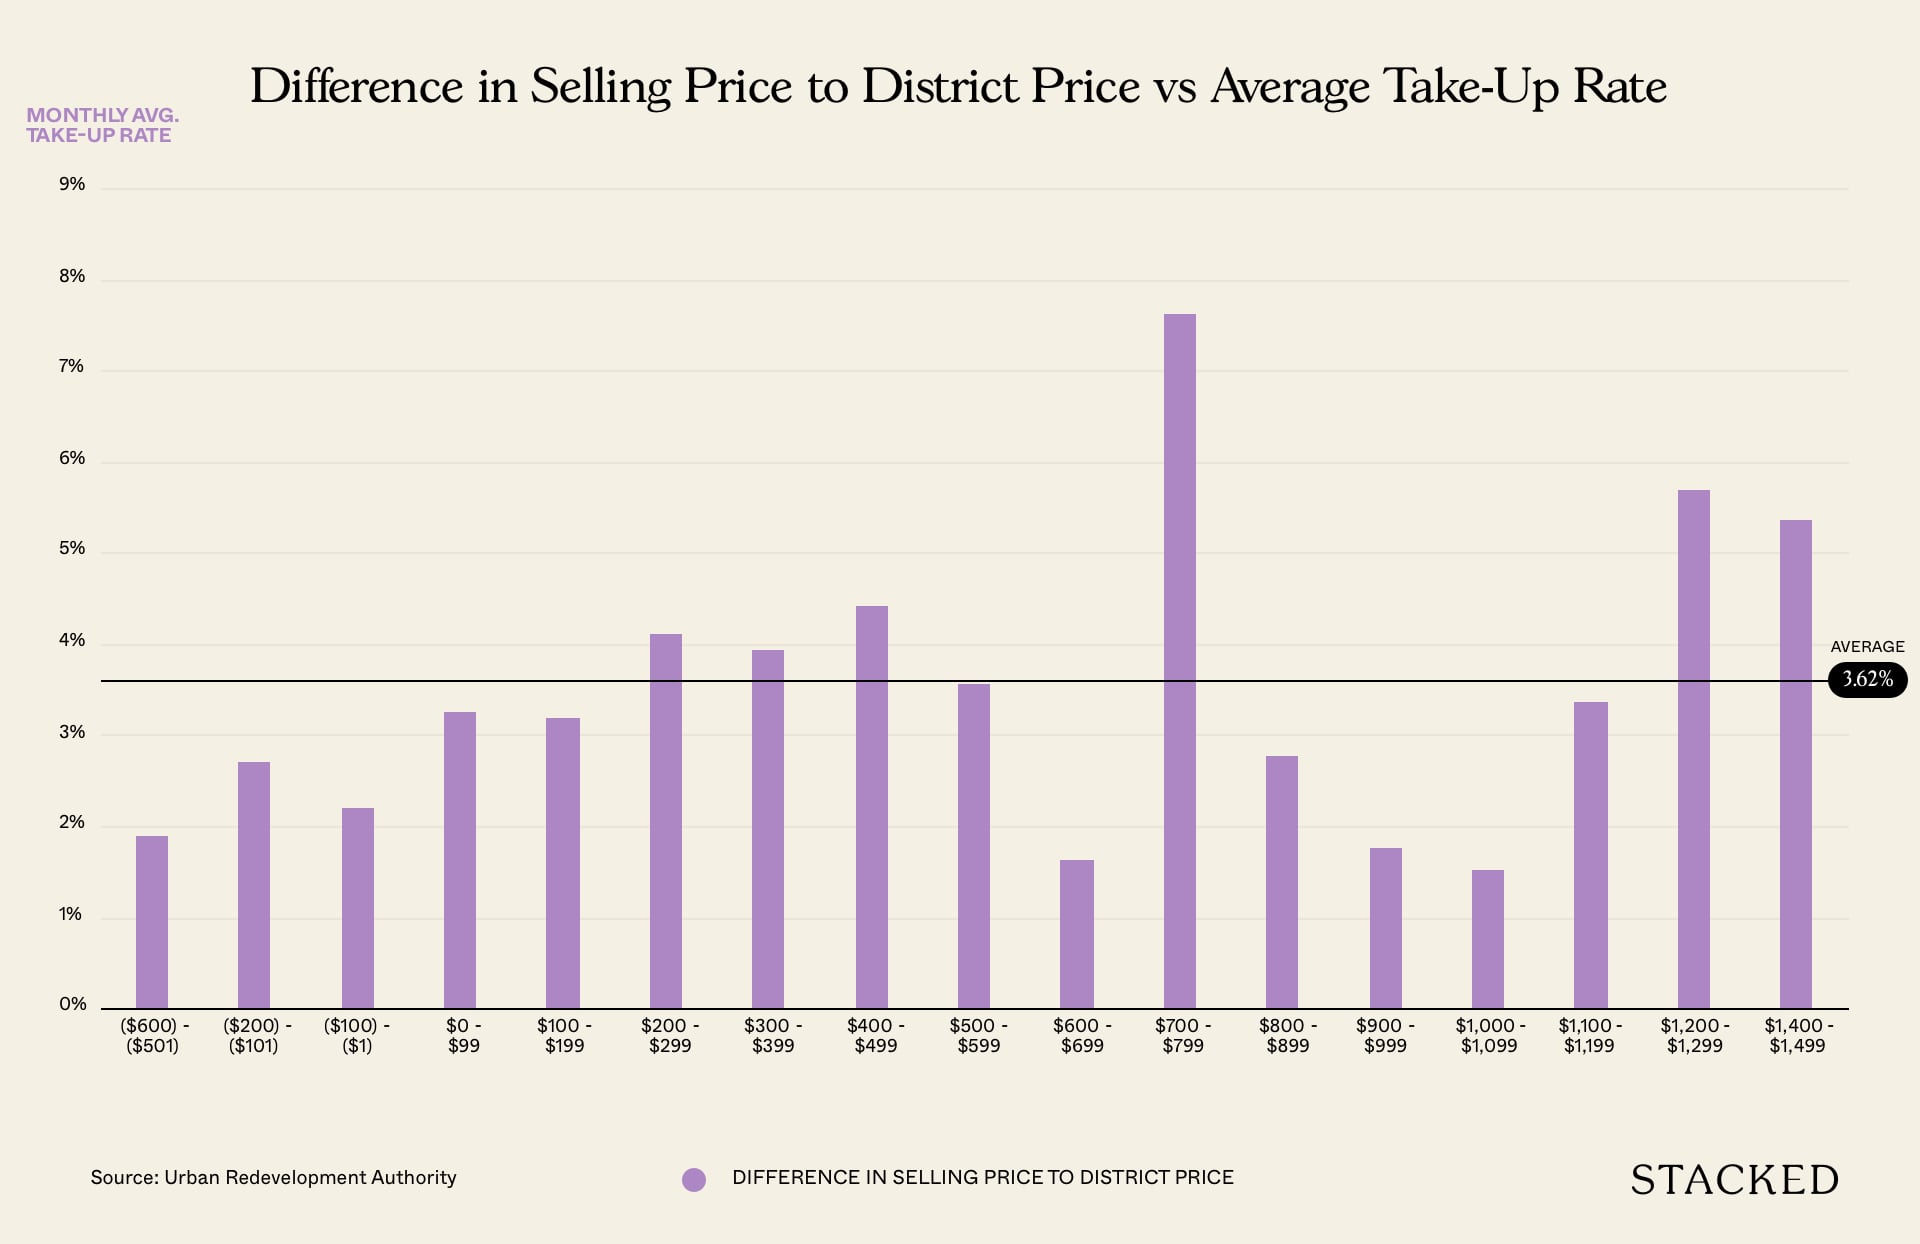
Quite a mouthful of a header here, but it’s quite simple really. We wanted to find out if there was a relationship between new launch condos that were priced under and over the district average PSF.
In a similar story to the above selling prices category, one might expect that new launch condos priced under the district average PSF to sell through faster. But that’s not the case at all – with the sweet spot for selling prices at $700 – $799 above the district average PSF doing well at 7.62%.
You’ll see from the graph too that the highest category at $1,400 to $1,499 has done rather well with an above-average 5.37% take-up rate. But it’s worth noting that this is solely based on the performance of the Boulevard 88 – the only one in this category. Like we mentioned earlier, it’s a small sample size so don’t read too much into this one!

Number of Units vs Average Take-Up Rate
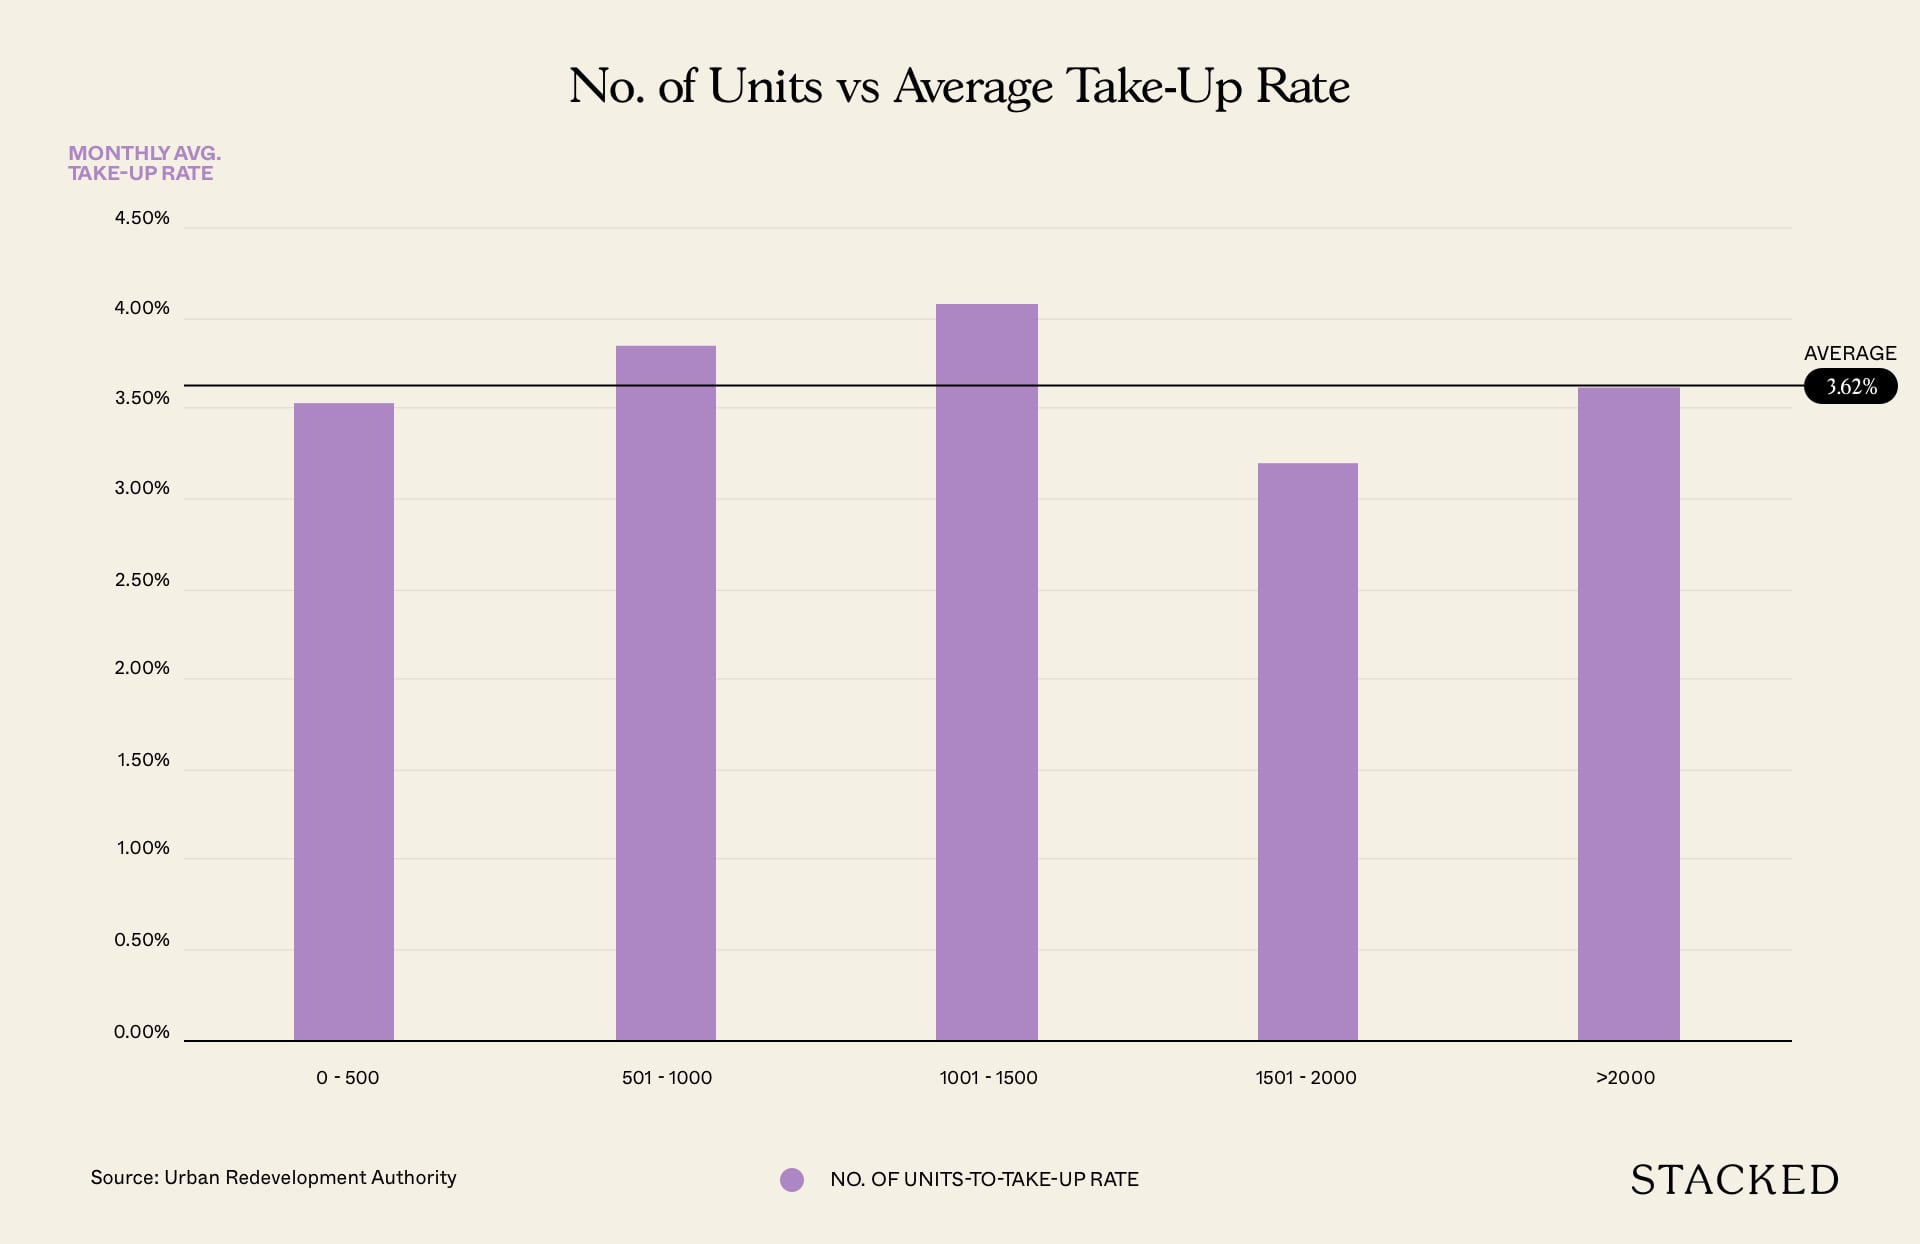
As you can see, this was quite the dud as on the surface it seems as if there is no real correlation between the number of units and the average take-up rate at all.
To be fair in this case, it is hard to come up with any meaningful conclusion given that 66 of the 96 condos in this list came under the 0 to 500 unit category. There was only one in the above 2,000 units – Treasure at Tampines. Perhaps if there were more launches in the larger categories we could see something more concrete, but that would be something hard to achieve given these are generally seen to be more risky to developers.
Margin vs Average Take-Up Rate
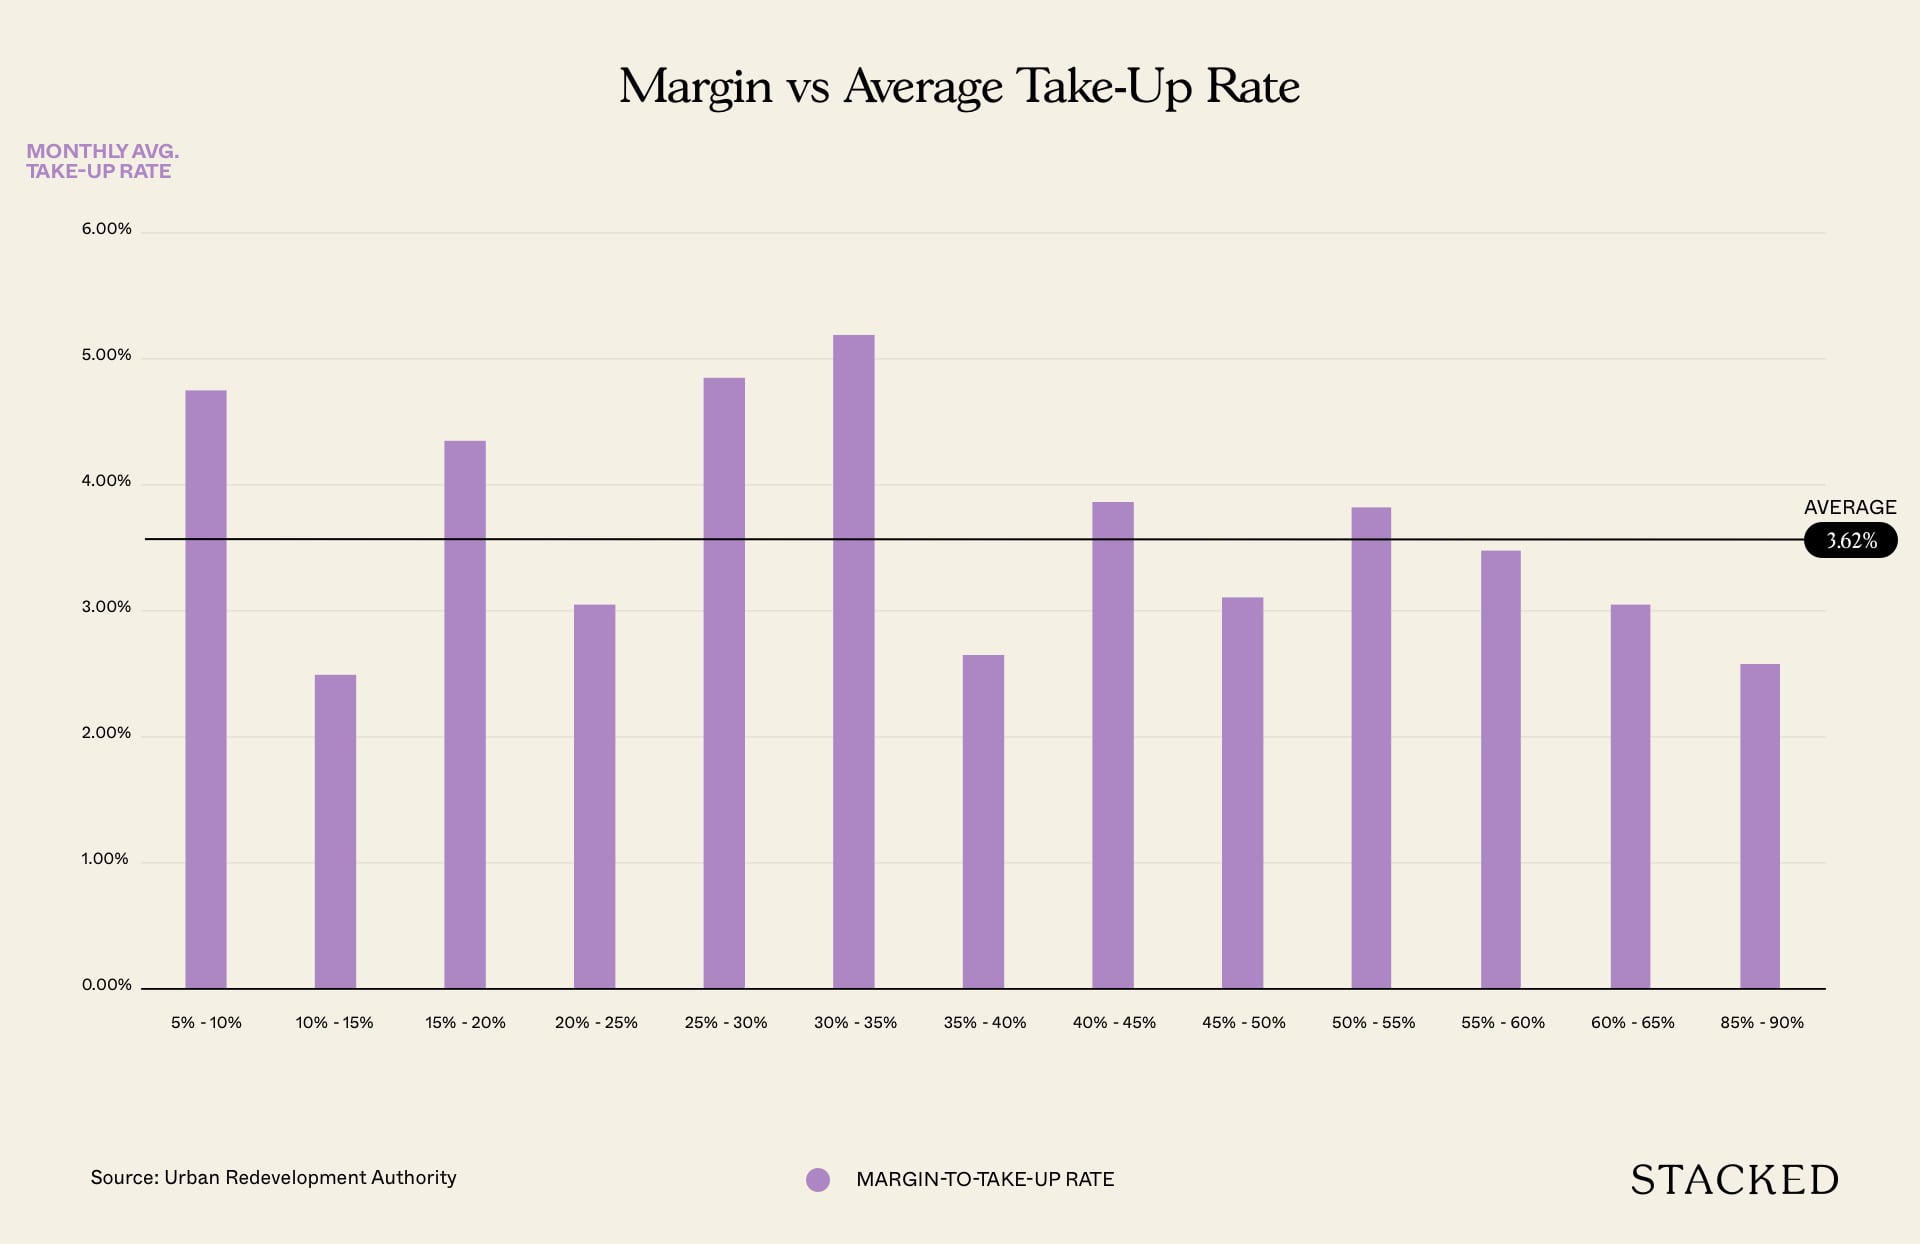
Before we go into this, it must be said that the margins for these are all based on an estimation of costs to the developer such as construction, land financing, legal fees, and marketing. The only figures that are certain are GFA and the cost of the land.
Again, this was quite a surprise as we thought there might be some correlation here too. But the results appear to be quite even across the board. Of course, this could change if units do not move as those new launch condos with higher margins can afford to spend more on marketing, incentivise agents with more commissions, or simply lower the price (worst case scenario).
District vs Average Take-Up Rate
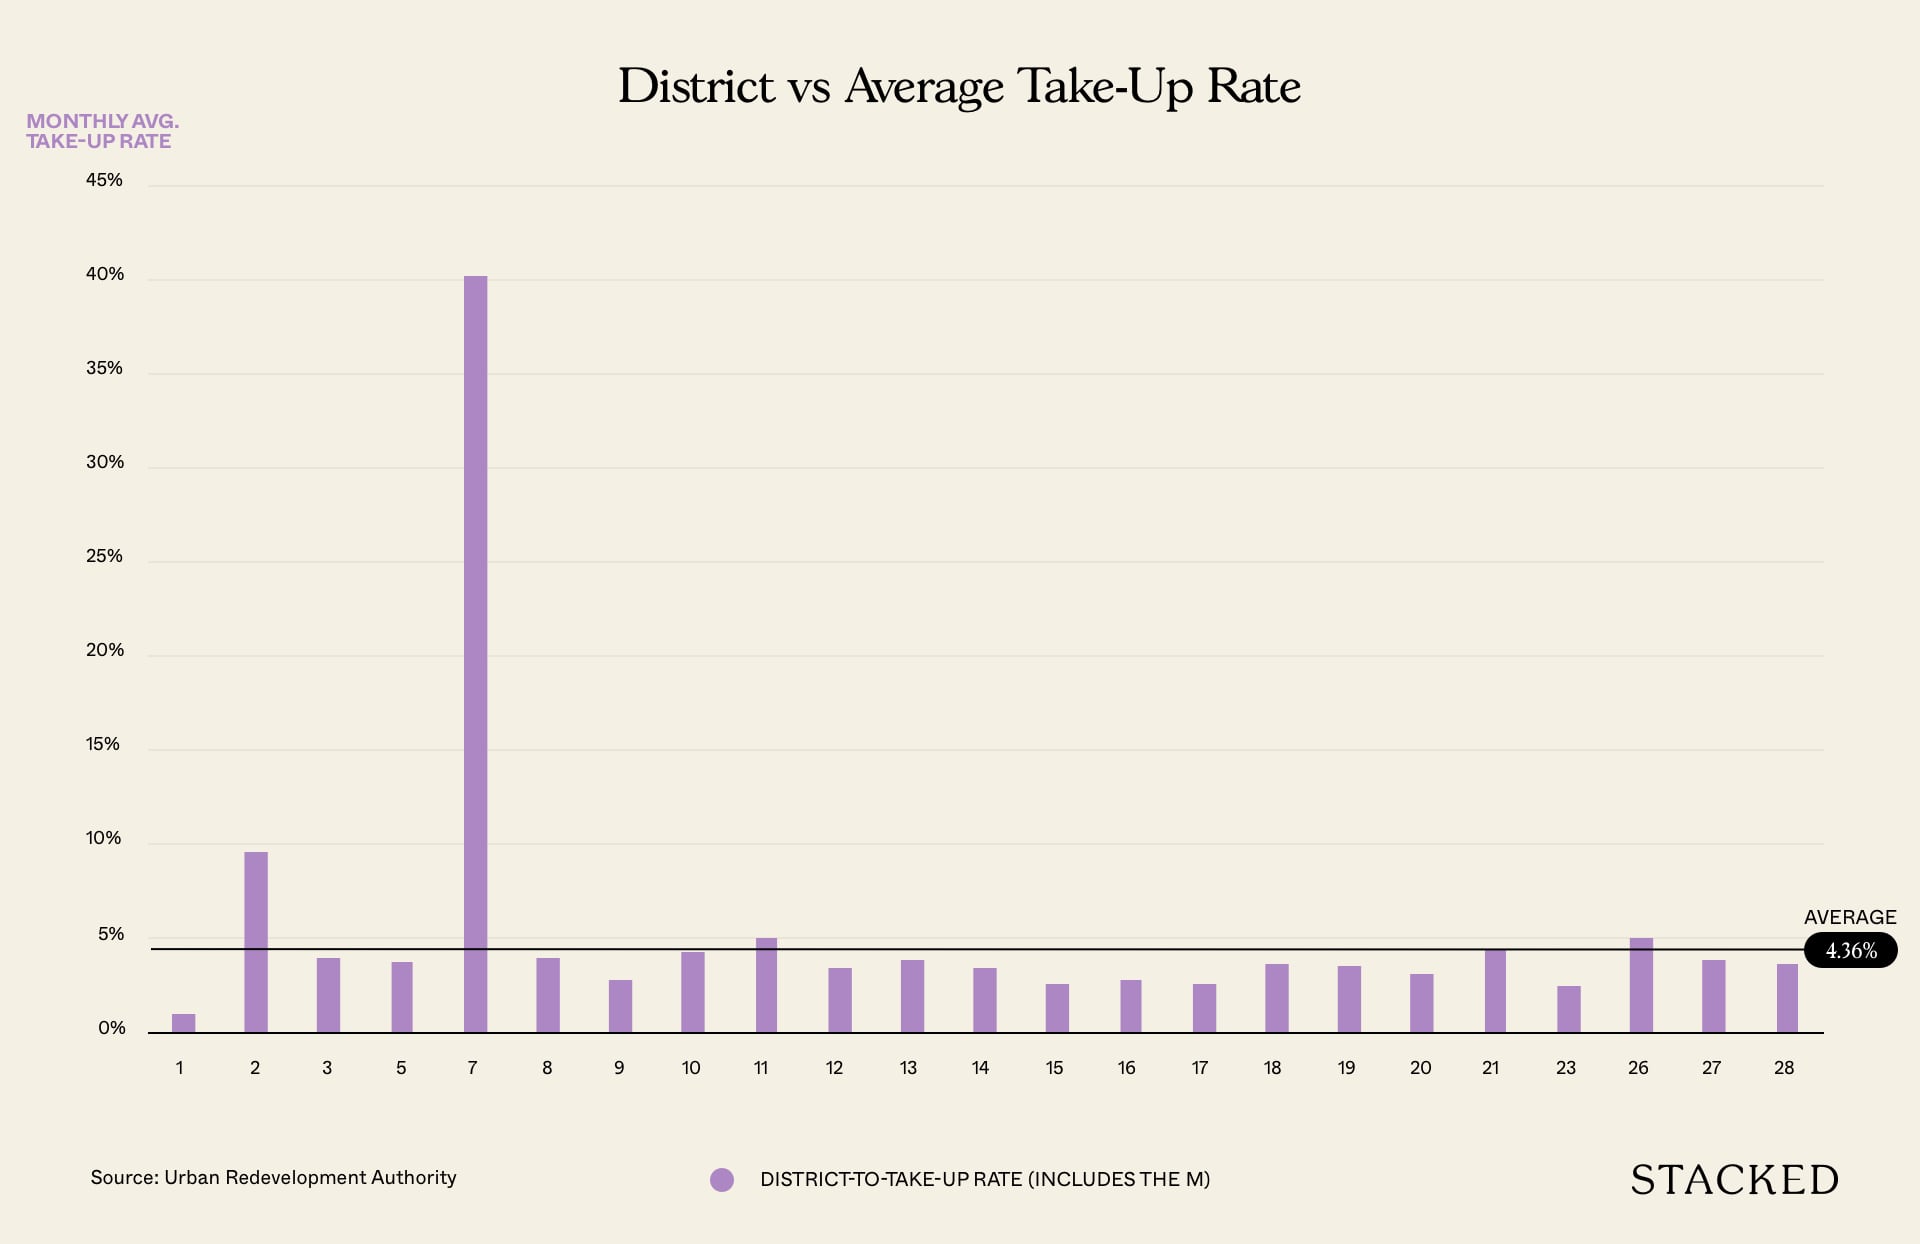
Last but not least, we wanted to see if the popularity or future potential of a district can play a role in the average take-up rate.
This is the only chart that we’ve decided to include the M into the findings, and as you can see, it has clearly skewed the data – with a 40.13% average take-up rate.
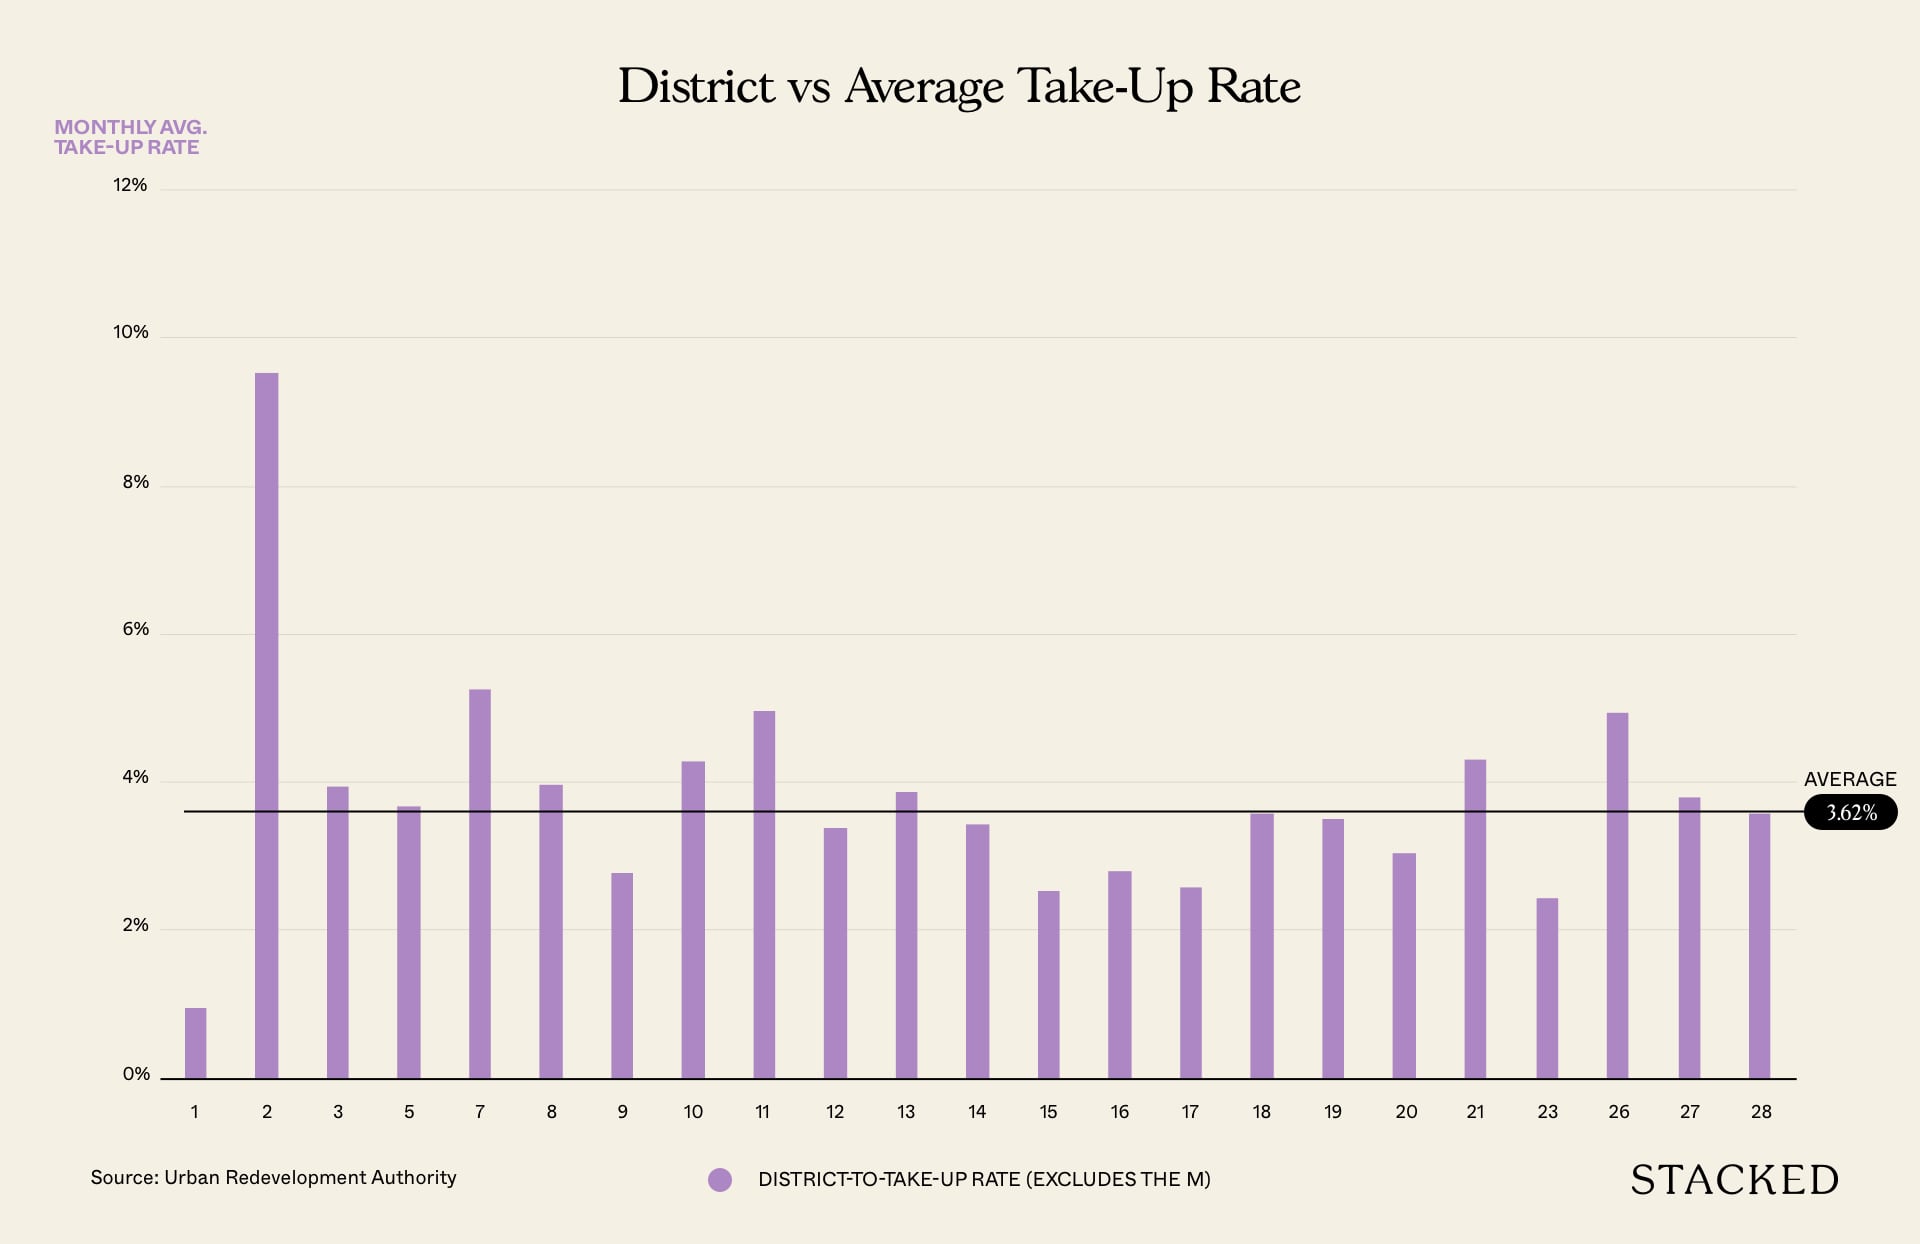
If we were to take out the M, it drops to second place, with District 2 overtaking it.
Final Words
Ultimately, these statistics are based on correlation, not causation.
And while the final data hasn’t really provided anything out of the ordinarily interesting we can still draw one major conclusion from this:
There is never just one major reason for a new launch doing well.
It is always due to a combination of factors that cannot be ignored.
Buying real estate is not like choosing the best fridge for your kitchen – it isn’t an easy decision at all and there are a ton of factors that come into play.
Need help in choosing a new launch condo for yourself? Feel free to reach out to us at stories@stackedhomes.com!
At Stacked, we like to look beyond the headlines and surface-level numbers, and focus on how things play out in the real world.
If you’d like to discuss how this applies to your own circumstances, you can reach out for a one-to-one consultation here.
And if you simply have a question or want to share a thought, feel free to write to us at stories@stackedhomes.com — we read every message.

2 Comments
Interesting piece. I’d like to make a further suggestion – you can do a multivariate regression using the take-up rate as the dependent variable. Then you will at least see which factors are statistically significant to the take-up rate, and whether your sample size is significant now.