Watertown Condo’s 10-Year Case Study: When Holding Period And Exit Timing Mattered More Than Buying Early

Get The Property Insights Serious Buyers Read First: Join 50,000+ readers who rely on our weekly breakdowns of Singapore’s property market.

A seasoned content strategist with over 17 years in the real estate and financial journalism sectors, Ryan has built a reputation for transforming complex industry jargon into accessible knowledge. With a track record of writing and editing for leading financial platforms and publications, Ryan's expertise has been recognised across various media outlets. His role as a former content editor for 99.co and a co-host for CNA 938's Open House programme underscores his commitment to providing valuable insights into the property market.
In this Stacked Pro breakdown:
- We analysed over a decade of Watertown transactions to reveal when early buyers were burned by later price cuts
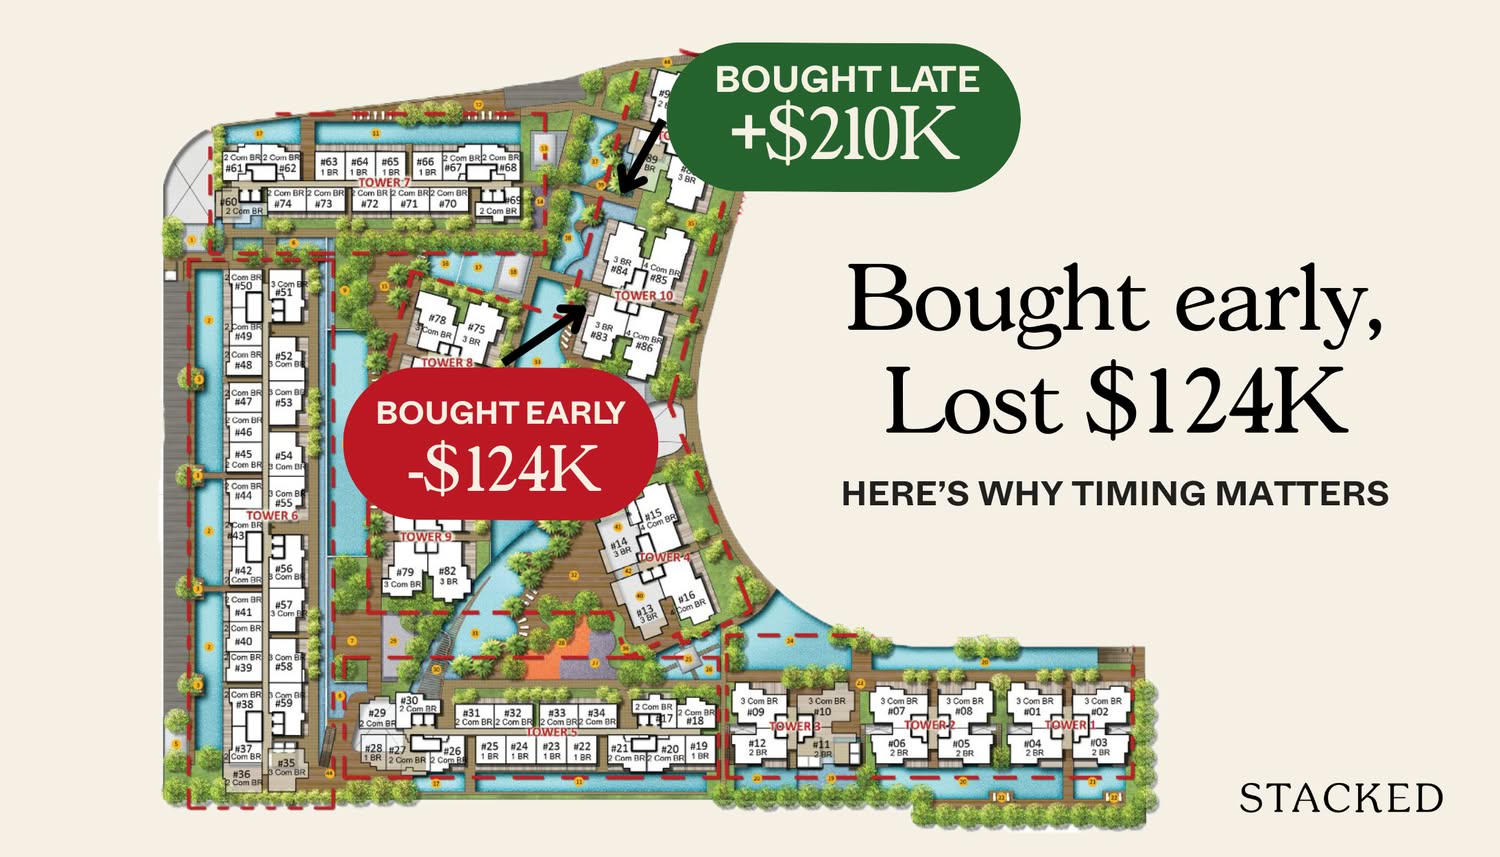
- Discover why some 2012 buyers made losses despite early entry — and how later sellers from 2020–2023 walked away with bigger gains
- See how holding period, facing, and exit timing can matter more than simply buying early
Already a subscriber? Log in here.
Watertown condo is an interesting case study, as buyers weren’t sure what to expect when it launched in 2012. At the time, many still considered Punggol to be too “ulu” to see good resale gains, and some were sceptical about the impact of Waterway Point as a major recreational/family hub. Still, some buyers were bold and jumped in early, perhaps because of the integrated status and access to Punggol MRT. Let’s see if their decision paid off, compared to those who took longer to decide:
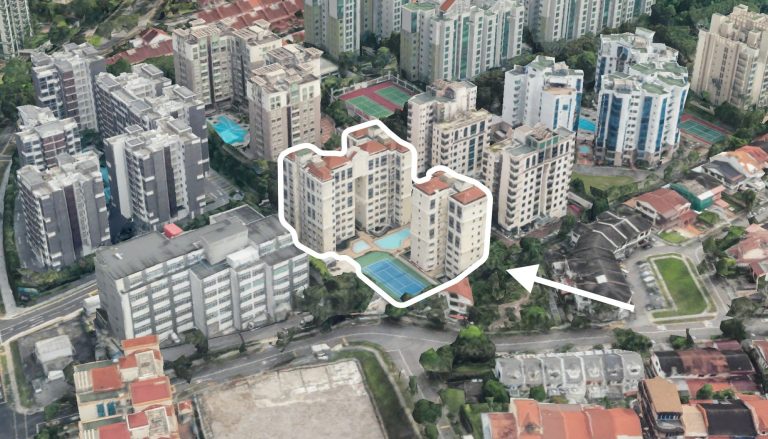
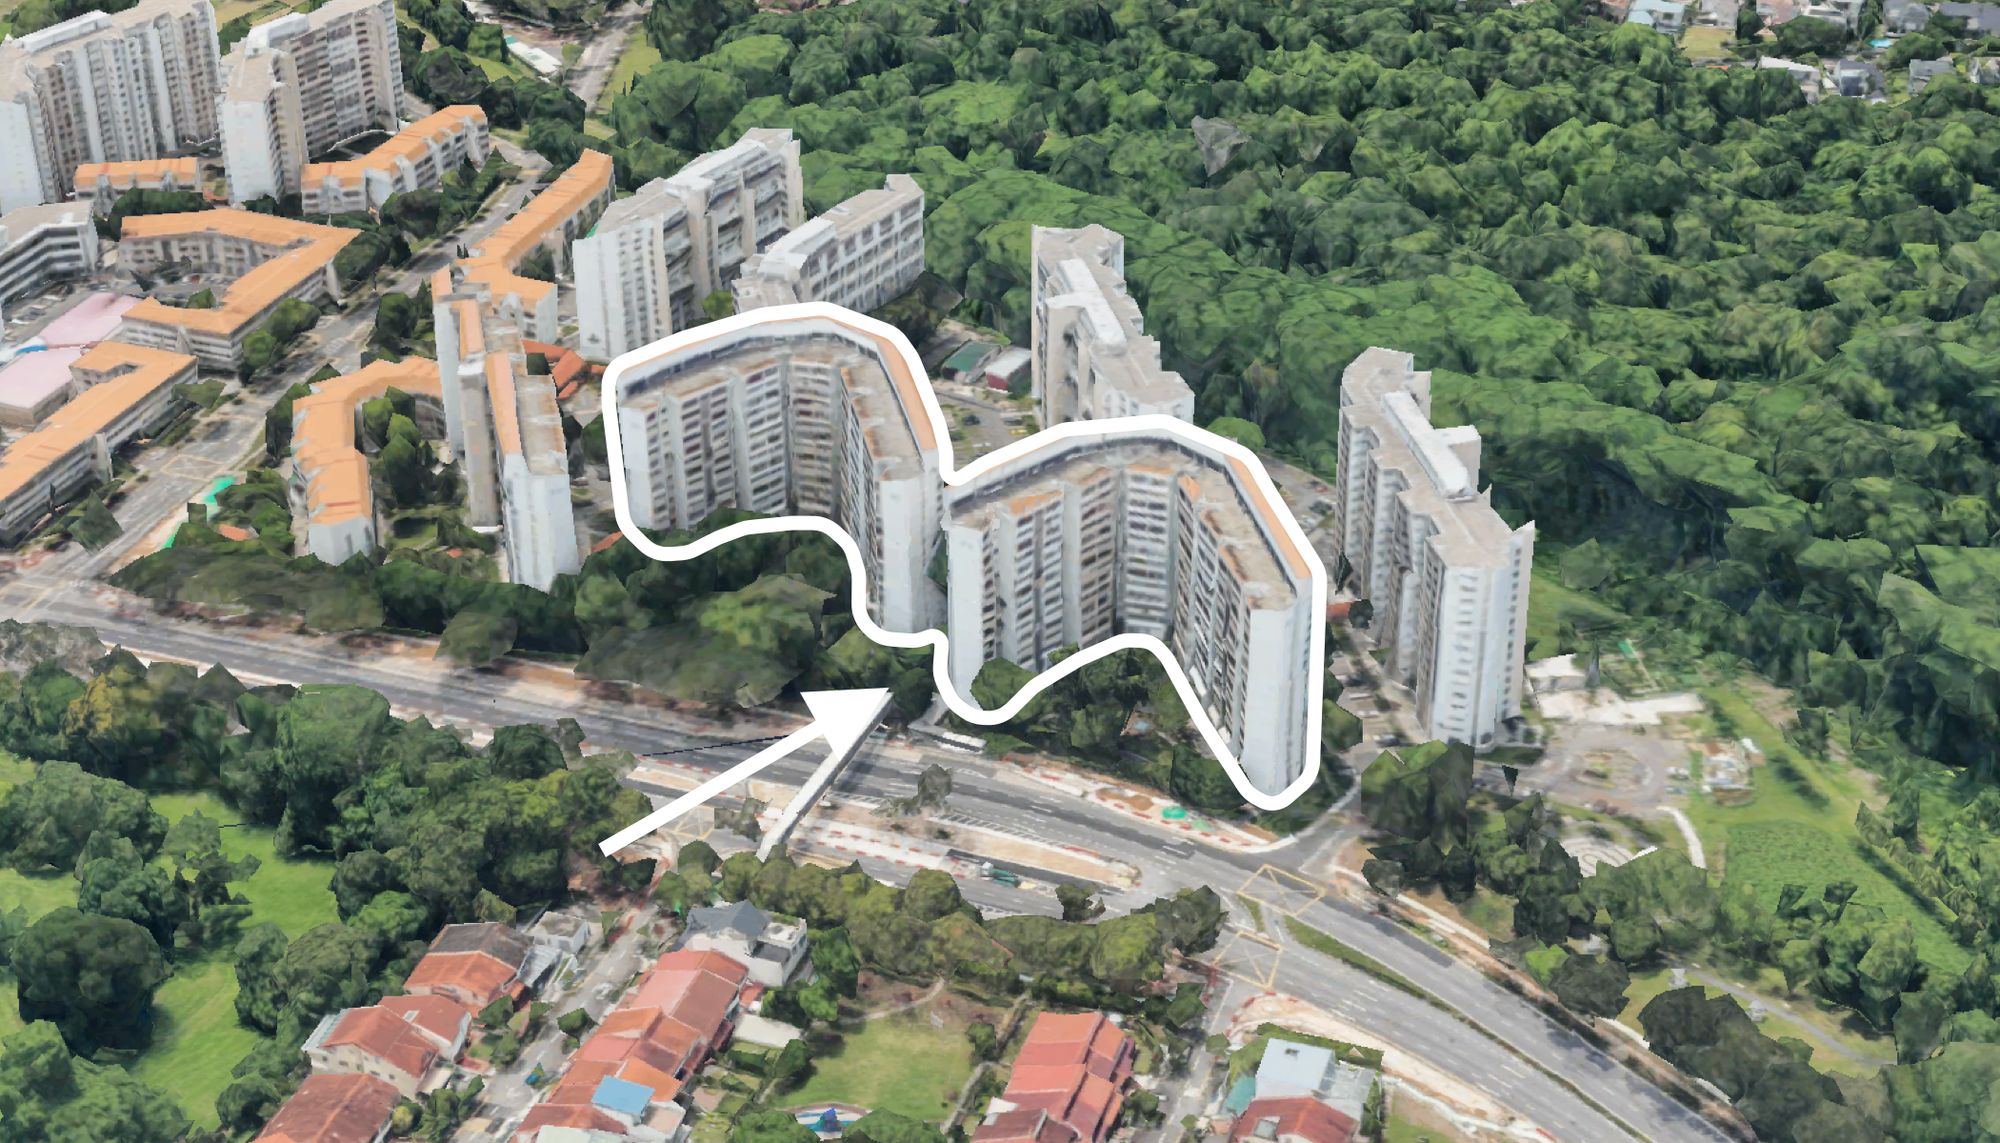
A rundown on Watertown
Watertown is an integrated, leasehold project in Punggol (District 19). It was launched in January 2012 (lease commencement date was 2011), with 992 units.
Average annualised returns throughout the project stand at 1.8%, with an average holding period of 8.2 years.
To examine whether those who bought earlier (or later) saw better gains, we analysed new sales, sub-sales, and resale transactions. We also broke it down into unit types, as the different layouts/sizes can yield different returns.
1-bedder units facing Punggol MRT

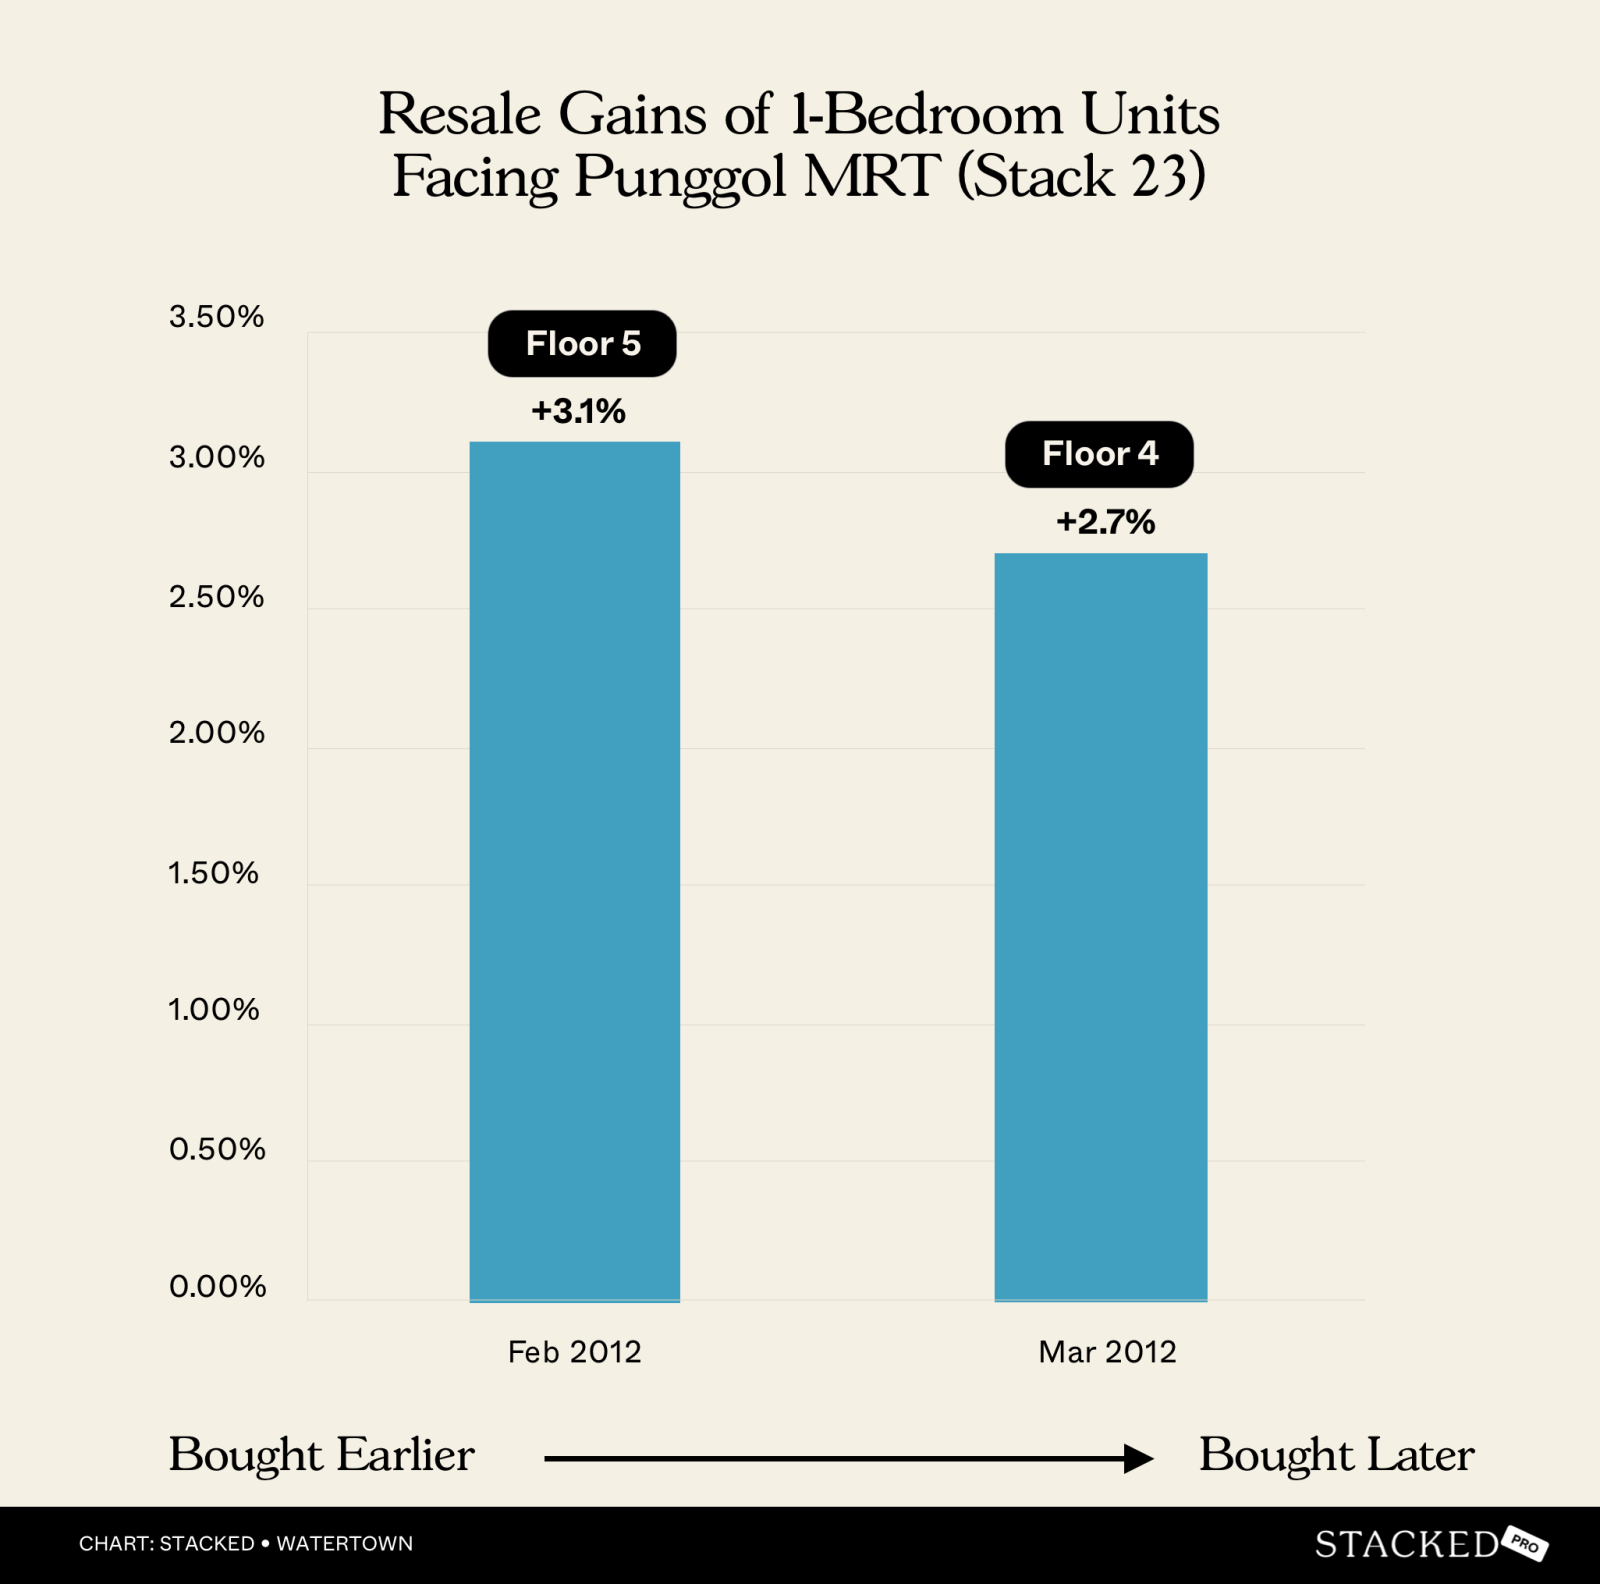
As the units with the lowest quantum, these were the first choices among the earliest buyers; almost all were sold within the first three months.
Here’s a look at two of the 1-bedders, which face toward the Punggol MRT station. The first of these (#05-23) was bought earlier in February 2012, while the other (#04-23) was bought in March 2012. The unit purchased roughly a month earlier saw a higher annualised return of 3.1 per cent.
Sold on | Address | Size | Bedrooms | Sale PSF | Profit/loss | Purchase PSF | Purchase date | Days | Years | Annualised (%) |
27 Aug 2020 | 69 Punggol Central #05-23 | 527 | 1 | 1,384 | 165,644 | 1,070 | 16 Feb 2012 | 3,115 | 8.5 | 3.1 |
8 Feb 2022 | 69 Punggol Central #04-23 | 527 | 1 | 1,450 | 178,644 | 1,112 | 30 Mar 2012 | 3,602 | 9.9 | 2.7 |
However, we should note that unit #04-23 was also bought around four per cent higher, which could also affect the result. We also note that the absolute gain ($178,644) is higher, despite a lower annualised return.
1-Bedder units with HDB facing

Sold on | Address | Size | Bedrooms | Sale PSF | Profit/loss | Purchase PSF | Purchase date | Days | Years | Annualised (%) |
3 Aug 2018 | 73 Punggol Central #14-65 | 527 | 1 | 1,589 | 170,791 | 1,265 | 16 Feb 2012 | 2,360 | 6.5 | 3.6 |
4 Apr 2022 | 73 Punggol Central #11-65 | 527 | 1 | 1,479 | 108,067 | 1,274 | 20 Feb 2012 | 3,696 | 10.1 | 1.5 |
12 Jul 2018 | 73 Punggol Central #14-66 | 527 | 1 | 1,422 | 43,000 | 1,340 | 23 Mar 2012 | 2,302 | 6.3 | 0.9 |
Unit #14-65 seems to suggest earlier buyers had an edge. #14-65 and #14-66 were bought only four days apart and sold at the same time. But despite this, #14-65 made a significantly higher amount ($130,000 more). This demonstrates how much of a difference the timing of a purchase can make in a new launch.
But the later buyers, particularly those who held their properties longer (e.g., #11-65, which was held for over a decade), still benefited from a steady increase in property value, even if the returns were moderate.
1-Bedder units facing Punggol Central

Sold on | Address | Size | Bedrooms | Sale PSF | Profit/loss | Purchase PSF | Purchase date | Days | Years | Annualised (%) |
30 Jun 2023 | 71 Punggol Central #06-45 | 603 | 1 | 1,523 | 152,315 | 1,270 | 9 Feb 2012 | 4,159 | 11.4 | 1.6 |
20 Aug 2021 | 71 Punggol Central #10-45 | 603 | 1 | 1,327 | 16,384 | 1,300 | 13 Feb 2012 | 3,476 | 9.5 | 0.2 |
8 Feb 2018 | 71 Punggol Central #09-45 | 603 | 1 | 1,340 | 23,974 | 1,301 | 14 Feb 2012 | 2,186 | 6.0 | 0.5 |
13 Feb 2019 | 71 Punggol Central #04-45 | 603 | 1 | 1,194 | -18,260 | 1,225 | 15 Feb 2012 | 2,555 | 7.0 | -0.4 |
7 Jun 2019 | 71 Punggol Central #05-45 | 603 | 1 | 1,294 | 41,590 | 1,225 | 17 Feb 2012 | 2,667 | 7.3 | 0.8 |
3 Apr 2018 | 71 Punggol Central #07-45 | 603 | 1 | 1,327 | 66,821 | 1,216 | 20 Feb 2012 | 2,234 | 6.1 | 1.4 |
Unfortunately, the pricing for this batch of 1-bedders doesn’t seem to have been very consistent. There is a general lowering of prices, which we can observe in the mid-to-late February period, but there’s nothing much to glean from here.
1-Bedder units with an inner facing

Sold on | Address | Size | Bedrooms | Sale PSF | Profit/loss | Purchase PSF | Purchase date | Days | Years | Annualised (%) |
2 Dec 2024 | 69 Punggol Central #09-32 | 570 | 1 | 1,706 | 281,568 | 1,212 | 13 Feb 2012 | 4,676 | 12.8 | 2.7 |
25 Jan 2019 | 69 Punggol Central #13-32 | 570 | 1 | 1,367 | 52,414 | 1,275 | 15 Feb 2012 | 2,536 | 6.9 | 1 |
29 Feb 2016 | 69 Punggol Central #08-32 | 570 | 1 | 1,288 | 33,710 | 1,229 | 17 Feb 2012 | 1,473 | 4.0 | 1.2 |
26 Sep 2023 | 69 Punggol Central #07-32 | 570 | 1 | 1,676 | 285,675 | 1,175 | 23 Feb 2012 | 4,233 | 11.6 | 3.1 |
Note that some of these units were labelled as “2-bedroom compact” by the developer. But they are really 1+Study units, and we’ll still consider them 1-bedders given the square footage.
Here we can see the earlier sellers, such as those in 2016 (#08-32) and 2019 (#13-32), saw more modest returns of around one per cent.
There were some interesting quirks here. Unit #08-32, for instance, sold for 1.4 per cent higher than #09-32, despite being one floor lower (the difference in sale dates was also just four days). This could likely be due to the state of furnishings/renovations of the unit.
1-bedders with other facings

Sold on | Address | Size | Bedrooms | Sale PSF | Profit/loss | Purchase PSF | Purchase date | Days | Years | Annualised (%) |
2 Mar 2018 | 73 Punggol Central #12-72 | 570 | 1 | 1,437 | 97,942 | 1,266 | 7 Feb 2012 | 2,215 | 6.1 | 2.1 |
2 Feb 2021 | 73 Punggol Central #07-72 | 570 | 1 | 1,430 | 160,963 | 1,148 | 13 Feb 2012 | 3,277 | 9.0 | 2.5 |
12 Dec 2023 | 73 Punggol Central #05-72 | 570 | 1 | 1,718 | 302,680 | 1,187 | 14 Feb 2012 | 4,319 | 11.8 | 3.2 |
23 Aug 2022 | 73 Punggol Central #06-72 | 570 | 1 | 1,460 | 188,873 | 1,129 | 16 Feb 2012 | 3,841 | 10.5 | 2.5 |
18 Jul 2022 | 73 Punggol Central #13-74 | 570 | 1 | 1,557 | 130,726 | 1,327 | 22 Mar 2012 | 3,770 | 10.3 | 1.6 |
More from Stacked
Should You Buy Lentor Mansion? A Pricing Review Comparing It With Lentoria, Lentor Modern, Lentor Hills Residences And Hillock Green
As we approach the tail end of the series of new launches in the Lentor estate, this price review of…
Again, do note that the developer officially labels these as 2-bedder compact, although the square footage shows they’re really 1+Study units.
If we compare #06-72 and #13-74, we can see they have almost the same 10+ year holding period, but #06-72 managed to nab a profit of around $60,000 more than #13-74. You’ll also see that #06-72 was bought about a month earlier, showing a much stronger outcome for this earlier buyer.
Later sellers also appear to have achieved slightly better outcomes. #12-72, which was an earlier seller, managed only a small profit of $97,942 with an annualised return of 2.1 per cent. Conversely, the most recent seller (#05-72 in December 2023) managed a profit of $302,680 and an annualised return of 3.2 per cent.
That said, there are some oddities among this group of units. Some of them are hard to explain. #12-72, for example, has a pool facing; but it sold for five per cent less than #13-74, which has a view blocked by one of the towers.
#05-72 sold just one day after #07-72; but it fetched a price 3.4 per cent higher, even though it’s on a lower floor.
Next, let’s look at the 2-bedder units, starting with the ones facing Punggol MRT

Sold on | Address | Size | Bedrooms | Sale PSF | Profit/loss | Purchase PSF | Purchase date | Days | Years | Annualised (%) |
8 Dec 2023 | 63 Punggol Central #05-06 | 915 | 2 | 1,648 | 490,139 | 1,112 | 14 Feb 2012 | 4,315 | 11.8 | 3.4 |
1 Aug 2023 | 63 Punggol Central #08-06 | 915 | 2 | 1,667 | 486,544 | 1,135 | 14 Feb 2012 | 4,186 | 11.5 | 3.4 |
1 Dec 2021 | 63 Punggol Central #12-06 | 915 | 2 | 1,497 | 248,025 | 1,226 | 14 Feb 2012 | 3,578 | 9.8 | 2.1 |
24 Jul 2019 | 65 Punggol Central #05-11 | 915 | 2 | 1,333 | 303,165 | 1,002 | 14 Feb 2012 | 2,717 | 7.4 | 3.9 |
30 Oct 2018 | 65 Punggol Central #06-11 | 915 | 2 | 1,290 | 242,745 | 1,024 | 14 Feb 2012 | 2,450 | 6.7 | 3.5 |
23 Aug 2019 | 65 Punggol Central #08-11 | 915 | 2 | 1,379 | 305,308 | 1,045 | 16 Feb 2012 | 2,745 | 7.5 | 3.8 |
6 Aug 2019 | 65 Punggol Central #09-11 | 915 | 2 | 1,379 | 295,950 | 1,055 | 16 Feb 2012 | 2,728 | 7.5 | 3.6 |
Units here were mostly all purchased at the same time (14th and 16th February 2012), which is less useful to us (none in this batch really bought earlier or later). We can see the higher floor units fetched higher prices, but that’s also nothing unusual.
2-bedders with HDB facing

Sold on | Address | Size | Bedrooms | Sale PSF | Profit/loss | Purchase PSF | Purchase date | Days | Years | Annualised (%) |
14 Feb 2019 | 81 Punggol Central #06-90 | 958 | 2 | 1,357 | 154,239 | 1,196 | 16 Feb 2012 | 2,555 | 7.0 | 1.8 |
21 Nov 2022 | 81 Punggol Central #07-90 | 958 | 2 | 1,681 | 445,686 | 1,215 | 20 Feb 2012 | 3,927 | 10.8 | 3.1 |
23 Mar 2021 | 81 Punggol Central #05-90 | 958 | 2 | 1,336 | 173,400 | 1,155 | 21 Feb 2012 | 3,318 | 9.1 | 1.6 |
9 Jul 2018 | 81 Punggol Central #09-90 | 958 | 2 | 1,352 | 124,112 | 1,222 | 21 Feb 2012 | 2,330 | 6.4 | 1.6 |
20 May 2015 | 81 Punggol Central #10-90 | 958 | 2 | 986 | -207,803 | 1,203 | 29 Feb 2012 | 1,176 | 3.2 | -6.0 |
The most interesting unit here is #10-90. It would have appeared to be a value buy for the initial purchaser at $1,203 psf. This is the second-cheapest purchase price despite being on the highest floor. However, it was the worst performer, incurring a loss of around $200,000.
The reason may be reflected in the unusually short holding period of 3.2 years. Besides having limited time to appreciate, such a short holding period may indicate a seller in urgent need to liquidate, or a seller affluent enough to ignore losses.
Now let’s look at the 3-bedder units, starting with those that face internally

Sold on | Address | Size | Bedrooms | Sale PSF | Profit/loss | Purchase PSF | Purchase date | Days | Years | Annualised (%) |
27 Jul 2018 | 79 Punggol Central #08-83 | 1,173 | 3 | 1,406 | -123,860 | 1,512 | 3 Oct 2012 | 2,123 | 5.8 | -1.2 |
15 Jun 2023 | 79 Punggol Central #05-83 | 1,173 | 3 | 1,628 | 216,824 | 1,443 | 15 Oct 2012 | 3,895 | 10.7 | 1.1 |
15 Jul 2021 | 79 Punggol Central #07-84 | 1,195 | 3 | 1,339 | 23,100 | 1,320 | 24 Jan 2013 | 3,094 | 8.5 | 0.2 |
9 Jul 2019 | 79 Punggol Central #08-84 | 1,195 | 3 | 1,354 | 60,600 | 1,303 | 8 Mar 2013 | 2,314 | 6.3 | 0.6 |
10 Jun 2022 | 79 Punggol Central #10-84 | 1,195 | 3 | 1,527 | 209,800 | 1,352 | 11 Mar 2013 | 3,378 | 9.3 | 1.3 |
And these are the 3-bedders with an external facing

Sold on | Address | Size | Bedrooms | Sale PSF | Profit/loss | Purchase PSF | Purchase date | Days | Years | Annualised (%) |
14 Sep 2020 | 67 Punggol Central #07-13 | 1,173 | 3 | 1,321 | -108,613 | 1,414 | 12 Mar 2012 | 3,108 | 8.5 | -0.8 |
9 Oct 2017 | 67 Punggol Central #12-13 | 1,173 | 3 | 1,385 | -121,351 | 1,488 | 12 Mar 2012 | 2,037 | 5.6 | -1.3 |
21 Feb 2018 | 67 Punggol Central #05-13 | 1,173 | 3 | 1,400 | 71,440 | 1,339 | 31 May 2012 | 2,092 | 5.7 | 0.8 |
28 Sep 2023 | 67 Punggol Central #13-13 | 1,259 | 3 | 1,671 | 176,300 | 1,531 | 31 Jan 2013 | 3,892 | 10.7 | 0.8 |
Units purchased earlier (in March 2012) and sold between 2017 to 2020 didn’t do too well. This is reflected in the negative from (#07-13) and (#12-13).
#12-13 appears to have done badly because it exited during a weaker point in the market (October 2017). Conversely, #13013 exited during much stronger market conditions in September 2023, when it rode the waves of post-COVID recovery. This enabled a profit of $176,300 despite having a higher initial purchase price of $1,531 psf.
3-bedders facing Punggol Waterway

Sold on | Address | Size | Bedrooms | Sale PSF | Profit/loss | Purchase PSF | Purchase date | Days | Years | Annualised (%) |
26 Jul 2021 | 63 Punggol Central #02-07 | 1,259 | 3 | 1,350 | 307,974 | 1,105 | 8 Feb 2012 | 3,456 | 9.5 | 2.1 |
17 Jan 2020 | 61 Punggol Central #12-02 | 1,130 | 3 | 1,471 | 177,561 | 1,314 | 13 Feb 2012 | 2,895 | 7.9 | 1.4 |
30 Aug 2021 | 61 Punggol Central #11-02 | 1,130 | 3 | 1,557 | 323,491 | 1,271 | 15 Feb 2012 | 3,484 | 9.5 | 2.2 |
11 Apr 2017 | 63 Punggol Central #03-07 | 1,130 | 3 | 1,194 | 120,434 | 1,088 | 16 Feb 2012 | 1,881 | 5.2 | 1.8 |
8 Jun 2016 | 63 Punggol Central #07-07 | 1,130 | 3 | 1,150 | 45,458 | 1,110 | 17 Feb 2012 | 1,573 | 4.3 | 0.8 |
7 Sep 2020 | 61 Punggol Central #02-01 | 1,173 | 3 | 1,364 | 131,286 | 1,252 | 20 Feb 2012 | 3,122 | 8.6 | 1 |
25 Nov 2020 | 61 Punggol Central #03-02 | 1,130 | 3 | 1,416 | 286,688 | 1,162 | 21 Feb 2012 | 3,200 | 8.8 | 2.3 |
9 May 2022 | 61 Punggol Central #10-02 | 1,130 | 3 | 1,699 | 497,100 | 1,259 | 22 Feb 2012 | 3,729 | 10.2 | 3 |
10 May 2018 | 61 Punggol Central #07-01 | 1,119 | 3 | 1,375 | 150,760 | 1,240 | 23 Feb 2012 | 2,268 | 6.2 | 1.7 |
By now, the trend has become quite clear. Earlier buyers can perform better, but if they hold their units for longer periods. Also, it’s not always the point at which they bought, but the strength of the market when they sold.
The outperformers like #10-02 and #11-02 mainly had longer holding periods, and strong exit prices of $1,699 psf and $1,557 psf respectively. This is, again, due to 2021 and 2022 making strong exit points, following the housing shortage and post-pandemic recovery.
Next, let’s look at 4-bedder units

Sold on | Address | Size | Bedrooms | Sale PSF | Profit/loss | Purchase PSF | Purchase date | Days | Years | Annualised (%) |
14 Jul 2023 | 79 Punggol Central #11-85 | 1,485 | 4 | 1,885 | 485,548 | 1,558 | 9 Mar 2012 | 4,144 | 11.4 | 1.7 |
4 Jun 2024 | 79 Punggol Central #08-85 | 1,367 | 4 | 1,975 | 589,700 | 1,544 | 3 Nov 2012 | 4,231 | 11.6 | 2.1 |
16 Nov 2017 | 79 Punggol Central #05-85 | 1,367 | 4 | 1,455 | -144,200 | 1,560 | 14 Nov 2012 | 1,828 | 5.0 | -1.4 |
22 Dec 2014 | 79 Punggol Central #09-85 | 1,367 | 4 | 1,317 | -376,600 | 1,592 | 16 Nov 2012 | 766 | 2.1 | -8.7 |
The late buyers (e.g., those who purchased around November 2012, such as with #11-85 and #8-85) seemed to have done better. This is, again, related also to the holding period rather than just their point of entry; they appear to have benefited from longer-term appreciation (9.5 to 11.6 years).
For the earlier buyers, those who bought earlier in 2012 and sold within two to five years (#05-85 and #09-85) saw losses, despite buying at roughly a similar price psf to the earlier buyers.
Overall observations
You’ll notice we divided the units based on their facing as well as their size.
This is to show that, in general, units with better views commanded a higher price psf during the project launch. However, prices for some of these units were adjusted downward later in the launch (for reasons discussed below). For example, some of the 3-bedders facing Punggol Waterway saw lower-floor units sold earlier, at higher prices than high-floor units sold later.
We can also see the effect of market conditions playing a big role, arguably a bigger one than when exactly you buy.
In the case of Watertown, the property market was still euphoric during the first year of the launch (2012). It was cruising toward a market peak in 2013, after which a slew of cooling measures hit. Right after that, developers began to lower prices to clear units, which could have burned some of the earliest buyers.
(For the developer, the profits already earned from the higher-priced initial sales would balance out the losses incurred from the later, discounted units.)
Coming back to market conditions: those who sold their units most recently, during the post-pandemic surge of 2020 to 2023, would have seen greater profits than those who sold before 2018. This is because, for 15 consecutive quarters from Q4 2013 to Q2 2017, the property market was in a downturn due to the cooling measures.
So the point of exit (when you sell) is just as important as when you buy. Sometimes, an apparent value-buy (e.g., a unit with a sold early-bird discount) may not generate as much profit as pricier units, simply because it was sold at a bad time.
Next, we’ll look at The Clement Canopy, to see if earlier or later buyers benefited more. You can also follow us on Stacked to check out in-depth reviews of these new and resale properties. If you’d like to get in touch for a more in-depth consultation, you can do so here.
Ryan J
A seasoned content strategist with over 17 years in the real estate and financial journalism sectors, Ryan has built a reputation for transforming complex industry jargon into accessible knowledge. With a track record of writing and editing for leading financial platforms and publications, Ryan's expertise has been recognised across various media outlets. His role as a former content editor for 99.co and a co-host for CNA 938's Open House programme underscores his commitment to providing valuable insights into the property market.Read next from Property Investment Insights

Property Investment Insights 2 Reasons Costa Del Sol Underperformed—Despite Its Seafront Location And Family Appeal

Property Investment Insights 7 Reasons Reflections at Keppel Bay Underperformed—Despite Its Iconic Design and Prime Waterfront Location

Property Investment Insights Why Seletar Park Residence Underperformed—Despite Its District 28 Location And Large Unit Sizes

New Launch Condo Analysis LyndenWoods Condo Pricing Breakdown: We Compare Its Pricing Against Bloomsbury Residences, Normanton Park & One-North Eden
Latest Posts

Landed Home Tours We Tour Freehold Landed Homes Within Walking Distance of Somerset MRT From $6 Million

Singapore Property News SERS: Singapore’s $94,000 Housing Lottery Or A Bad Bet?

New Launch Condo Reviews Canberra Crescent Residences Review: Affordable Family-Focused Condo Starting From $1,880 Psf

On The Market The 5 Biggest HDB Flats You Can Buy For About $1 Million Today

Homeowner Stories I’ve Lived in Twin VEW for Four Years: What It’s Like Living Without an MRT Nearby

Editor's Pick The Surprising Truth Behind Singapore’s Longest Held Condos – And Why Residents Refuse To Sell After 20 Years

Singapore Property News Clementi 4-Room HDB Sold For Record $1.28 Million – Here’s What Makes It So Special

Editor's Pick This New River Valley Condo Starts At $1.2M: And It’s Cheaper Than Some City-Fringe Launches

New Launch Condo Analysis This New 376-Unit Condo In Sembawang Might Be The Best Pick For Young Families: Here’s Why

Editor's Pick Where To Find Freehold Semi-D Landed Homes From $4.4m: Touring Gilstead Road

Singapore Property News The Trick to Seeing Through a Condo Showflat (Most Buyers Never Do This)

Editor's Pick Can You Really Buy A House In Italy For €1? Here’s What Singaporeans Should Know

On The Market 5 Cheapest 5-Room HDB Flats Near MRT Stations From $550k

On The Market Inside A Luxury Waterfront Home at The Residences At W Singapore Sentosa Cove

New Launch Condo Analysis Singapore’s Tallest New Condo Comes With the Highest Infinity Pool: Is The 63-Storey Promenade Peak Worth A Look?

Hi, I paid for the pro subscription but unable to see the article again….
Hi Clarence! Sorry to hear that. We’ve made some changes to our system – please attempt to reload this page again. If you have any further issues, kindly drop us an email 🙂