


When it comes to housing, it’s easy to get caught up in the headlines about skyrocketing prices or cooling measures. But to truly understand the shifts in HDB flat affordability, it’s essential to dig deeper than just average price tags or one-off sales records. By examining how the proportion of flats sold within each price band has changed over the years, we can gain a clearer picture of the market’s trajectory. This approach allows us to see how price movements have evolved across different flat sizes, providing a more nuanced perspective on affordability and market trends since 2000.
The challenge for many buyers today isn't access to information.
It's interpreting that information in a way that makes sense for their finances, goals, and stage of life.
Over time, that's also why we decided to work with agents who shared the same data-driven and advisory-led approach behind our editorial, consultants who could help readers think through decisions more objectively, rather than simply push transactions.
Today, the team has worked with more than 2,000 clients across over $5B in property transactions.
Price movements of 3-room flats

Between 2000 and 2006, it was very rare for a 3-room flat to go above a quantum of $100,000. Over 90 per cent of 3-room flats were below this price, and it’s probable that the remaining few were highly desirable, central area flats.
Over the next four years, however, prices of 3-room flats skyrocketed, alongside their other counterparts (see below). As it’s often drilled into us that bigger flats are more valuable, it can be shocking to learn just how much the “less desirable” 3-room flat prices could rise in such a short time:
By 2010, we found zero 3-room flats that were still below $100,000. By that point, about two-thirds of 3-room flats were selling between $200,000 to $300,000. And by 2013, which was one of the property market peaks, only five per cent of 3-room flats were between $200,000 to $300,000; instead, most of the 3-room flats now sold for between $300,000 to $400,000.
So in a span of just seven years, the average resale prices of 3-room flats leapt from $100,000 or under, to a price band of between $300,000 to $400,000.
What happened to cause this?
One possible reason could be the rock-bottom interest rates we saw after the Global Financial Crisis (2008/9). Immediately following the crisis, interest rates could be as low as one per cent, and homeowners who used SOR loans (no longer available for housing today) even saw negative interest rates at one point in 2011.
To some degree, we also speculate if the introduction of the Design, Build, and Sell Scheme (DBSS), which was introduced in March 2005, had something to do with it. These flats, built by private developers, were priced higher than normal flats; and they had a range of unit sizes including 3-room flats. But we can’t say whether or not that’s a fact.
After the 2013 peak, however, policy measures kicked in to lower prices
This is also something you’ll see with the other flat sizes below. Two major policy changes were made, in 2013 and 2014 respectively. In 2013, HDB introduced the Mortgage Servicing Ratio (MSR). This capped the maximum monthly loan repayments to 30 per cent of the borrowers’ income. This is something still in effect today.
Then in 2014, HDB stopped publishing Cash Over Valuation (COV) data, and would only give the valuation after the sale price was agreed. Previously, COV was a given: you would get the flat valuation, then haggle over the COV. But with the new change, you would have to negotiate on the price first, and then HDB would deliver the valuation. I.e. there would only be COV if you negotiated a price so high, it was above the valuation.
From 2014 to 2019, resale flattps://stackedhomes.com/cooling-measures-show-minimal-impact-on-resale-flat-prices-in-2022-whats-going-on/”>resale flat prices went on a downhill slide. For 3-room flats, we can see a huge portion fell back to the previous price band: $200,000 to $300,000 once again became the norm; about 60 per cent of 3-room flats were back in this range by 2019.
In 2020, the year of Covid, there were only faint warning signs that a shift was about to happen.
Prices started to creep up. The proportion of 3-room flats in the $200,000 to $300,000 range went from 60 per cent of transactions to just 55 per cent. Not in itself a huge deal, but the deluge would come in the aftermath of Covid.
Between 2020 and 2024, there was a massive housing shortage, one that affected both HDB and private properties. As remote work became a new norm, and young Singaporeans rushed out to find their own homes, prices soared across the board.
In a mere four-year period, the proportion of 3-room flats in the $200,000 to $300,000 range fell from 55 per cent, to just two per cent. 82 per cent of 3-room flats were now in the $300,000 to $500,000 range.
2024 is still not as bad as the 2013 peak when over 90 per cent of 3-room flats fell into that price range. But you can see that a lot of the cooling between 2014 and 2019 was undone in just four years.
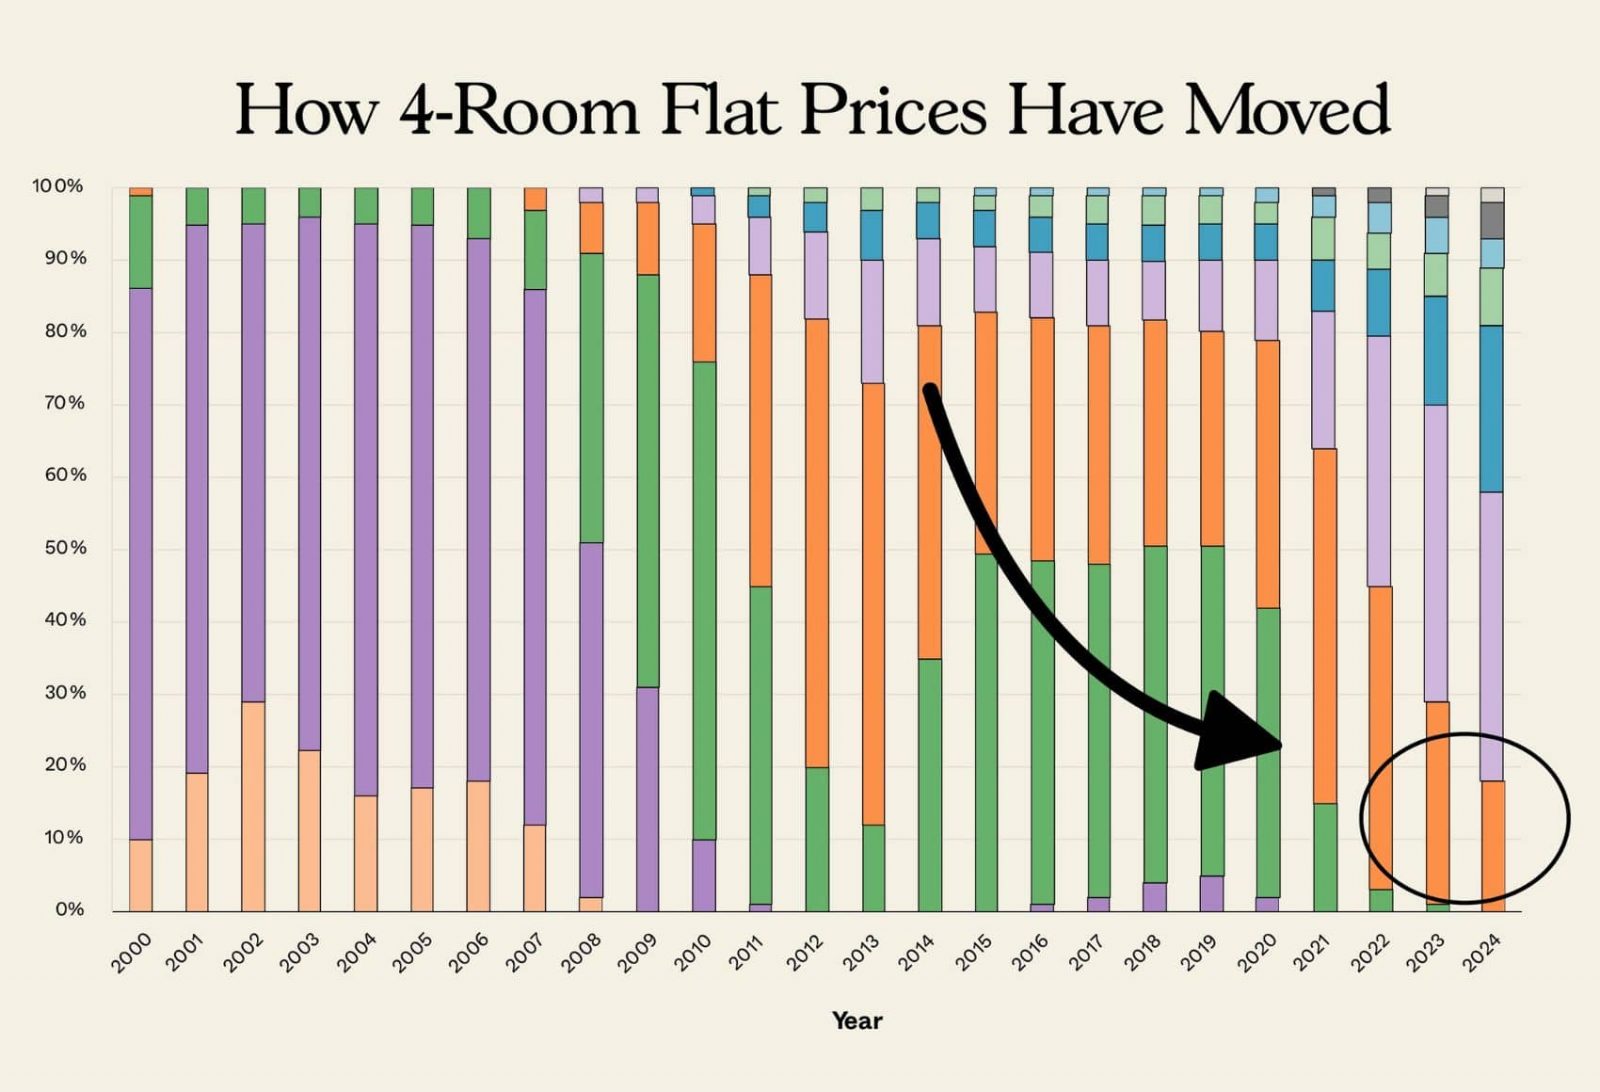
Price movements of 4-room flats

This is the category that matters most to the average Singaporean, as 4-room flats are the most ubiquitous form of housing.
Prior to 2007, it was uncommon for a 4-room flat to cost more than $200,000 to $300,000. Only about a quarter of all transactions were higher than this price range, and these were probably flats in prime central areas.
A very high price, such as between $400,000 to $500,000, could still be found; but only about one per cent of the transactions were this high. For reference, even Pinnacle @ Duxton, one of the best-known and priciest HDB projects, had 4-room units selling at just between $345,000 to $439,000 at the time.
From 2007 to 2010 though, flat prices started to rise, due to the aforementioned low interest rates. By 2010, only about 10 per cent of 4-room flats would transact as low as $200,000 to $300,000. And by 2012, there were zero 4-room flats that were so cheap.
By the 2013 peak, the typical price of a 4-room flat was in the $400,000 to $500,000 range; this made up 61 per cent of all transactions. At this point, some 4-room flats reached $700,000 to $800,000 already, but they made up just three to four per cent of the transactions; still rare.
The great price decline and rebound
As mentioned above, policy measures sent resale flat prices into a tailspin between 2013 to 2019. During this period, 4-room flats fell back into the $300,000 to $400,000 range, with this price band making up almost half of the transactions. Some 4-room flats still transacted at $400,000 to $500,000, but they now made up only about a third of the total transactions.
The rebound after Covid, however, was even steeper than the decline. Prices started to rise in 2020, and by 2024, around 40 per cent of transactions fell into the $500,000 to $600,0000 range. 23 per cent of 4-room flats rose to the $600,000 to $700,000 range, and roughly one-in-five of these flats cost over $700,000 today.
And the number of 4-room flats selling for below half a million today? A mere 14 per cent.
Price movements of 5-room flats

Before 2007, resale 5-room flats showed divergent price movements, compared to their smaller counterparts.
Back in 2000, the typical price of a 5-room flat was $300,000 to $400,000. These made up around 64 per cent of total transactions. Then from 2000 to 2006, 5-room flats actually became cheaper. By 2006, most 5-room flats (63 per cent) only cost $200,000 to $300,000.
Why? We haven’t any idea – there doesn’t seem to be a clear reason. But almost as if it was a minor glitch, the prices shot back up over the next three years; and by 2010, there were zero five-room flats that were so cheap. The average price of a 5-room flat by 2010 was between $300,000 to $600,000 (accounting for 91 per cent of transactions), with half of these falling into the upper end of the range ($400,000 to $500,000).
In the run-up to the 2013 peak however, the majority of 5-room flats had risen to between $400,000 to $700,000, which accounted for 88 per cent of the transactions (around half of these fell into the higher $500,000 to $600,000 price range).
A big price surge going into the present
By 2019, 5-room flats in the $300,000 to $500,000 range made up 56 per cent of the transactions. And by 2024, about 43 per cent of all 5-room flats are in the $700,000+ range.
The minimum you could expect to pay now is half a million dollars for a 5-room flat, and most (60 per cent) will cost between $600,000 to $800,000.
Price movements of executive flats

It seems as if size is in vogue today, but wasn’t between 2000 and 2006; because just like 5-room flats, executive flats actually fell in price during those years. In 2006, you could have bought an executive flat for just $300,000 to $400,000; this price band made up 79 per cent of transactions. At the time, 99 per cent of all executive flats sold for $500,000 or below!
Again though, we saw huge changes after the financial crisis. In 2007, just before the crisis, 67 per cent of executive flats were priced between $300,000 to $400,000. By 2010, only a shocking two per cent of executive flats were still that cheap. The new norm had become $400,000 to $600,000, accounting for 86 per cent of transactions. And by 2013, about half of all the executive flat transactions had reached $600,000 to $700,000.
The policy changes in 2013/14 then kicked in, and like all flat sizes we see a drop: about half (52 per cent) of executive flat transactions had fallen back to the $400,000 to $600,0000 range.
This downturn proved incredibly short-lived. By 2021, the post-Covid crunch kicked in, and only a measly one per cent of executive flats were still as cheap as $400,000.
By 2023, only one per cent of executive flats sold for under $500,000.
Today the minimum you can expect to pay is about $600,000. Even then, it’s probably for a rather old one, and only seven per cent of executive flats are cheap enough to be in the $600,000 to $700,000 range. The norm today is now $700,000 to $900,000, accounting for 61 per cent of transactions so far this year. Around one-third of executive flats sold for $900,000 or more.
So are resale flats still affordable?
If we were to extend the time frame even further, we might be less surprised at how fast prices rose over 25 years. It’s happened before: in our parent’s or grandparent’s era, for instance, we also saw home prices accelerate very quickly, as Singapore transitioned to first world status.
But history is an abstraction to someone who needs a resale flat right now.
In a more immediate sense, median income in Singapore rose during the period of declining prices (from an average of $3,705 in 2013, to $4,563 in 2019). During this particular stretch, resale flats would have been much more affordable; and it was certainly helped by the lower interest rates than we’re facing today.
However, the rapid price increases after Covid may have shifted the tides again; and if the pace continues unabated, we may well see a serious drop in affordability. One of the other factors we can discern here, by the way, is the episodic memory of the general public: we’ve met some homeowners who experienced the rapid price gains from 2020 to 2024, but seem to have forgotten the long period of decline from 2013 to 2019.
We can’t afford another four years like the post-Covid crunch, but it’s also not the first time the authorities have had to rein in prices. And as the 2013 to 2019 decline proves, they can do it when they want it to be.
At Stacked, we like to look beyond the headlines and surface-level numbers, and focus on how things play out in the real world.
If you’d like to discuss how this applies to your own circumstances, you can reach out for a one-to-one consultation here.
And if you simply have a question or want to share a thought, feel free to write to us at stories@stackedhomes.com — we read every message.

4 Comments
Thank you for the article. A very interesting statistical view of price movements and why the price moves happened the way it did. One factor which could have affected price movements would be the official narratives given by the government at each point in time. For example, when it was said that HDB homes were an “investment” (rather than a roof over your head) which made home owners richer, property prices moved up (I think). There was a subsequent announcement in the 2000’s about HDB values going to zero when their leases expired. Could that have affected price movements somewhat too? Could you map those events into your timelines to see if there is any correlation to the prices?
Has anyone shared that young couples have to pay market prices for flats offered in Sale of Balanced Flats Exercise? I heard that from a colleague. Anyone experienced that?
If that is true and not rumor, what are the effects that come along such policy or practice?