The Surprising Truth Behind Singapore’s Longest Held Condos – And Why Residents Refuse To Sell After 20 Years
I used to think a condo no one sells must be amazing – some secret paradise where even the biggest en-bloc offers would be met with rejections and Hokkien swear words, because the place is just so irreplaceable. But because I love disappointment, I asked Stacked’s data experts to dig through 30 years of data, thinking it should reveal all of Singapore’s hidden gems. What I found was a lot more nuanced, and a little crushing:
Looking up the “stickiest” condos
By “stickiest”, I originally meant the condos where we see (1) the longest holding period, and (2) just looking at how many people have actually sold, compared to the total number of units. The lower that number, the “stickier” the place. But anyway:
| Projects | Completed | Days Held | Years Held | Transactions | Total Units |
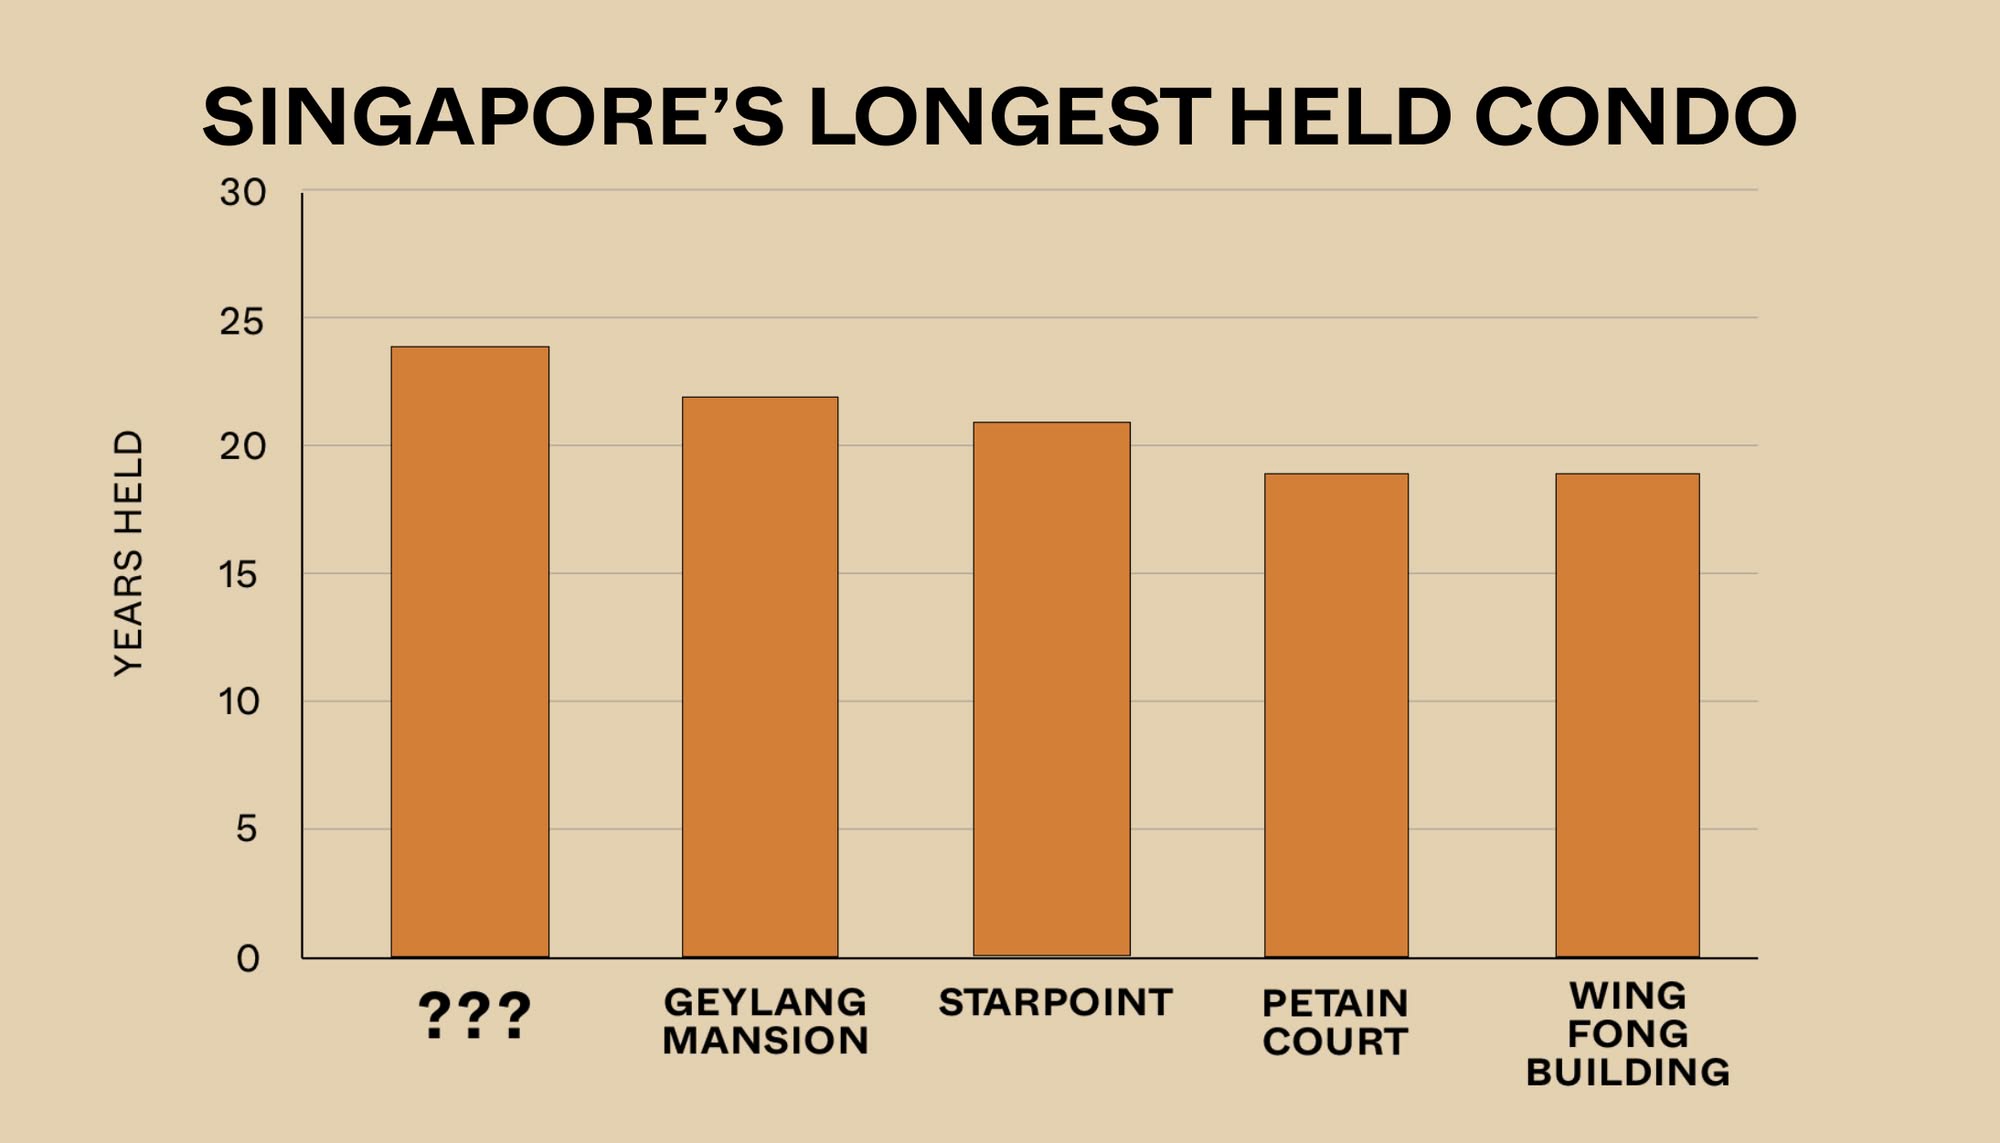
| VALLEY MANSION | – | 8562 | 24 | 1 | 50 |
| GEYLANG MANSION | 1983 | 8072 | 22 | 1 | 27 |
| STARPOINT | – | 7752 | 21 | 1 | 8 |
| PETAIN COURT | 1994 | 6984 | 19 | 4 | 72 |
| WING FONG BUILDING | – | 6761 | 19 | 1 | 218 |
| DAISY LODGE | 1986 | 6496 | 18 | 8 | 24 |
| CALIN MANSIONS | 1992 | 6200 | 17 | 2 | 5 |
| GILSTEAD COURT | 1978 | 6009 | 17 | 11 | 48 |
| EASTPAC BUILDING | 1983 | 5942 | 16 | 1 | 7 |
| OCTAVILLE | 1990 | 5831 | 16 | 2 | 9 |
| RISING COURT | 1974 | 5599 | 15 | 2 | 6 |
| MADEIRA COURT | 1995 | 5594 | 15 | 4 | 12 |
| THE FERNHILL | 2009 | 5327 | 15 | 1 | 25 |
| GUILLEMARD APARTMENT | 1985 | 5180 | 14 | 2 | 146 |
| D’ MARINE | 2005 | 5169 | 14 | 1 | 16 |
| TOH YI COURT | 1985 | 5055 | 14 | 4 | 18 |
| SUNBIRD VIEW | 1994 | 5031 | 14 | 3 | 15 |
| NEWTON LODGE | 1990 | 4973 | 14 | 9 | 16 |
| SEAVIEW POINT | 1994 | 4852 | 13 | 10 | 34 |
| SAPPHIRE COURT | 1992 | 4852 | 13 | 2 | 11 |
| YONG SIAK COURT | 1987 | 4835 | 13 | 4 | 9 |
| NEW COURT | 2000 | 4751 | 13 | 1 | 20 |
| PEPPERMINT GROVE | 1997 | 4730 | 13 | 5 | 15 |
| DUKU APARTMENTS | 1998 | 4719 | 13 | 2 | 8 |
| LE GAMBIR | 1989 | 4680 | 13 | 3 | 8 |
| CANNAVILLE | 1993 | 4672 | 13 | 6 | 16 |
| THE BOULEVARD RESIDENCE | 2005 | 4668 | 13 | 1 | 46 |
| BASSEIN COURT | 1993 | 4646 | 13 | 12 | 28 |
| NASSIM 9 | 2002 | 4582 | 13 | 5 | 8 |
| LION TOWERS | – | 4465 | 12 | 9 | 52 |
| JAYA TOWER | 1979 | 4436 | 12 | 9 | 28 |
| SERENE VIEW MANSIONS | 1984 | 4392 | 12 | 7 | 18 |
| WILLYN VILLE | 1982 | 4366 | 12 | 16 | 37 |
| GALAXY TOWERS | 1989 | 4322 | 12 | 22 | 60 |
| CENTRINA | 2011 | 4311 | 12 | 1 | 8 |
| ROSE MAISON | 2001 | 4300 | 12 | 5 | 13 |
| DORSET MANSIONS | 1992 | 4300 | 12 | 4 | 7 |
| RIVER VALLEY COURT | 1994 | 4295 | 12 | 4 | 18 |
| GREENLANE APARTMENTS | 1994 | 4285 | 12 | 2 | 9 |
| POH HENG COURT | 1986 | 4276 | 12 | 6 | 10 |
| KATONG APARTMENTS | 1995 | 4233 | 12 | 6 | 20 |
| WU DE BUILDING | 1990 | 4221 | 12 | 6 | 10 |
| TELOK KURAU MANSIONS | – | 4212 | 12 | 1 | 9 |
| KISMIS COURT | 1985 | 4188 | 12 | 9 | 26 |
| BOTANIC GARDENS VIEW | – | 4175 | 11 | 49 | 143 |
| HOA NAM BUILDING | 1983 | 4174 | 11 | 7 | 36 |
| SALLIM LODGE | 1995 | 4166 | 11 | 2 | 12 |
| MOON MANSION | 1981 | 4161 | 11 | 2 | 6 |
| UNI BUILDING | 1983 | 4159 | 11 | 3 | 12 |
| TORIE MANSIONS | 1993 | 4137 | 11 | 3 | 12 |
| SERAN COURT | 1984 | 4098 | 11 | 5 | 4 |
| LE SHANTIER | 1997 | 4077 | 11 | 21 | 32 |
| HOLLAND SUITES | 1999 | 4066 | 11 | 6 | 15 |
| HOLLAND COURT | – | 4041 | 11 | 4 | 22 |
| KILAT COURT | 1997 | 4041 | 11 | 13 | 21 |
| SUNSET LODGE | 1978 | 4039 | 11 | 16 | 30 |
| ROSE COURT | 1973 | 4020 | 11 | 2 | 8 |
| SIGLAP LODGE | 1996 | 3986 | 11 | 2 | 8 |
| SUN COURT | 1985 | 3954 | 11 | 8 | 17 |
| HILLS APARTMENT | 1975 | 3949 | 11 | 6 | 10 |
| GARDEN APARTMENTS | 1984 | 3946 | 11 | 8 | 20 |
| WAN THO LODGE | 1966 | 3946 | 11 | 12 | 12 |
| ASTRIDVILLE | 1985 | 3924 | 11 | 10 | 18 |
| LA MEYER | 1994 | 3912 | 11 | 16 | 30 |
| LE WILKIE | 1996 | 3891 | 11 | 11 | 41 |
| KEMBANGAN COURT | 1994 | 3888 | 11 | 8 | 0 |
| ORCHID APARTMENTS | 1977 | 3888 | 11 | 18 | 52 |
| SERAYA VILLE | 1991 | 3873 | 11 | 29 | 31 |
| SIN CHUAN GARDEN | 1983 | 3851 | 11 | 8 | 64 |
| FABER GARDEN CONDOMINIUM | 1984 | 3849 | 11 | 32 | 233 |
| KINGSGROVE | 1992 | 3843 | 11 | 16 | 32 |
| PENG’S COURT | 1985 | 3834 | 11 | 5 | 8 |
| GIDEON’S LODGE | 1992 | 3816 | 11 | 4 | 6 |
| WEST-N | 2008 | 3797 | 10 | 2 | 14 |
| KIM KEAT GARDENS | 2003 | 3776 | 10 | 5 | 13 |
| MARGATE POINT | 1998 | 3771 | 10 | 6 | 15 |
| THE WINDSOR | 1988 | 3719 | 10 | 84 | 160 |
| PIN MANSIONS | 1992 | 3691 | 10 | 13 | 16 |
| BIRCHWOOD MANSIONS | 1990 | 3670 | 10 | 9 | 24 |
| KOVAN CREST | 1999 | 3668 | 10 | 5 | 20 |
| CAMBRIDGE VILLAGE | 1983 | 3666 | 10 | 10 | 28 |
| GEMINI APARTMENTS | 1989 | 3659 | 10 | 12 | 12 |
| JOO CHIAT MANSIONS | 1986 | 3658 | 10 | 20 | 24 |
| SPANISH VILLAGE | 1987 | 3647 | 10 | 54 | 226 |
| CLYDESWOOD | 1993 | 3644 | 10 | 21 | 36 |
| GOLDHILL TOWERS | 1989 | 3637 | 10 | 10 | 50 |
The condos with the longest holding periods tend to be… well, the ones that have simply been around the longest. No surprises there. So most of what you see here are older projects, which is why the list reads like a roll call of 70s and 80s project names.
Also worth noting: we’re only looking at transactions where caveats were lodged. That usually happens when there’s a mortgage involved. If someone paid in full cash and never lodged anything? They won’t show up here. And yes, it’s also possible that somewhere out there is a condo so “sticky” nobody has ever sold a single unit – ironically, that would mean it doesn’t even make this list.
Another limitation is that we only have data from 1995 onwards. There are people who bought in the 70s, 80s and have held until today without selling, hoping for an en-bloc (Orchard Towers, I’m looking at you). These would have fallen through the cracks too.
Disclaimers aside, the above are the top condos where owners have held on for at least 10 years on average.
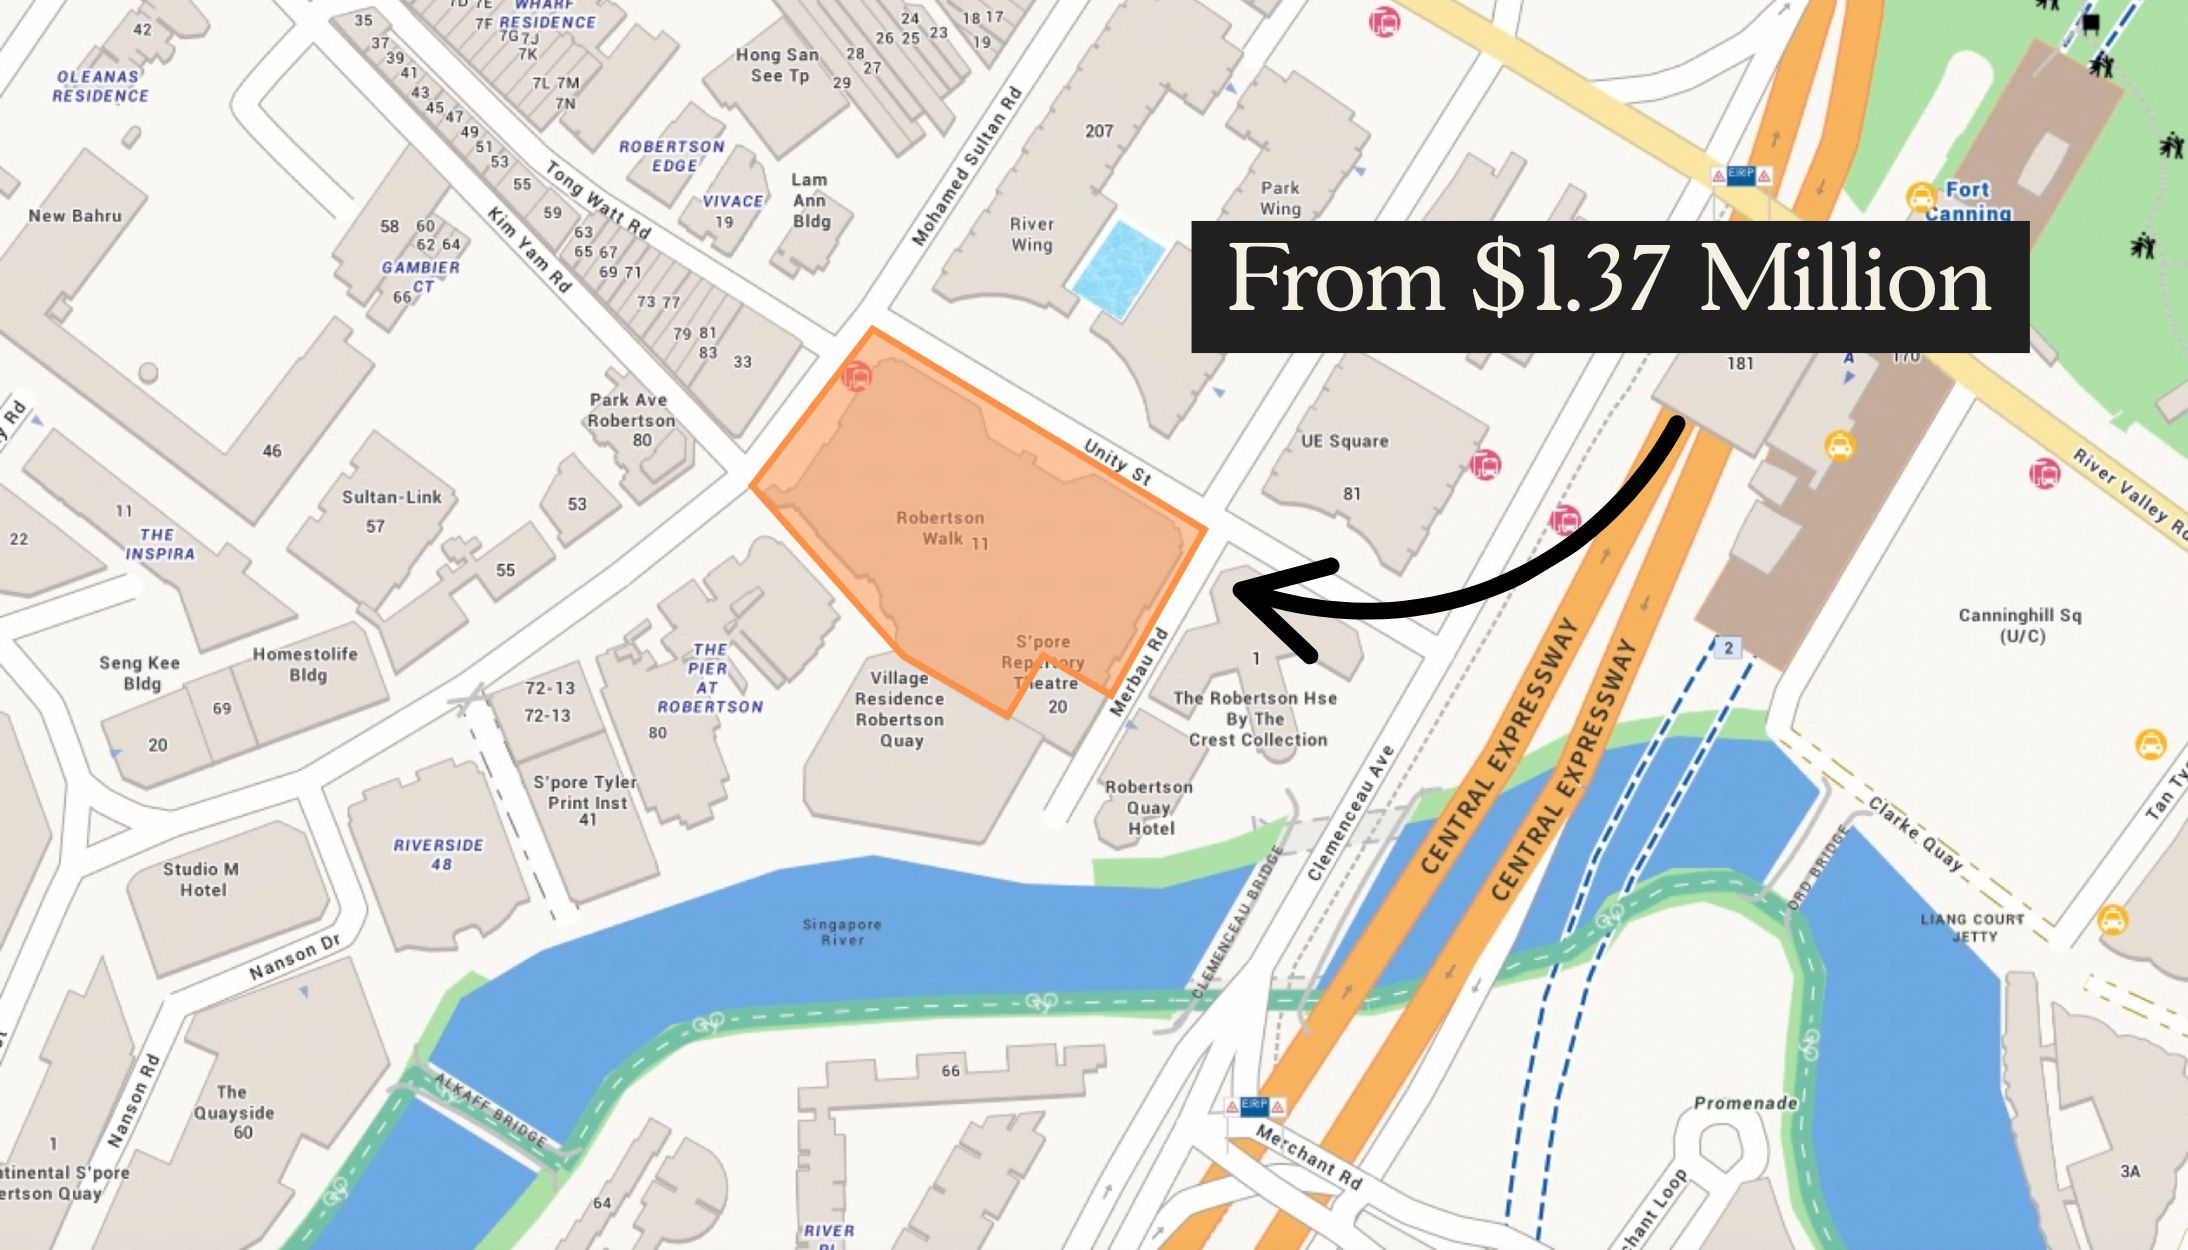
Many of these projects, unfortunately, are not the most impressive or liveable spaces. Take Valley Mansion: sure, it’s got space and a prime spot by Orchard, but reviews say it’s looking “old,” needs “a good paint job,” has no lift, and suffers from heavy traffic. Not exactly luxury-living material.
Then there’s Geylang Mansion: a tiny 14‑unit freehold block in a gritty pocket of Geylang. It’s often described as a “rental bargain,” but more honestly described as “within the Red Light area.”
Going through the projects on the list, two things stand out:
First, many of these are ageing walk-up apartments or plain apartments with no amenities. They’re more spacious than your typical condo units, but that’s it – there are no amenities (though some may still have security).
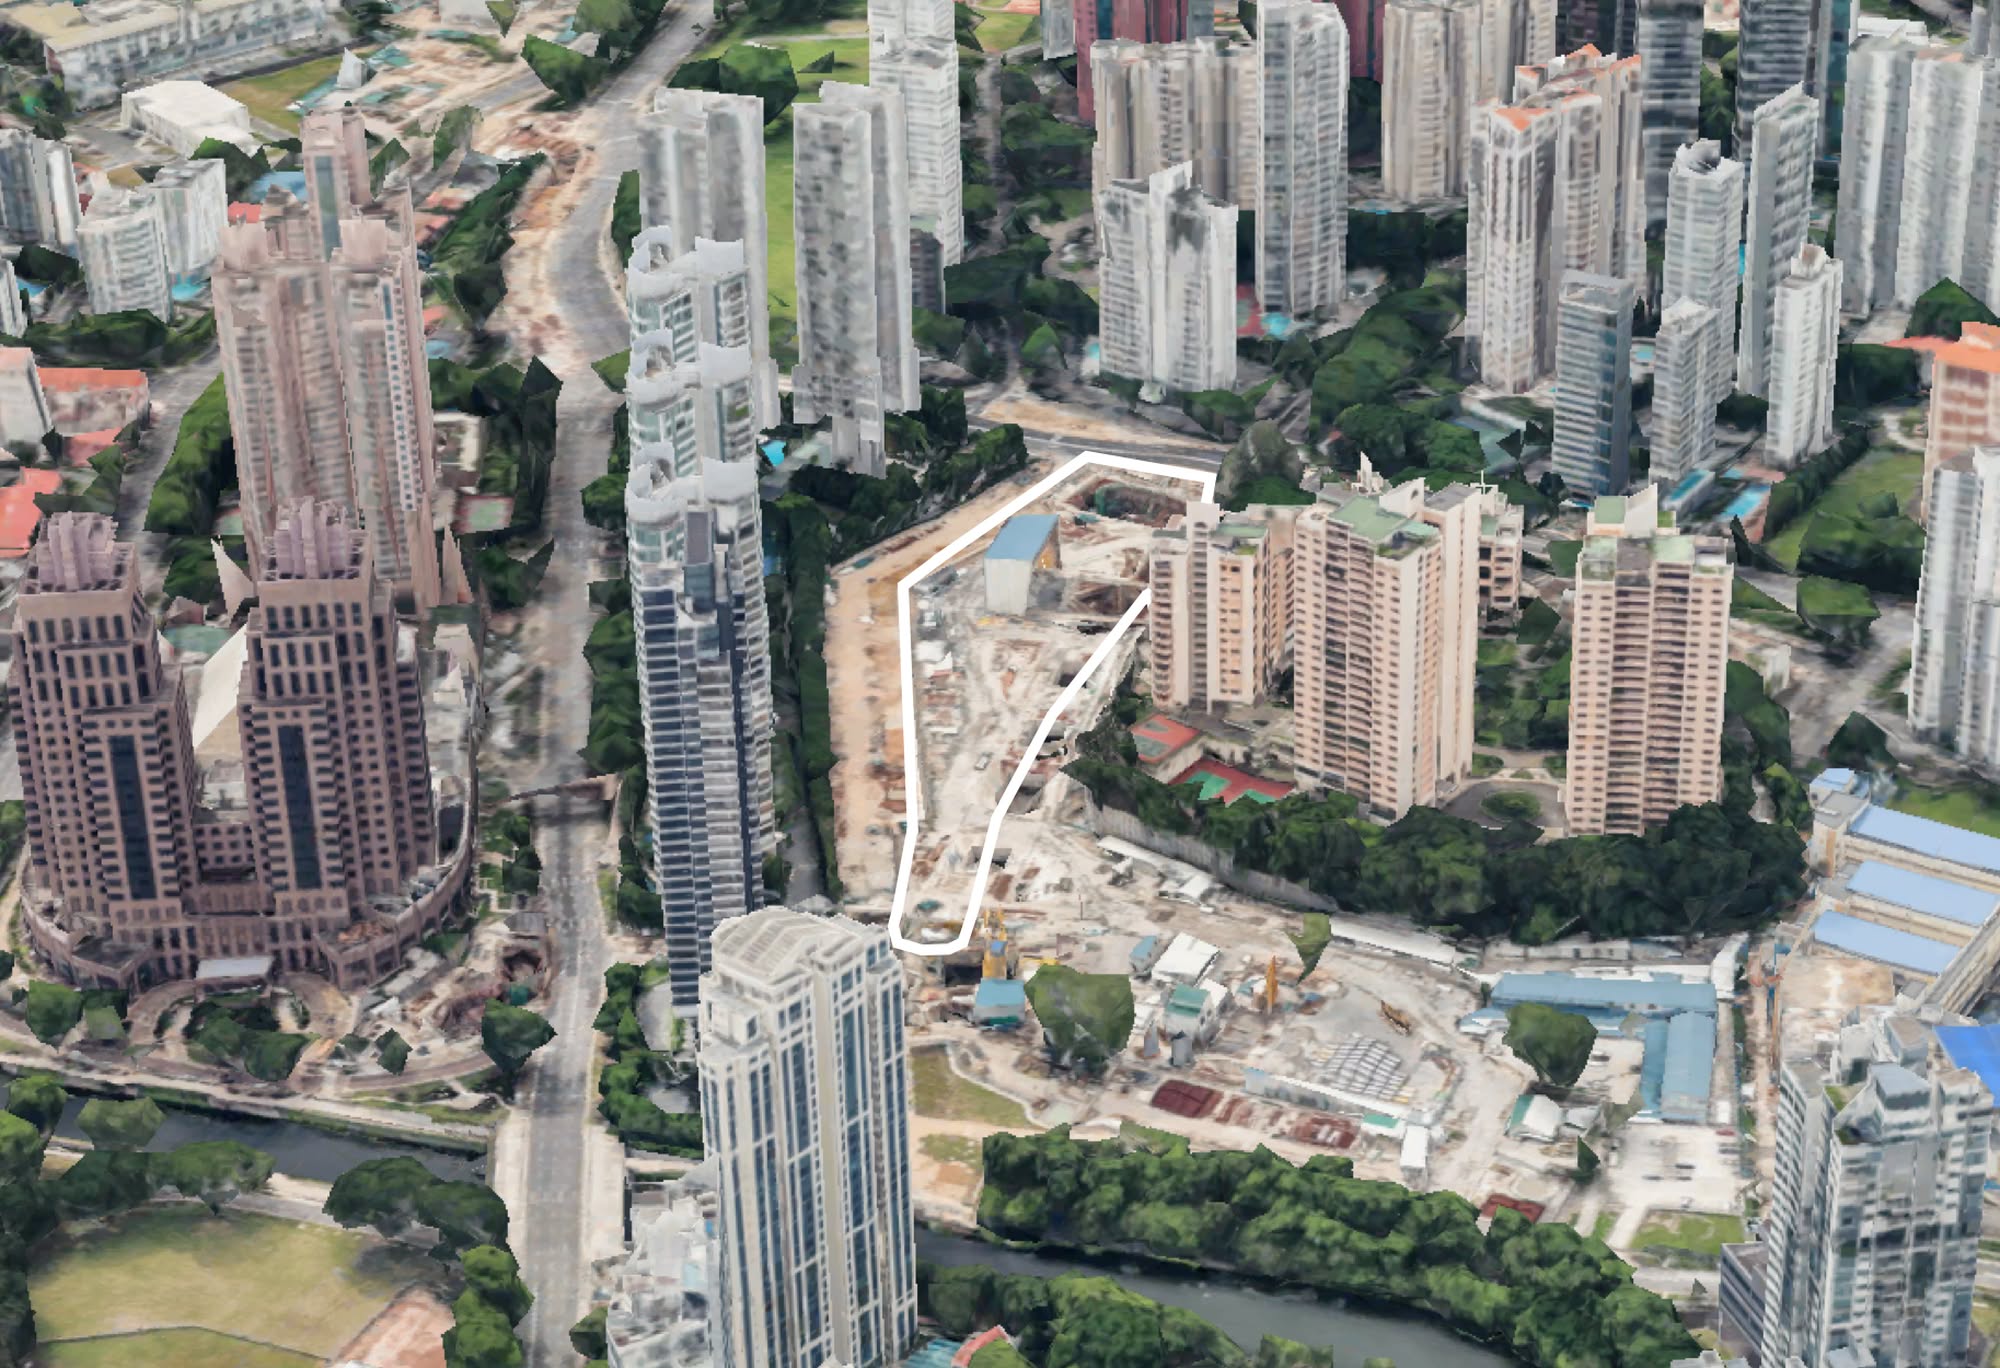
Second, many, though not all, have “rickety property in a great location” traits. Botanic Gardens View, for instance, really is across from the Botanic Gardens and Napier MRT station, and the land there is likely worth a fortune, even if the existing project is clearly dated.
This suggests three things: the first is that many of the owners are likely holding on for an en-bloc sale. The second is that, if they stay on, it will probably be due to issues of space: these older units tend to be built quite large, and the sale proceeds will fall short of a similarly big, newer condo unit today.
The third possibility is that many owners are now living elsewhere and are okay with simply collecting rental income to supplement their needs until the very end. So they’re just not interested in selling anyway.
But okay, what if we only looked from when the SSD was implemented?
So maybe I wasn’t being fair. After all, some of these old projects have been around since we still used pagers. Of course, they’d clock decades of holding periods.
So to level the playing field, I looked only at condos sold after the Seller’s Stamp Duty (SSD) kicked in on 4 January 2011. This does two things:
1. It weeds out the older projects that naturally have longer holding periods, just because of age.
2. It also cuts out the flippers who bought with zero intention of actually living there.
What I got was a slightly fresher crop, though still far from a list of dream homes. Here are the ones that clocked the highest average holding periods, even in the post‑SSD era:
| Projects | Completed | Days Held | Years Held | Sum of number of units | Total Units |
| SIGLAP LODGE | 1996 | 4978 | 14 | 1 | 8 |
| NEW COURT | 2000 | 4751 | 13 | 1 | 20 |
| CRANE COURT | 2004 | 4736 | 13 | 1 | 12 |
| CENTRO MANSIONS | 2005 | 4715 | 13 | 1 | 14 |
| THE HUNTINGTON | 2000 | 4522 | 12 | 1 | 42 |
| JERVOIS GROVE | 1986 | 4493 | 1 | 18 | |
| BALESTIER REGENCY | 1990 | 4488 | 12 | 1 | 72 |
| KINGSTON TERRACE | 1994 | 4422 | 12 | 1 | 24 |
| CENTRINA | 2011 | 4311 | 12 | 1 | 8 |
| CARLYX GREEN | 2007 | 4292 | 12 | 1 | 12 |
| LA MEYER | 1994 | 4189 | 12 | 1 | 30 |
| SUNSET LODGE | 1978 | 4172 | 11 | 1 | 30 |
| MEYA LODGE | 2005 | 4102 | 11 | 1 | 12 |
| MONARCHY APARTMENTS | 1997 | 4073 | 11 | 1 | 39 |
| THE MORNINGTON | 2004 | 3989 | 11 | 1 | 28 |
| NEWTON LODGE | 1990 | 3976 | 11 | 1 | 16 |
| R66 APARTMENTS | 2007 | 3852 | 11 | 3 | 34 |
| THE MORNINGSIDE | 1992 | 3841 | 11 | 3 | 79 |
| D – HERITAGE APARTMENTS | 2003 | 3829 | 11 | 1 | 19 |
| ETON COURT | 2004 | 3826 | 11 | 1 | 13 |
| HILLCREST PARK | – | 3734 | 10 | 1 | 7 |
| LE WILKIE | 1996 | 3718 | 10 | 2 | 41 |
| GLAMOUR VILLE | 2003 | 3715 | 10 | 1 | 13 |
| EQUATORIAL APARTMENTS | 1981 | 3685 | 10 | 1 | 61 |
| THE EQUATORIAL | 2001 | 3649 | 10 | 3 | 95 |
Honestly, it’s not a big difference. Many of these were still built before 2000, and almost all of them are small, boutique projects with hardly any transactions to begin with.
In fact, every single one of them has fewer than 100 units. Which makes sense: when you only have 12 neighbours, it doesn’t take much for the numbers to look “sticky.”
So that brings us to the next way of looking at things: instead of just how long people hold on, let’s look at the number of transactions relative to the total number of units.
And here, digging through the full, unfiltered list of transactions since 1995, some more names start to show up.
| Projects | Average Days Held | Years Held | Transactions | Total Units | Tnx vs Supply |
| WING FONG BUILDING | 6761 | 19 | 1 | 218 | 0.46% |
| GUILLEMARD APARTMENT | 5180 | 14 | 2 | 146 | 1.37% |
| VALLEY MANSION | 8562 | 23 | 1 | 50 | 2.00% |
| THE BOULEVARD RESIDENCE | 4668 | 13 | 1 | 46 | 2.17% |
| GEYLANG MANSION | 8072 | 22 | 1 | 27 | 3.70% |
| THE FERNHILL | 5327 | 15 | 1 | 25 | 4.00% |
| NEW COURT | 4751 | 13 | 1 | 20 | 5.00% |
| PETAIN COURT | 6984 | 19 | 4 | 72 | 5.56% |
| D’ MARINE | 5169 | 14 | 1 | 16 | 6.25% |
Here, Wing Fong Building and Guillemard Apartment stand out as having arguably the most “loyal” owners, especially given they’re both sizeable developments with over 100 units. That makes their near‑nonexistent sales all the more impressive.
However, asking around on the ground revealed this wasn’t so much due to quality. Wing Fong Building has some rather rough mentions on the internet, too, and agents told me it’s mainly a matter of rental: even if it’s not the prettiest location, and a bit run down, it still gets a stream of steady tenants. In the end, it’s still conveniently close to town (about six minutes’ drive to Suntec City, by my estimates and speeding ticket).
Guillemard Apartment had the same qualities: low vacancy rates because it’s very convenient, and within walking distance to Mountbatten MRT station; but it’s visibly ageing and lacks facilities.
So again, it seems the owners are either landlords happy to collect rent indefinitely, or are just holding on for an en-bloc windfall. Note that they’re not wrong about the possibility of that windfall either, as Guillemard Apartment, for one, is in a sweet spot.
Why not just filter out the oldest condos and then find the longest holding periods in the most recent projects?
Because it takes a long time for me to reach reasonable ideas like that, but thanks, let’s do that.
The bulk of our data keeps skewing toward creaky walk‑ups and 80s relics. So let’s filter it again: ONLY condos completed between 2010 and 2015.
Why this window? Anything older than 2010 would already qualify as “old” by now, and anything newer than 2015 hasn’t really had enough time to tell. This way, we’re looking at developments with at least a decade on the clock, but still modern enough that no one’s buying it purely for land and en-bloc dreams.
| 2010 | Days Held | Years Held | Transactions | Units | Sale / Supply |
| BELLE VUE RESIDENCES | 3267 | 9 | 12 | 176 | 6.82% |
| ZEDGE | 3211 | 9 | 9 | 102 | 8.82% |
| GRAND DUCHESS AT ST PATRICK’S | 2775 | 8 | 12 | 121 | 9.92% |
| 2011 | Days Held | Years Held | Transactions | Units | Sale / Supply |
| PARC SOPHIA | 2905 | 8 | 15 | 152 | 9.87% |
| THE PEAK@BALMEG | 2827 | 8 | 8 | 181 | 4.42% |
| NEWTON EDGE | 2574 | 7 | 8 | 103 | 7.77% |
| CLOVER BY THE PARK | 2569 | 7 | 32 | 616 | 5.19% |
| 2012 | Days Held | Years Held | Transactions | Units | Sale / Supply |
| ROCHELLE AT NEWTON | 2762 | 8 | 11 | 129 | 8.53% |
| JARDIN | 2469 | 7 | 13 | 140 | 9.29% |
| DOUBLE BAY RESIDENCES | 2212 | 6 | 26 | 646 | 4.02% |
| 2013 | Days Held | Years Held | Transactions | Units | Sale / Supply |
| MARINA BAY SUITES | 3455 | 10 | 2 | 221 | 0.90% |
| GOODWOOD RESIDENCE | 2280 | 6 | 12 | 210 | 5.71% |
| QUESTA @ DUNMAN | 2183 | 6 | 8 | 122 | 6.56% |
| 2014 | Days Held | Years Held | Transactions | Units | Sale / Supply |
| GILSTEAD TWO | 2433 | 7 | 3 | 110 | 2.73% |
| CASA CAMBIO | 2247 | 6 | 9 | 198 | 4.55% |
| LINCOLN SUITES | 2079 | 6 | 5 | 176 | 2.84% |
| CITYSCAPE @FARRER PARK | 2076 | 6 | 10 | 250 | 4.00% |
| CYAN | 2023 | 6 | 10 | 280 | 3.57% |
| ALTEZ | 2000 | 6 | 7 | 339 | 2.06% |
| 2015 | Days Held | Years Held | Transactions | Units | Sale / Supply |
| ROBIN RESIDENCES | 2468 | 7 | 1 | 134 | 0.75% |
| OUE TWIN PEAKS | 2351 | 6 | 45 | 463 | 9.72% |
| SKYLINE RESIDENCES | 2145 | 6 | 16 | 283 | 5.65% |
| REGENT RESIDENCES | 2086 | 6 | 15 | 180 | 8.33% |
| CRADELS | 1956 | 5 | 9 | 125 | 7.20% |
| LEEDON RESIDENCE | 1952 | 5 | 22 | 381 | 5.77% |
| SKY HABITAT | 1884 | 5 | 30 | 509 | 5.89% |
| WOODHAVEN | 1879 | 5 | 14 | 337 | 4.15% |
Looking at the newer batch of condos (2010–2015), there’s no obvious pattern to explain why some seem stickier than others. You get a mix of boutique projects, big names, and even some luxury developments, all showing relatively low sales activity and reasonably long holding periods.
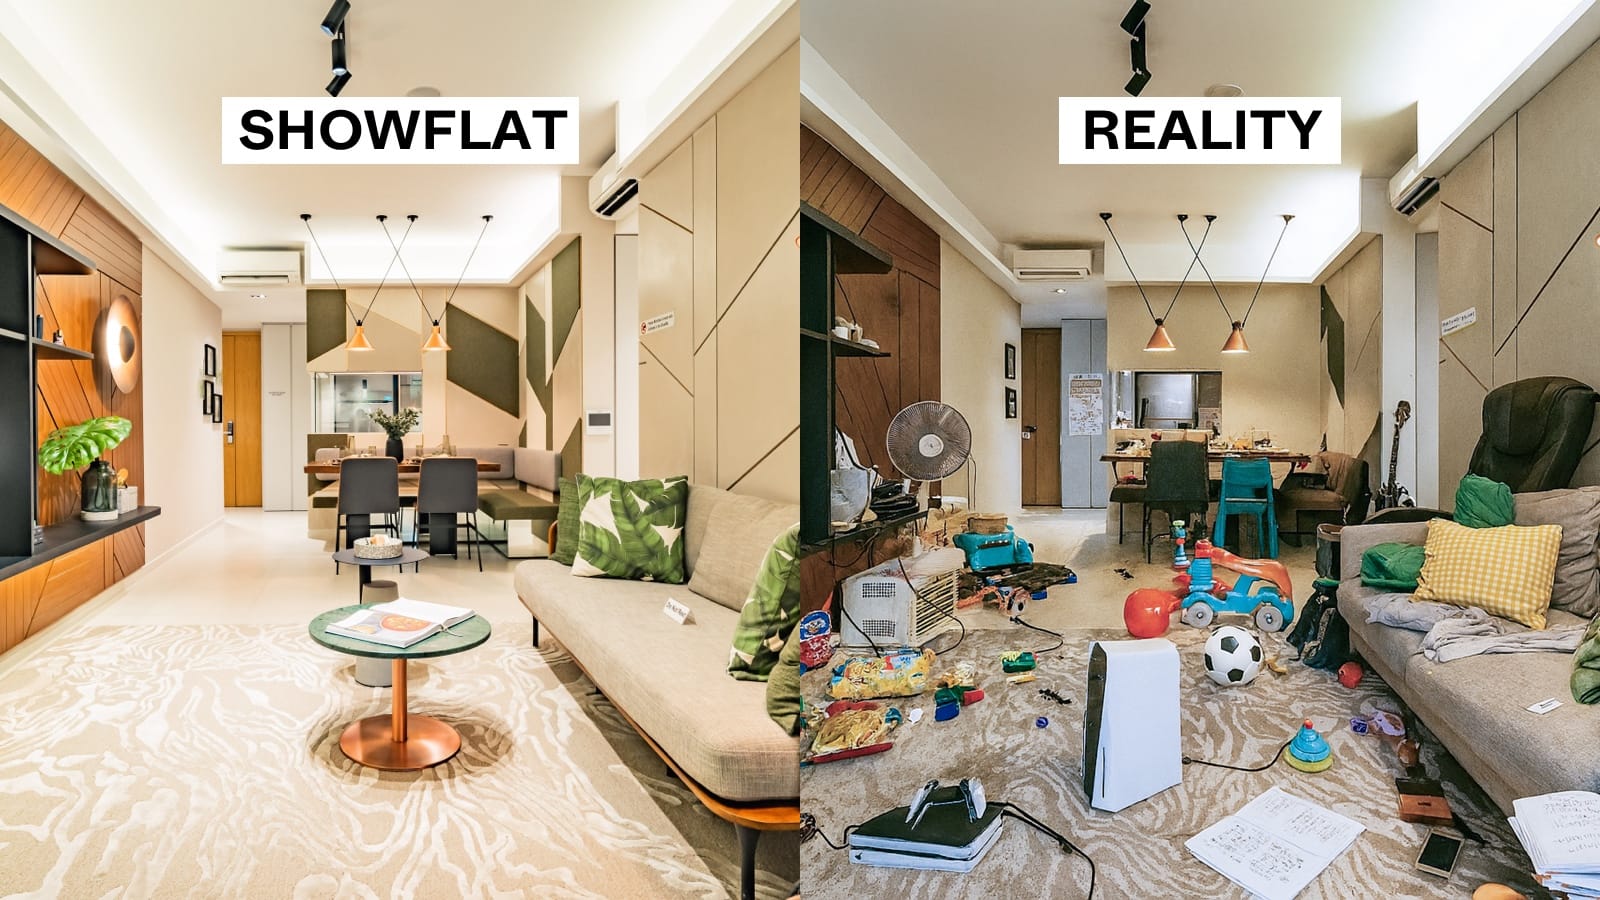
But here’s a possibility: maybe some of these owners aren’t staying because they love it. Maybe they’re staying because they can’t afford to leave.
To shed some more light on this, we should look at the proportion of resale transactions that actually made a loss. Because nothing says “sticky” like being trapped by negative equity.
| Project | Total Resale To Resale | Total Profitable | Total Unprofitable | Total Breakeven | Proportion Unprofitable |
| CASA CAMBIO | 9 | 9 | 0 | 0 | 0% |
| CRADELS | 9 | 9 | 0 | 0 | 0% |
| CYAN | 10 | 10 | 0 | 0 | 0% |
| GOODWOOD RESIDENCE | 12 | 12 | 0 | 0 | 0% |
| GRAND DUCHESS AT ST PATRICK’S | 12 | 12 | 0 | 0 | 0% |
| LINCOLN SUITES | 5 | 5 | 0 | 0 | 0% |
| REGENT RESIDENCES | 15 | 15 | 0 | 0 | 0% |
| ROBIN RESIDENCES | 1 | 1 | 0 | 0 | 0% |
| THE PEAK@BALMEG | 8 | 8 | 0 | 0 | 0% |
| LEEDON RESIDENCE | 22 | 21 | 1 | 0 | 5% |
| CLOVER BY THE PARK | 32 | 30 | 2 | 0 | 6% |
| DOUBLE BAY RESIDENCES | 26 | 24 | 2 | 0 | 8% |
| ROCHELLE AT NEWTON | 11 | 10 | 1 | 0 | 9% |
| CITYSCAPE @FARRER PARK | 10 | 9 | 1 | 0 | 10% |
| SKY HABITAT | 30 | 27 | 3 | 0 | 10% |
| SKYLINE RESIDENCES | 16 | 14 | 2 | 0 | 13% |
| WOODHAVEN | 14 | 12 | 2 | 0 | 14% |
| QUESTA @ DUNMAN | 8 | 6 | 2 | 0 | 25% |
| GILSTEAD TWO | 3 | 2 | 1 | 0 | 33% |
| ZEDGE | 9 | 6 | 3 | 0 | 33% |
| NEWTON EDGE | 8 | 4 | 3 | 1 | 38% |
| PARC SOPHIA | 15 | 7 | 7 | 1 | 47% |
| JARDIN | 13 | 6 | 7 | 0 | 54% |
| ALTEZ | 7 | 3 | 4 | 0 | 57% |
| BELLE VUE RESIDENCES | 12 | 3 | 9 | 0 | 75% |
| OUE TWIN PEAKS | 45 | 3 | 42 | 0 | 93% |
| MARINA BAY SUITES | 2 | 0 | 2 | 0 | 100% |
You can see that there are two clear extremes here.
On one end, you have condos like Goodwood Residence, Cyan, and Grand Duchess at St Patrick’s, where not a single resale transaction has incurred a loss. That’s impressive, and probably explains why so few owners are in a rush to let go.
There are also impressive condos here with pretty clear reasons to stay put. Quality developments like Leedon Residence, Goodwood Residence, and Cyan, close to good schools and located in the coveted District 9, give homeowners little incentive to sell. These are most likely the ones where owners aren’t stuck; they’re just happy to stay.
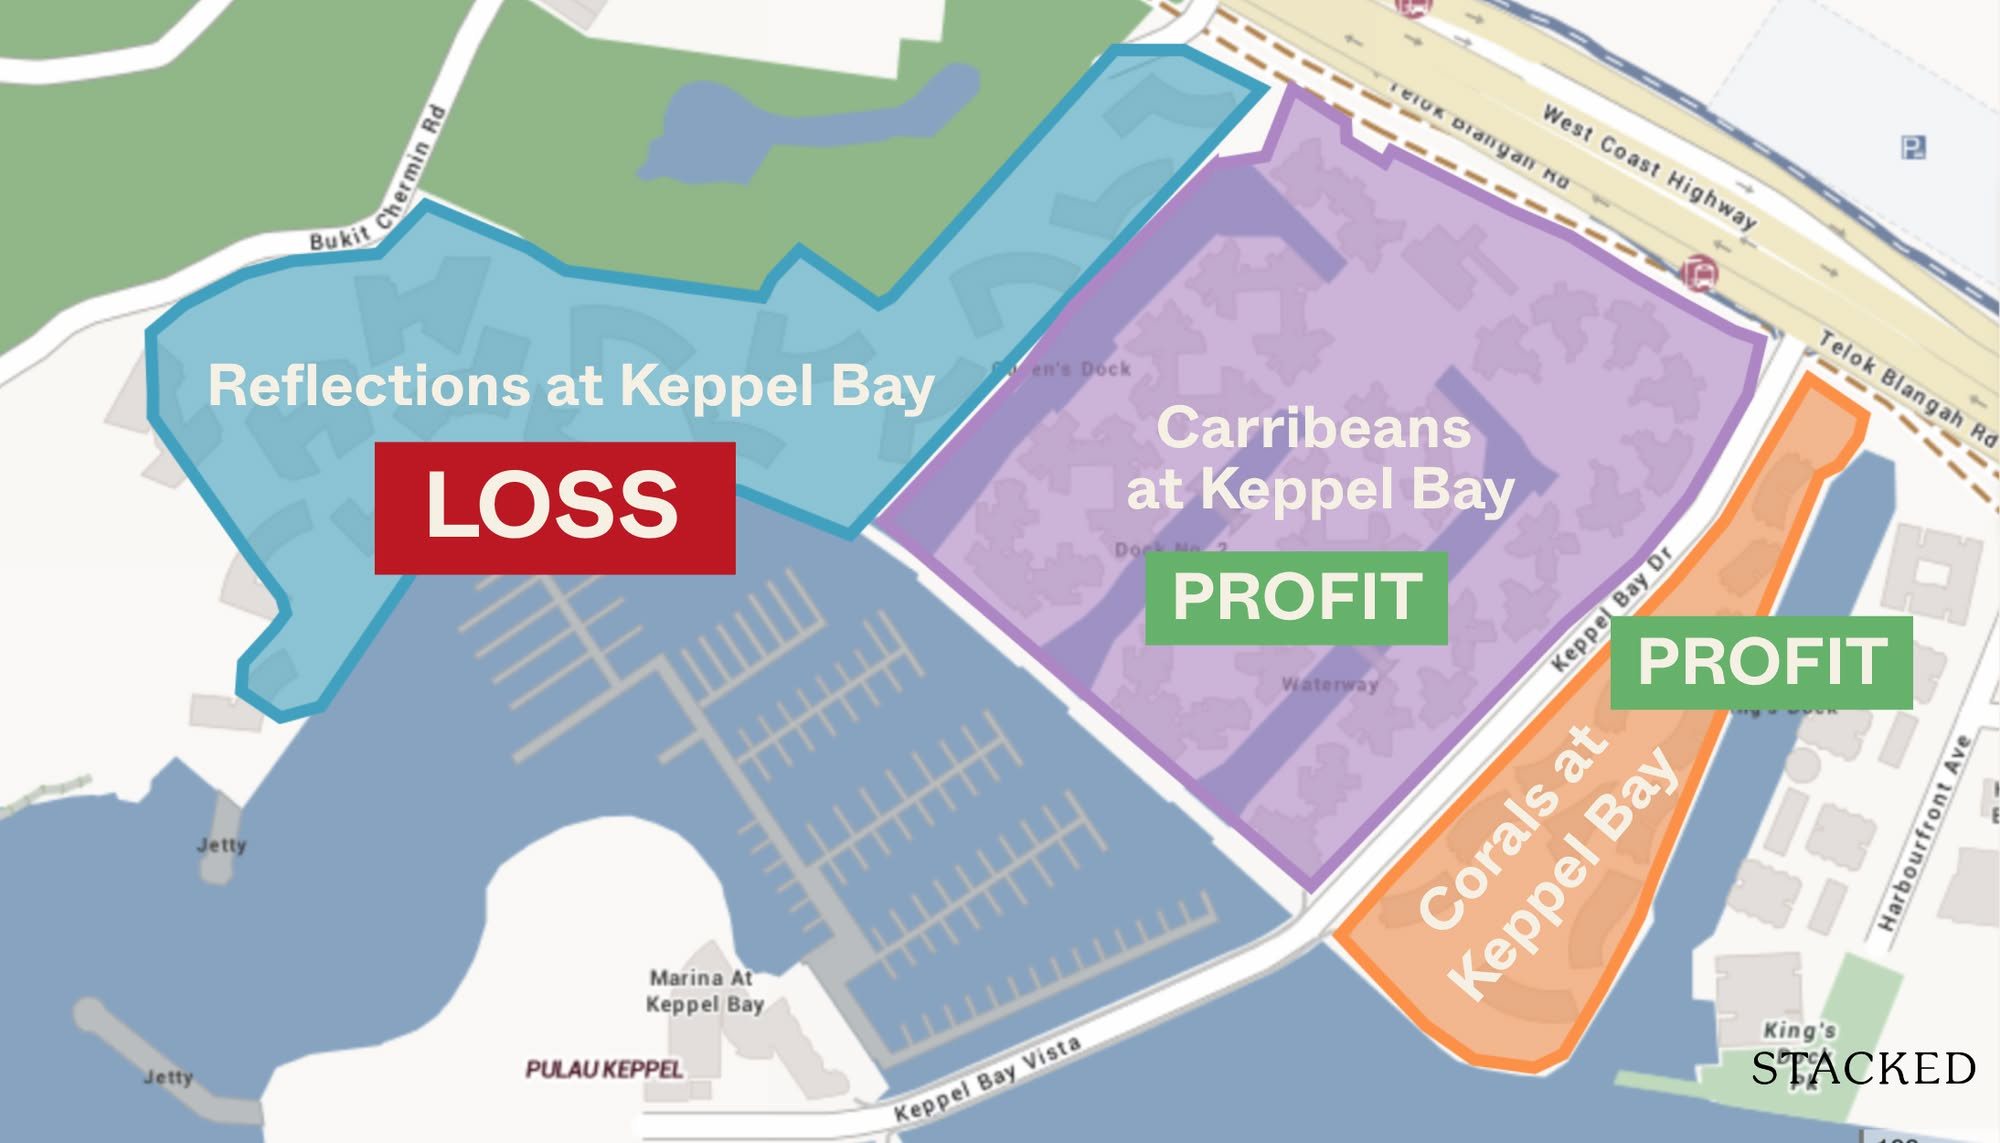
On the other end, though, you have names like Belle Vue Residences, OUE Twin Peaks, and Marina Bay Suites, where the loss rates are staggering. Marina Bay Suites, in particular, manages a perfect score: 100 per cent of resale transactions recorded a loss. OUE Twin Peaks isn’t far behind at 93 per cent.
So what we’re seeing is two very different kinds of “stickiness.” Half of the condos here had a loss rate below 10 per cent, which suggests genuine owner satisfaction and confidence.
But THEN, about 37 per cent had a loss rate above Singapore’s average of around 20 per cent. For this batch, I suspect that some owners are simply trapped: unwilling to actualise their loss, and hanging on because it feels better than admitting defeat.
Either way, they’re not selling, but the reason why makes all the difference.
PS: In some sense, we could also say that some of these condos just don’t see many transactions simply because… they’re not that popular. There might be plenty of listings, but not enough buyers to clear them. You see this with units in the CCR like Altez or Marina Bay Suites: the rental yields are decent enough to hold, but unless an owner can find someone willing to pay enough to avoid a loss, they’ll often just keep collecting rent and wait it out. Others, like Jardin, have issues I’ve covered in other articles.
Conclusion:
What this whole exercise really taught me is: just because nobody sells doesn’t mean the condo is a hidden paradise.
Sometimes, people hold on because it really is a good place to live, as I suspect with places like Leedon Residence or Goodwood Residence. These are the projects where schools, space, and prestige make them hard to replace.
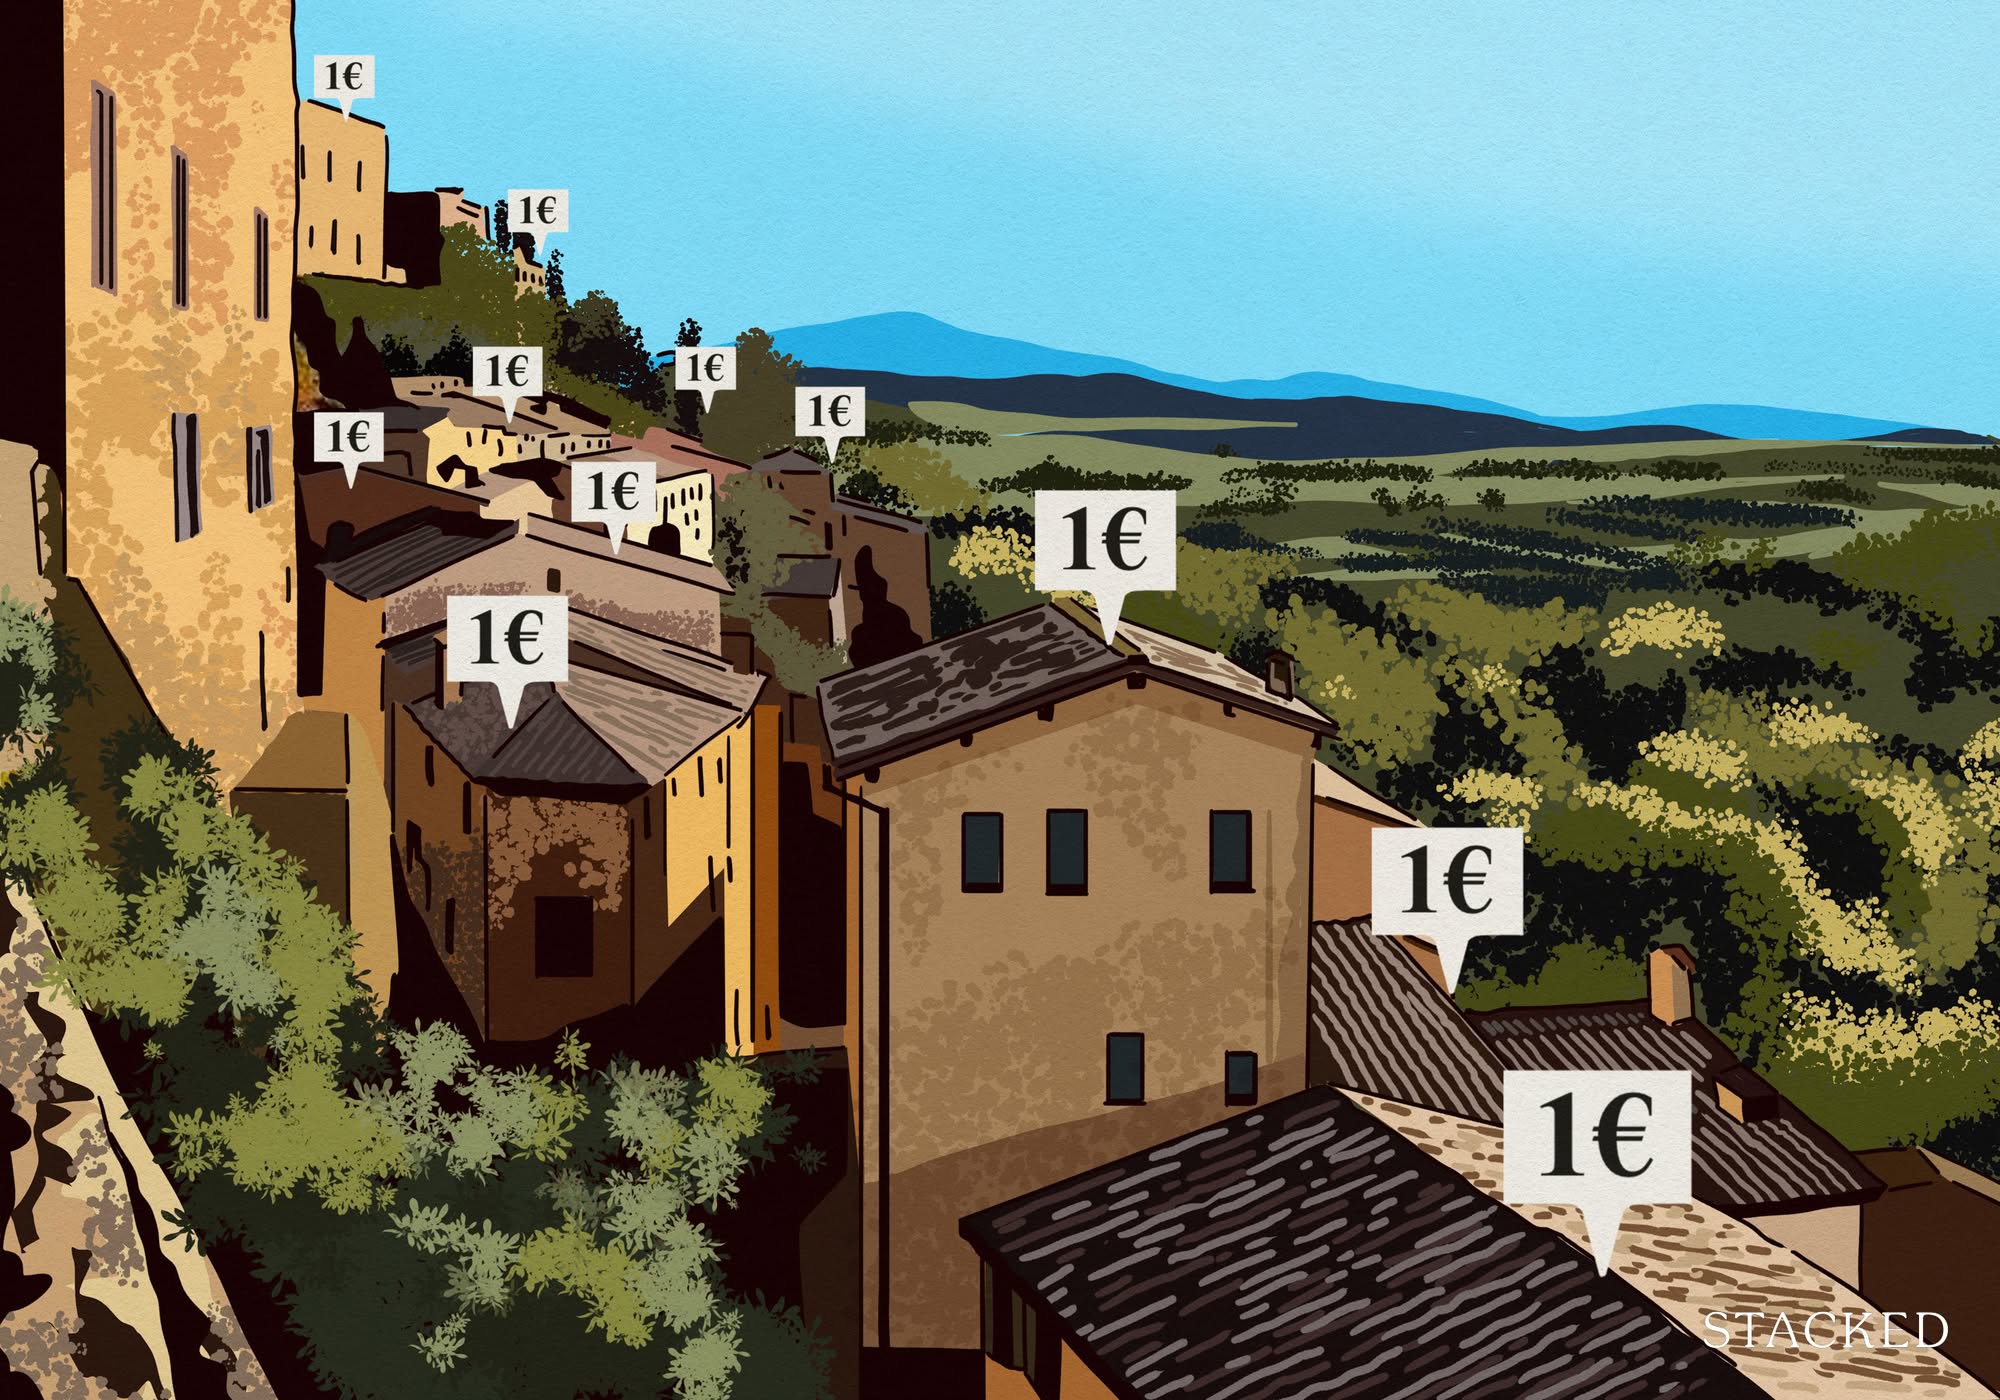
But much more often, some owners hold on because they’re waiting for that en‑bloc cheque.
Or they hold on because it would mean selling at a huge loss, and they are content with just getting rental income instead of crystallising the loss by selling. So yes, stickiness can mean loyalty, but it can also just mean being stuck.
And now I know better.
For more on deep dives into the Singapore property market, follow us on Stacked. If you’d like to get in touch for a more in-depth consultation, you can do so here.