How Different Condo Views Affect Returns In Singapore: A 25-Year Study Of Pebble Bay


A seasoned content strategist with over 17 years in the real estate and financial journalism sectors, Ryan has built a reputation for transforming complex industry jargon into accessible knowledge. With a track record of writing and editing for leading financial platforms and publications, Ryan's expertise has been recognised across various media outlets. His role as a former content editor for 99.co and a co-host for CNA 938's Open House programme underscores his commitment to providing valuable insights into the property market.
In this Stacked Pro breakdown:
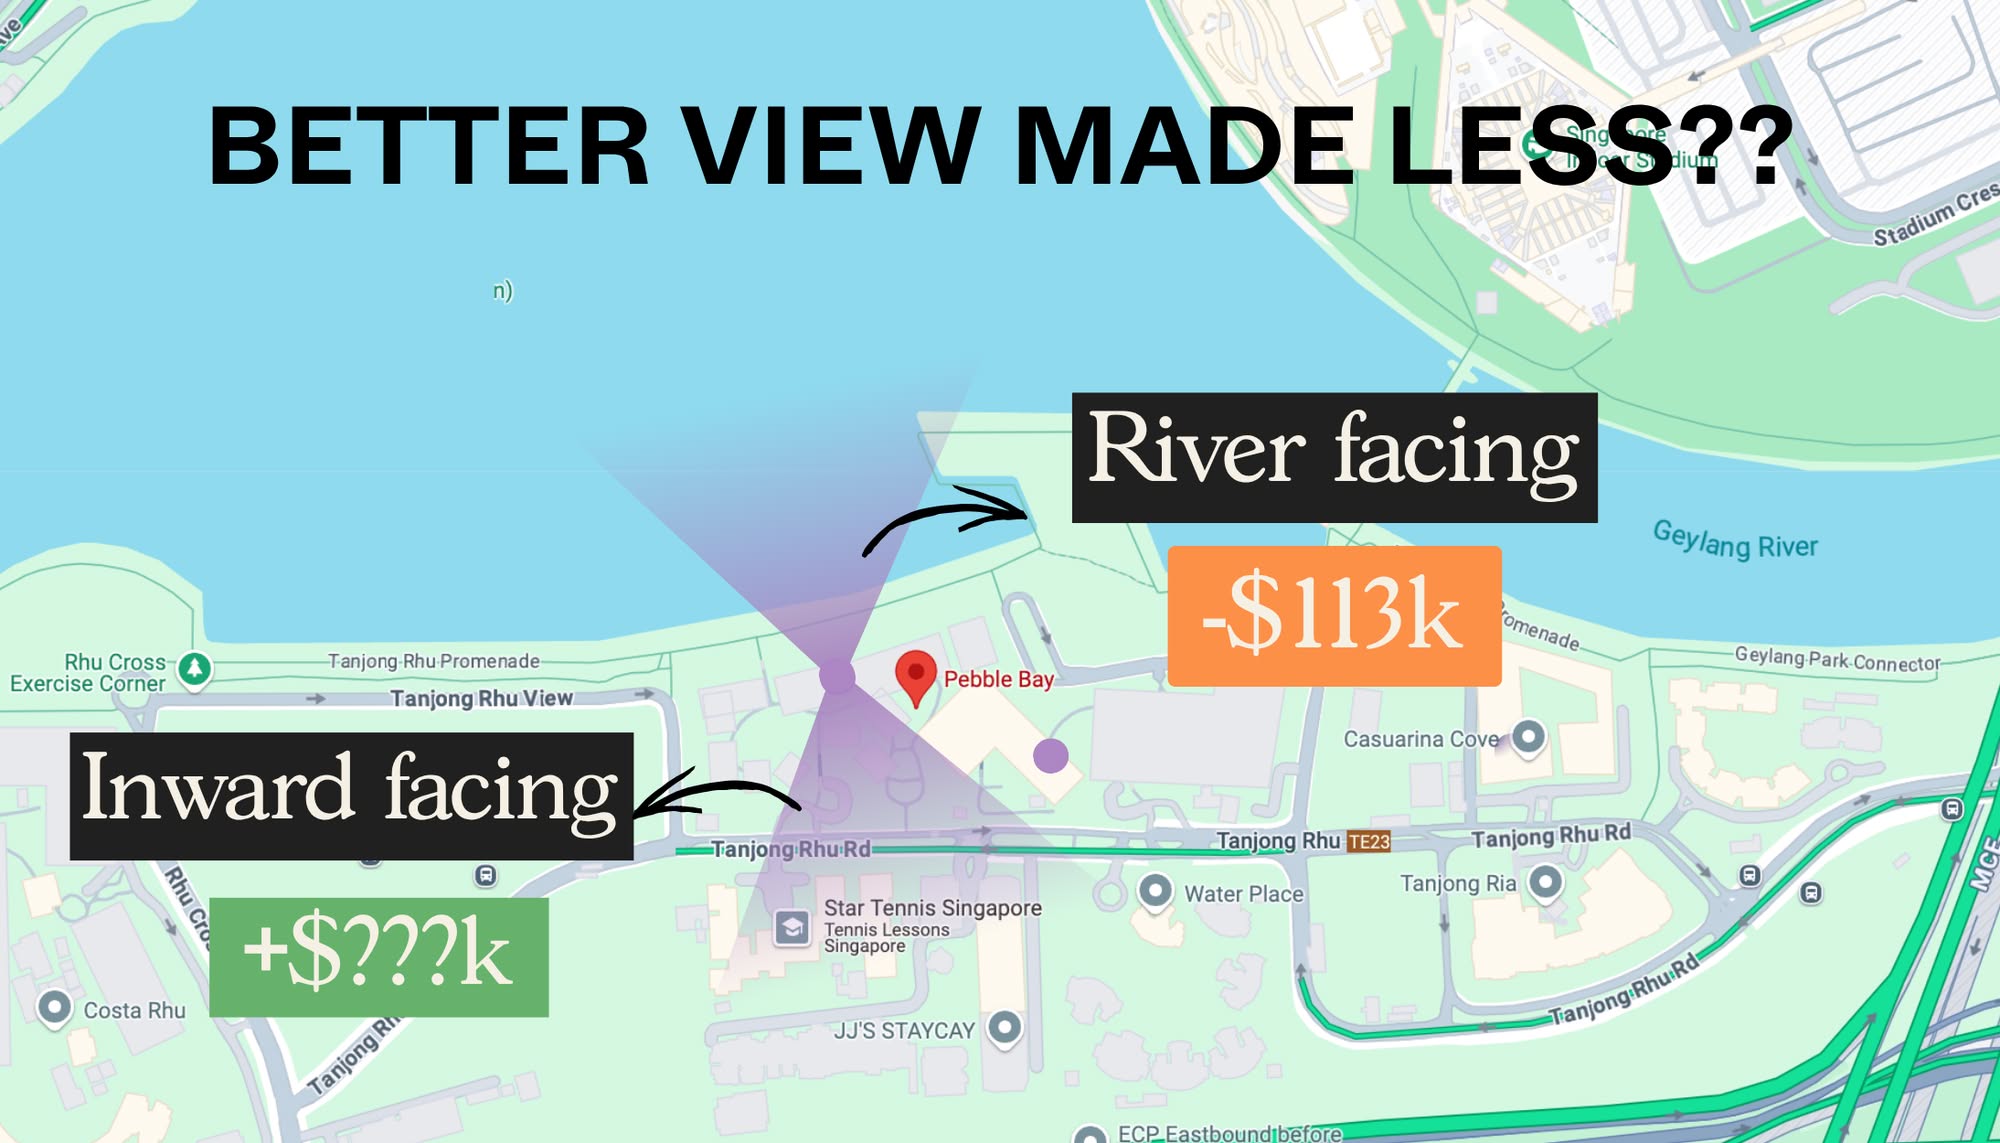
- We analysed over 25 years of Pebble Bay resale transactions to understand how different facings — from waterfront to inward views — affect pricing
- Some view premiums were as high as 40%, but didn’t always translate into better returns
- Discover why resale performance often hinged more on holding period and timing than on scenery alone
Already a subscriber? Log in here.
With a long transaction history and clear segmentation between sea-facing and non-sea-facing stacks, Pebble Bay offers one of the clearest case studies for understanding how view premiums play out in resale value.
Its waterfront positioning has been a core part of its appeal since launch — but how much does that really translate into long-term price performance? In this analysis, we compare sales trends across different facings to quantify the premium (or discount) tied to unit orientation. Whether you’re a current owner or prospective buyer, this breakdown offers insight into the long-term impact of view-based differentiation.
A rundown on Pebble Bay
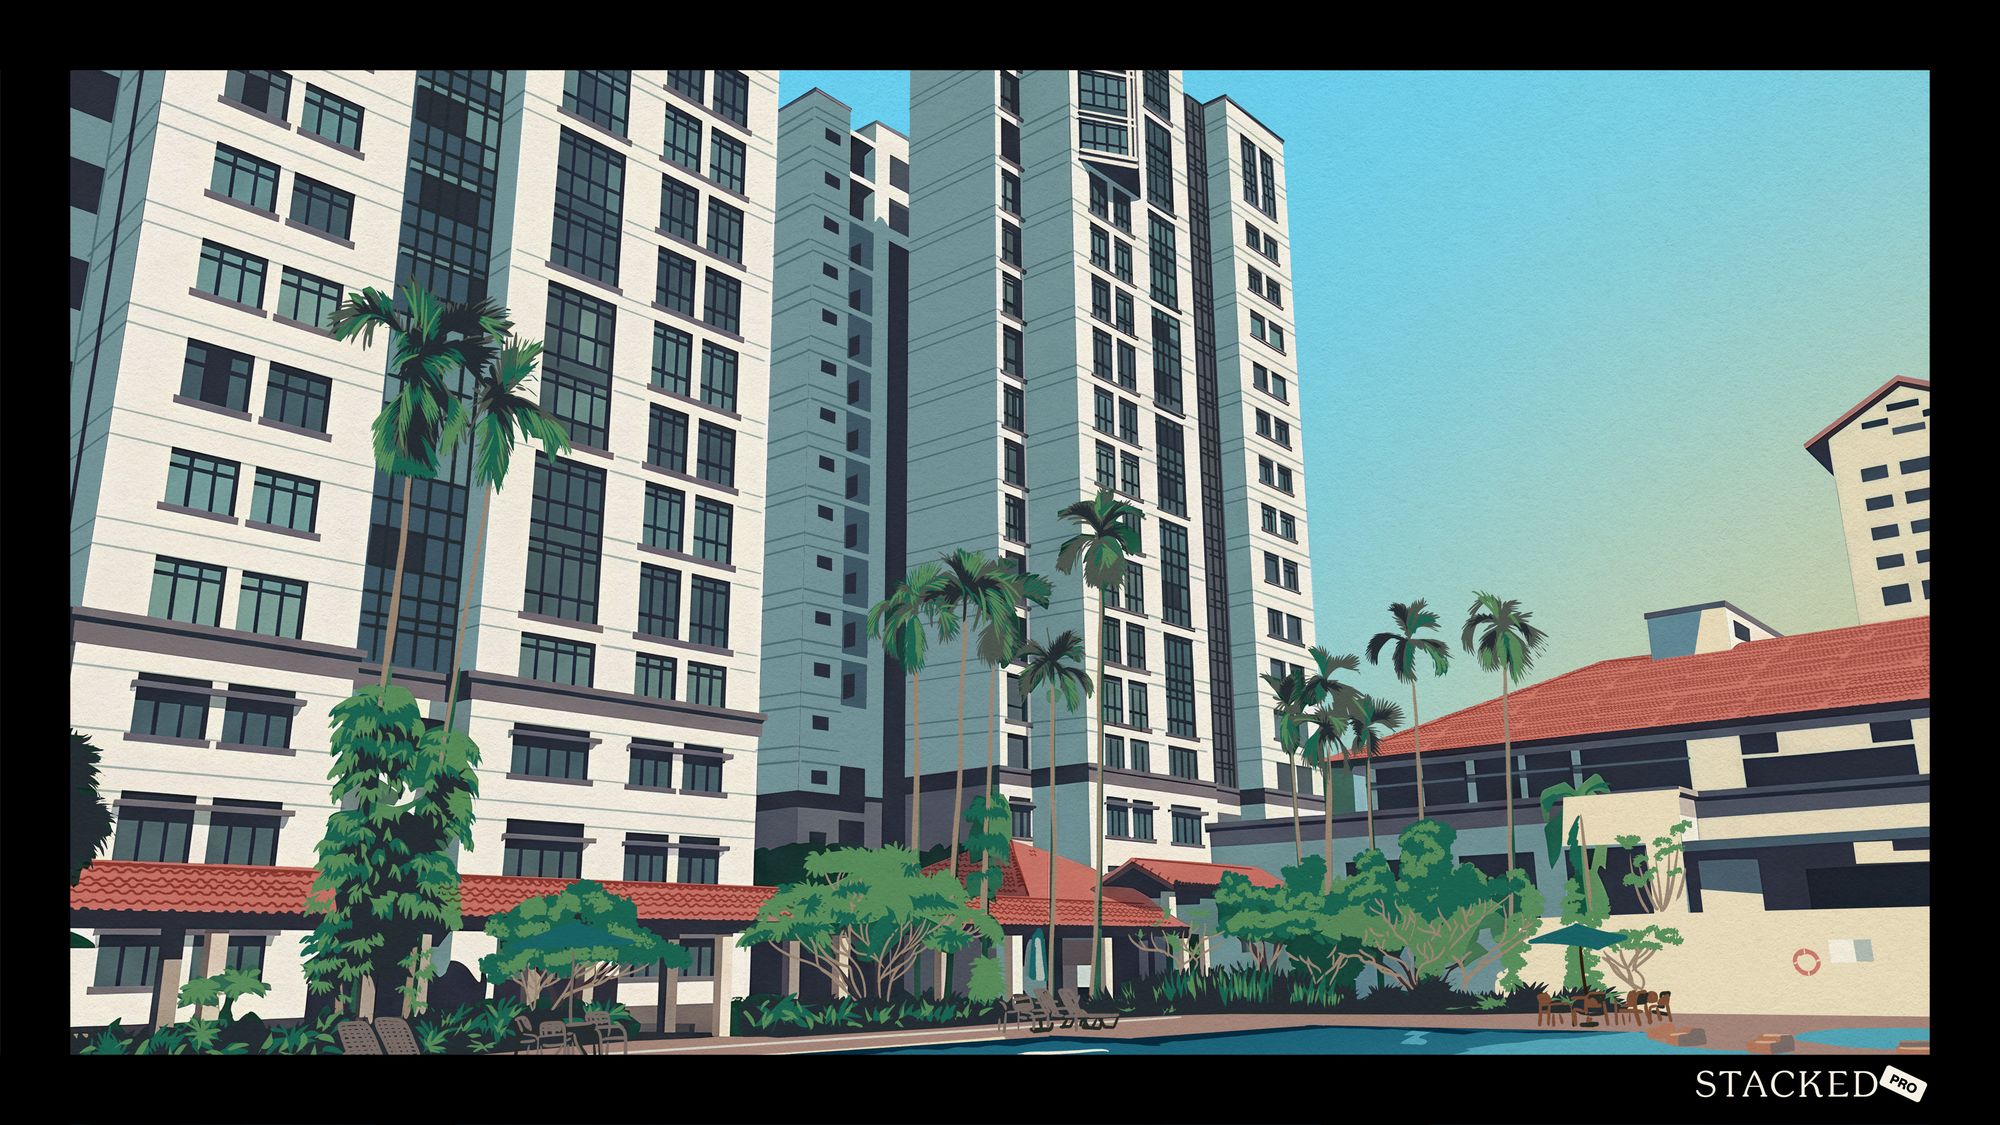
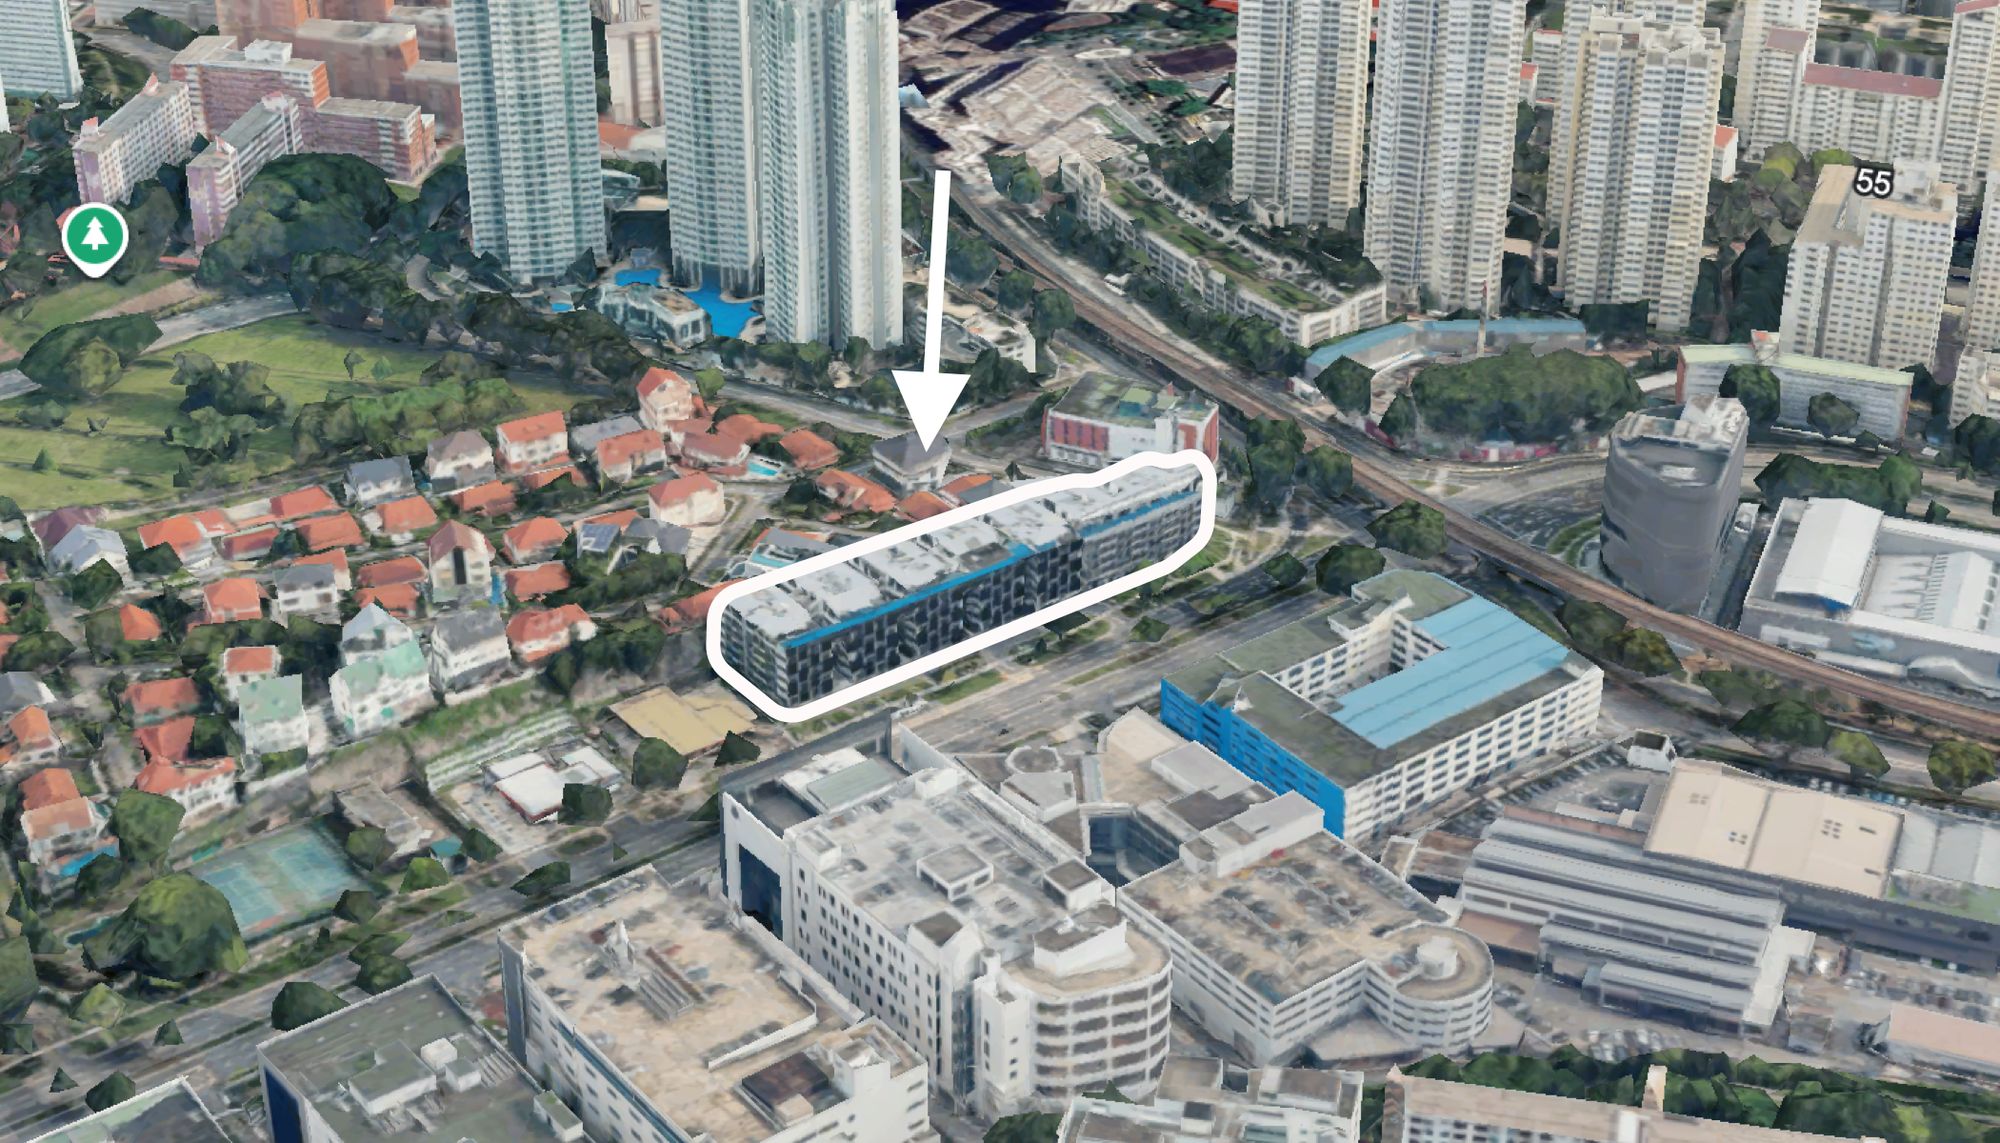
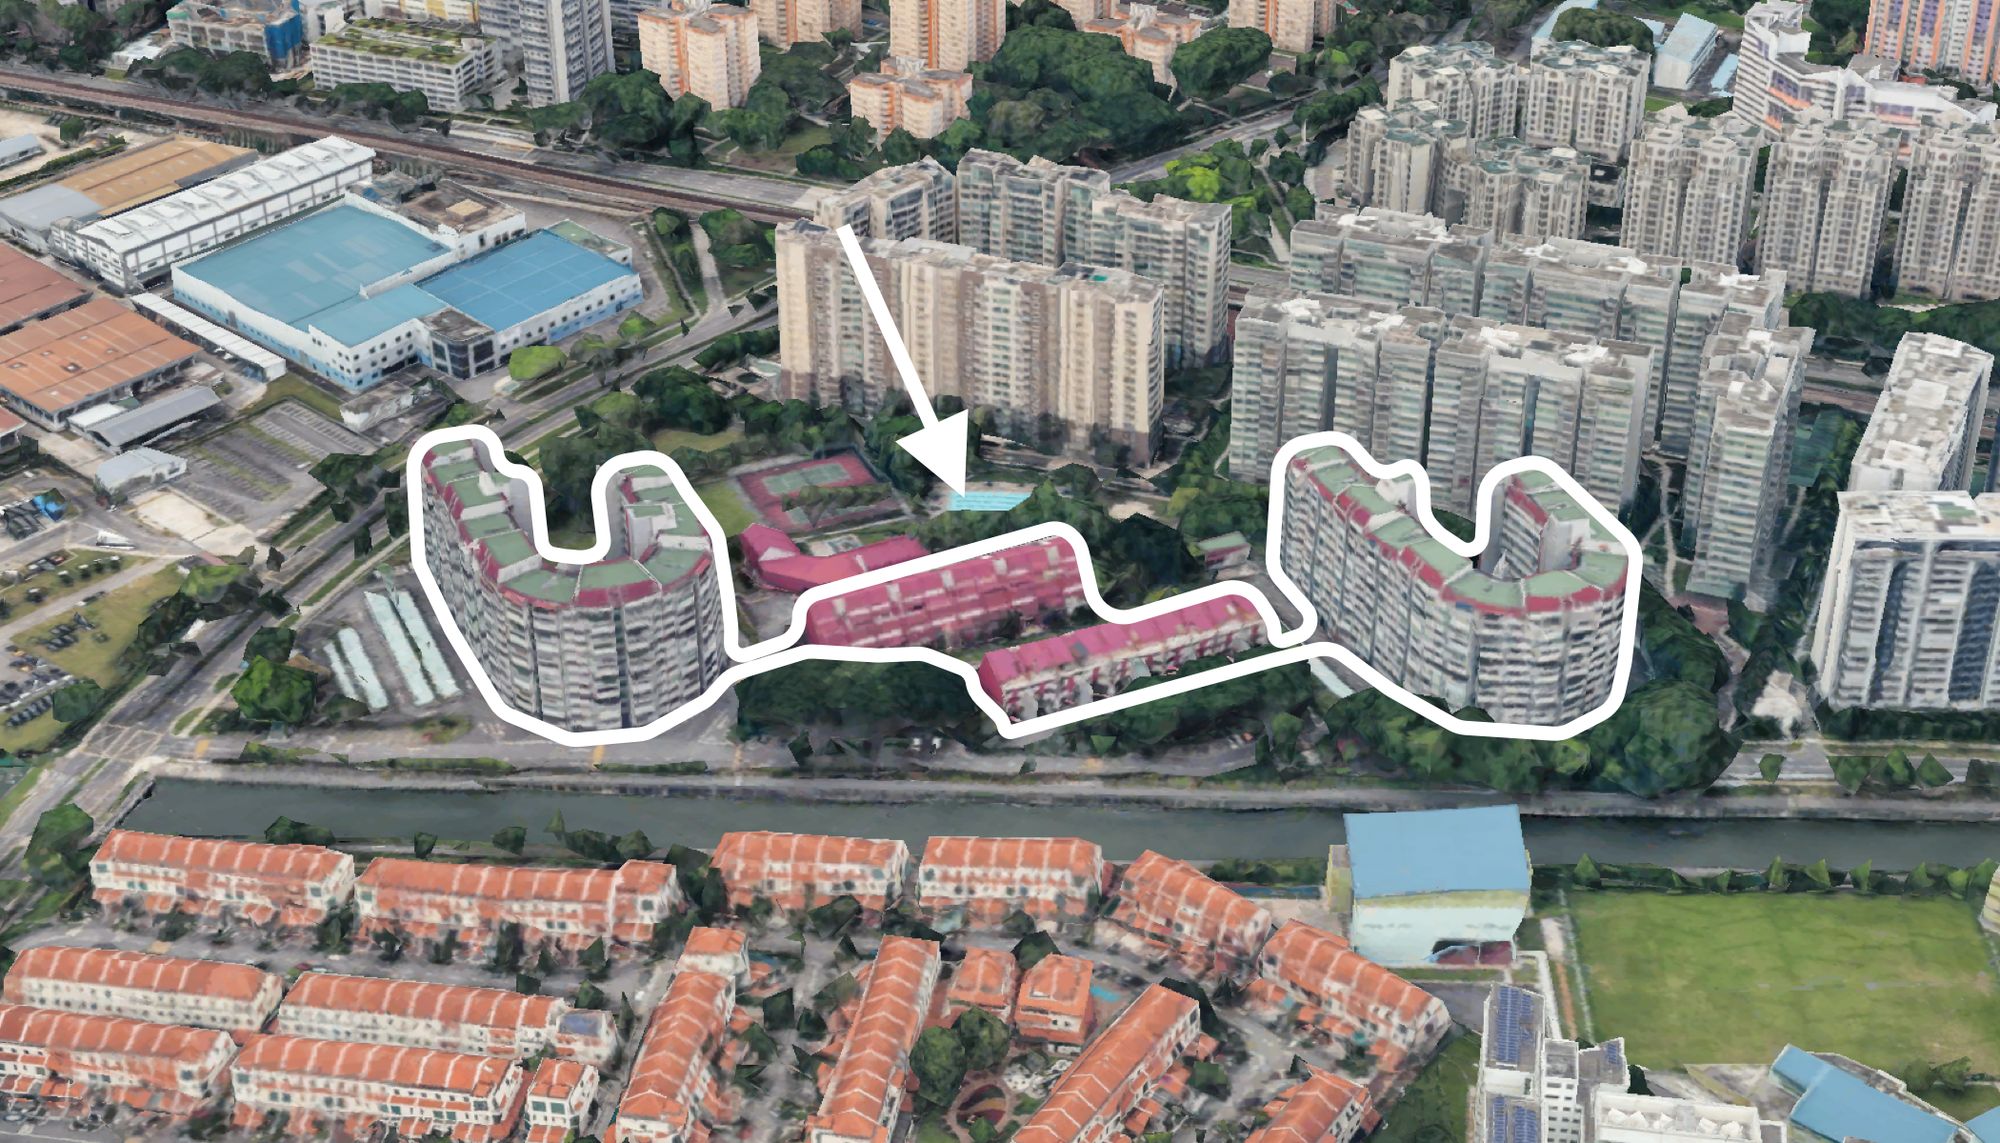
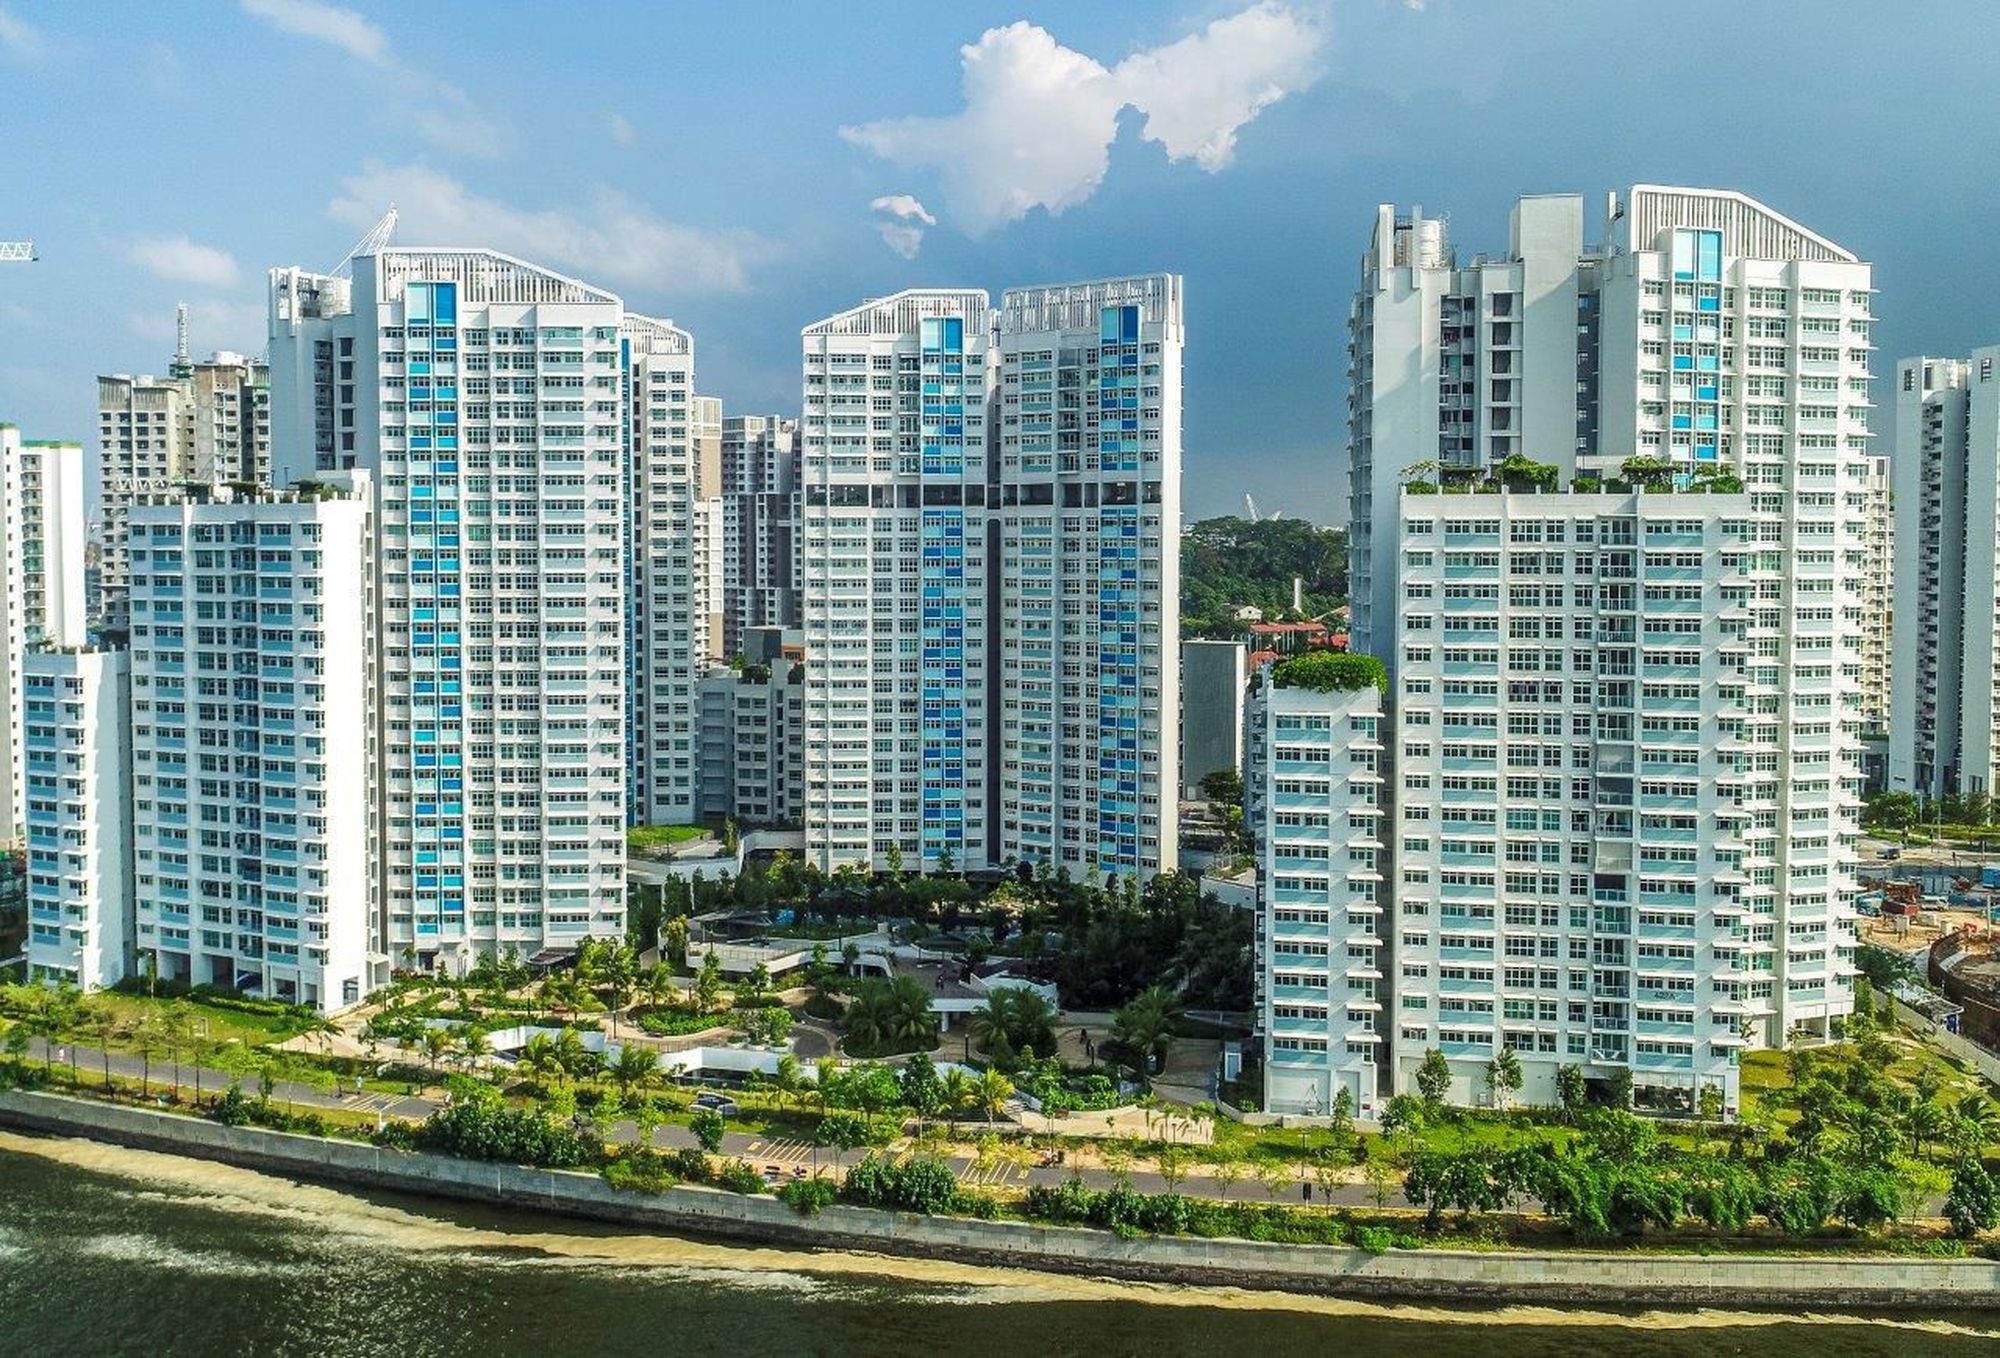
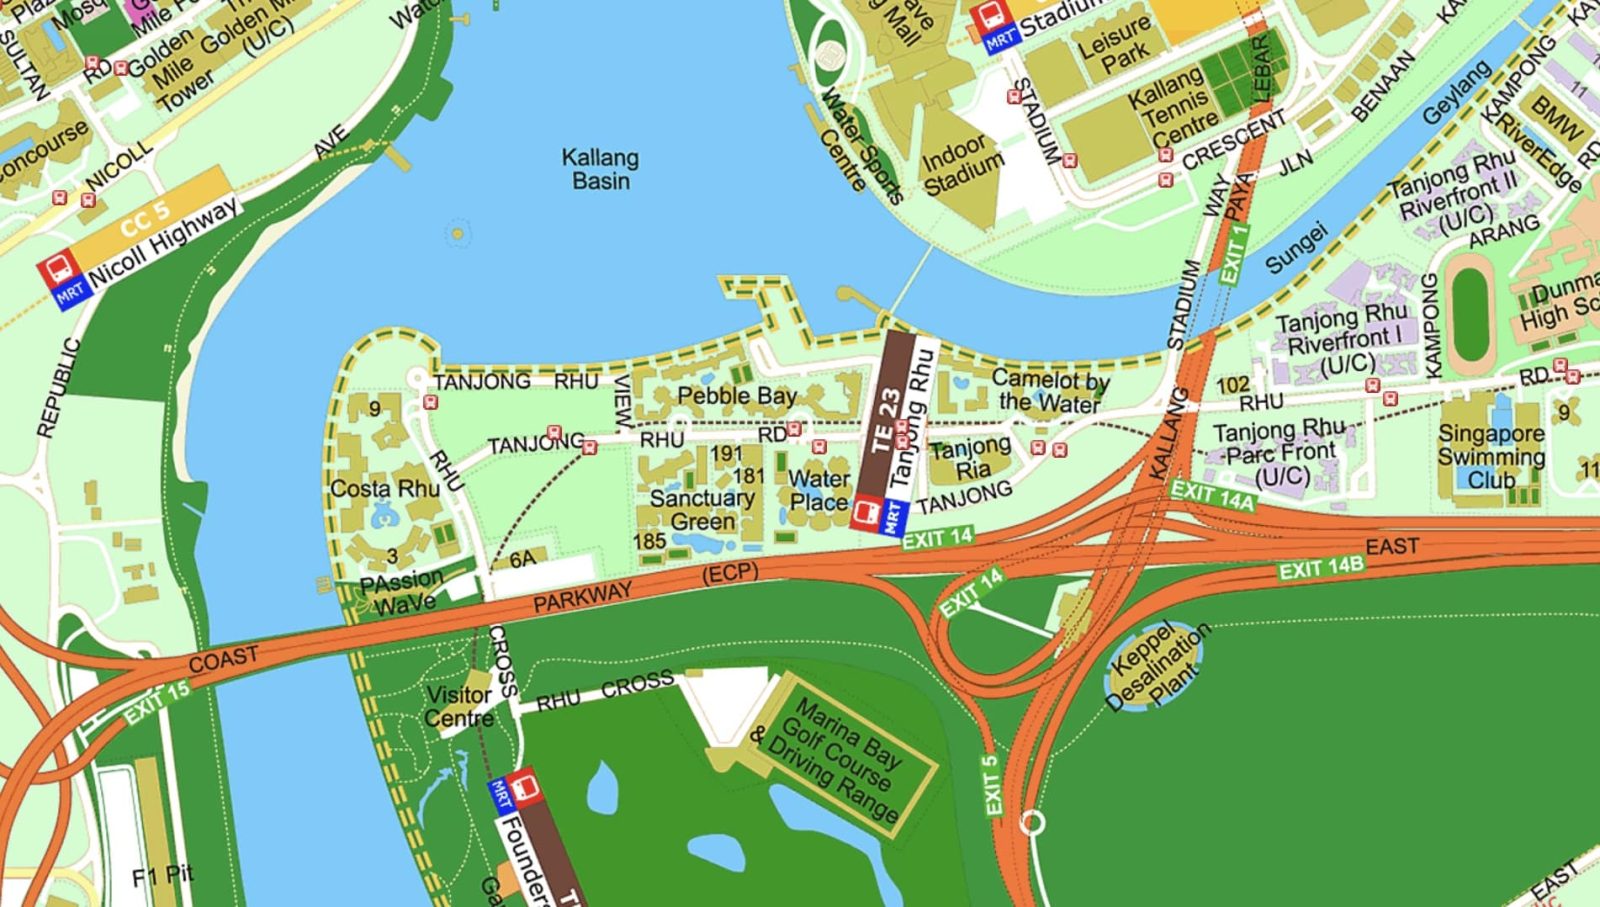
Pebble Bay is an older leasehold condo, built in 1994. This 510-unit condo overlooks the Kallang Basin, and is located in District 15 (RCR). Here’s a look at the location and site plan:


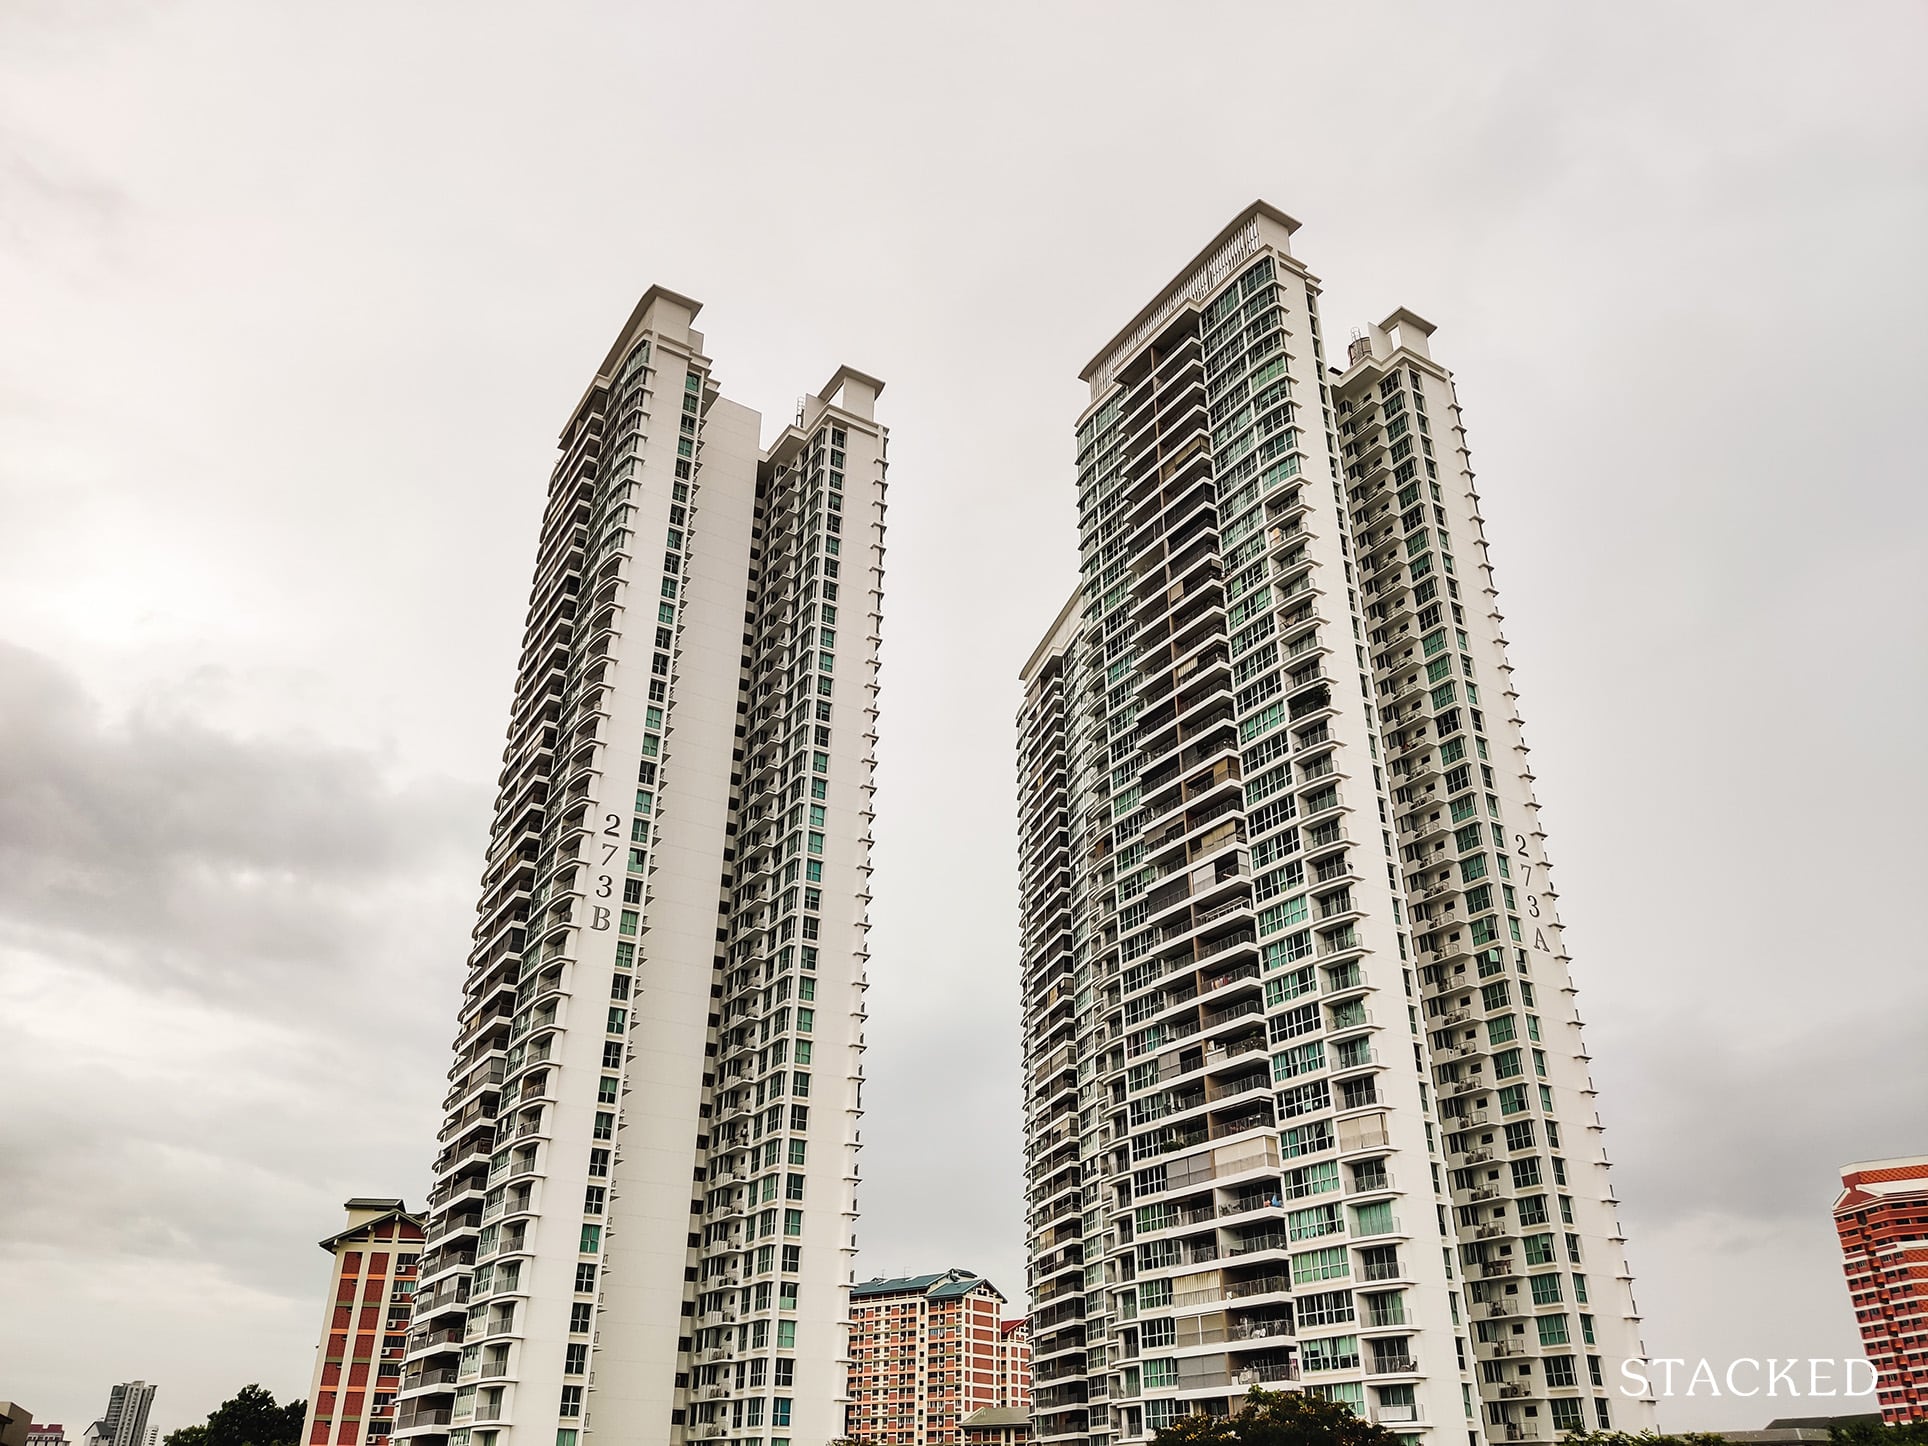
Pebble Bay has four towers of differing heights. Towers 1 and 2 have four to six floors, whilst towers 3 and 4 have 8 to 17 floors. As Pebble Bay was specifically built to take advantage of the scenery, most stacks are outward facing. On one side, the stacks face the waterfront view of Kallang Basin, while on the other side, they face other condos. There are also some inward-facing stacks.
Comparing 1-bedroom units

These are for blocks 3 and 4 (stacks 3 vs. 24). Stack 3 gets the inward-facing view, while Stack 24 faces the other neighbouring condos.

Date | Size (sqft) | $PSF | Price | Address | $PSF difference |
24 May 1996 | 850 | 903 | 768,000 | 132 Tanjong Rhu Road #02-03 | 10.26% |
11 May 1996 | 850 | 819 | 696,540 | 130 Tanjong Rhu Road #02-24 | |
1 Feb 1996 | 850 | 861 | 732,000 | 132 Tanjong Rhu Road #03-03 | 3.73% |
14 May 1996 | 850 | 830 | 706,000 | 130 Tanjong Rhu Road #03-24 | |
16 Apr 1996 | 850 | 864 | 735,000 | 132 Tanjong Rhu Road #04-03 | 3.60% |
16 Apr 1996 | 850 | 834 | 709,000 | 130 Tanjong Rhu Road #04-24 |
The inward-facing units were sold at a premium. Across all recorded transactions, the inward-facing Stack 3 units consistently have a higher price psf than the outward-facing Stack 24 units, on the same floors. Speculatively, Stack 3 may have nicer courtyard or water-feature type views, while Stack 24 may face a less attractive sightline to a neighbouring block.
Now let’s compare the resale gains between the two:

Sold On | Address | Area (sqft) | Sale Price (S$ psf) | Profit (S$) | Purchase Price (S$ psf) | Bought On | Days | Annualised (%) |
27 Jun 2005 | 132 Tanjong Rhu Road #02-03 | 850 | 506 | -338,000 | 903 | 24 May 1996 | 3,321 | -6.2 |
13 Feb 2007 | 130 Tanjong Rhu Road #04-24 | 850 | 647 | -159,000 | 834 | 16 Apr 1996 | 3,955 | -2.3 |
27 Feb 1998 | 132 Tanjong Rhu Road #04-03 | 850 | 770 | -80,000 | 864 | 16 Apr 1996 | 682 | -6 |
1 Jul 1999 | 132 Tanjong Rhu Road #09-03 | 850 | 903 | 41,000 | 855 | 16 Mar 1996 | 1,202 | 1.7 |
1 Jul 2009 | 130 Tanjong Rhu Road #02-24 | 850 | 1,000 | 153,460 | 819 | 11 May 1996 | 4,799 | 1.5 |
17 Feb 2012 | 132 Tanjong Rhu Road #03-03 | 850 | 1,282 | 358,000 | 861 | 1 Feb 1996 | 5,860 | 2.5 |
The facing doesn’t appear to have made a difference. Both inward-facing and outward-facing units had negative returns in the short term and positive returns in the long term; and the difference in average annualised returns between the two stacks is minimal.
Gains and losses here mainly reflect market cycles, rather than the effect of facing. Some of these units were purchased in early to mid-1996, just before the 1997 Asian Financial Crisis hit. Property prices fell significantly from 1997 to 1999, and then again during the SARS crisis in 2003.
Those who held on for longer (10+ years) saw recovery and even profits, while those who sold during the weak markets (1998-2005) suffered the biggest losses. But none of this is related to views.
2-bedroom units

We’ve picked the two-bedder units in block 4 to study (Stack 19 vs. 27). Stack 19 has an inward facing, while Stack 27 gets the waterfront view.

Date | Size (sqft) | $PSF | Price | Address | $PSF difference |
14 May 1996 | 1,367 | 755 | 1,031,700 | 130 Tanjong Rhu Road #03-19 | 8.34% |
1 Mar 1995 | 1,346 | 818 | 1,103,000 | 130 Tanjong Rhu Road #03-27 | |
11 May 1996 | 1,367 | 748 | 1,023,000 | 130 Tanjong Rhu Road #05-19 | 10.43% |
1 Mar 1995 | 1,346 | 826 | 1,113,000 | 130 Tanjong Rhu Road #05-27 | |
16 Sep 1996 | 1,367 | 802 | 1,096,000 | 130 Tanjong Rhu Road #06-19 | 3.49% |
1 Mar 1995 | 1,346 | 830 | 1,118,000 | 130 Tanjong Rhu Road #06-27 |
Perhaps unsurprisingly, the waterfront views commanded a premium. Even though Stack 27 sold out earlier in the launch, its units were still pricier than similar-floor units in Stack 19, which were purchased around a year later. The waterfront-facing units were priced between $818 – $830 psf, while inward-facing units were between $748 – $802 psf.
More from Stacked
Is The Upcoming 1,193-Unit Parktown Residence In Tampines Worth A Look? Here’s All You Need To Know
Singapore property buyers have an ever-growing appetite for integrated projects—and if there’s another thing they can’t resist, it’s mega-developments.
Now let’s compare the gains:

Sold On | Address | Area (sqft) | Sale Price (S$ psf) | Profit (S$) | Purchase Price (S$ psf) | Bought On | Days | Annualised (%) |
15 Feb 2005 | 130 Tanjong Rhu Road #05-27 | 1,367 | 732 | -113,000 | 826 | 1 Mar 1995 | 3,639 | -1.1 |
9 Dec 1999 | 130 Tanjong Rhu Road #03-19 | 1,367 | 713 | -56,700 | 755 | 14 May 1996 | 1,304 | -1.6 |
1 Jul 1999 | 130 Tanjong Rhu Road #02-27 | 1,367 | 805 | 2,000 | 815 | 1 Feb 1995 | 1,611 | 0 |
1 Aug 1999 | 130 Tanjong Rhu Road #05-19 | 1,367 | 750 | 2,000 | 748 | 11 May 1996 | 1,177 | 0.1 |
1 Jun 2007 | 130 Tanjong Rhu Road #04-19 | 1,367 | 797 | 55,000 | 757 | 11 May 1996 | 4,038 | 0.5 |
3 Jun 2015 | 130 Tanjong Rhu Road #06-19 | 1,367 | 1,214 | 564,000 | 802 | 16 Sep 1996 | 6,834 | 2.2 |
There is a bit of an imbalance here, as Stack 19 saw a much larger number of transactions; but that doesn’t mean we can’t still see some patterns.
Despite the waterfront view, Stack 27 couldn’t always guarantee higher premiums. In fact, #05-27 (waterfront facing) sold at a loss of $113,000 (-1.1 per cent annualised). On the flip side, #04-19 (inward-facing) was held for 11 years and managed a $55,000 profit (0.5 per cent annualised).
That said, stack 19 did not produce fantastic results either. Most Stack 19 units had rather slim profits (e.g., the aforementioned 0.5 per cent growth) or flat returns (e.g., #05-19 with 0.1 per cent annualised growth).
While more units in Stack 19 avoided losses, it’s hardly what we’d call a good performance. The strongest resale gain came from an inward-facing unit held for nearly two decades (#06-19).
3-bedroom units

We are comparing block 4 for these units (stacks 10 vs. 12). Stack 10 faces the condominiums across the road, and stack 12 has a partial view of the Kallang Basin on the lower floors. But those above the 6th floor (note that block 1 only goes up to six floors) get an unblocked waterfront view.

Date | Size (sqft) | $PSF | Price | Address | $PSF difference |
1 Aug 1999 | 2,357 | 677 | 1,596,000 | 130 Tanjong Rhu Road #03-10 | 22.16% |
25 May 1996 | 1,894 | 827 | 1,566,000 | 130 Tanjong Rhu Road #03-12 | |
7 May 1999 | 2,357 | 585 | 1,380,000 | 130 Tanjong Rhu Road #04-10 | 41.88% |
14 May 1996 | 1,894 | 830 | 1,572,000 | 130 Tanjong Rhu Road #04-12 | |
11 May 1996 | 2,357 | 724 | 1,706,100 | 130 Tanjong Rhu Road #08-10 | 14.64% |
1 Feb 1995 | 1,862 | 830 | 1,542,000 | 130 Tanjong Rhu Road #08-12 | |
30 Apr 1996 | 2,336 | 718 | 1,678,080 | 130 Tanjong Rhu Road #11-10 | 18.25% |
1 Mar 1995 | 1,862 | 849 | 1,578,000 | 130 Tanjong Rhu Road #11-12 | |
27 Apr 1996 | 2,357 | 738 | 1,739,000 | 130 Tanjong Rhu Road #13-10 | -26.29% |
1 Mar 1995 | 1,862 | 544 | 1,010,000 | 130 Tanjong Rhu Road #13-12 |
On most floors, Stack 12 (partial/full waterfront view) commanded a higher price than Stack 10 (condo-facing). The price difference was highest on lower floors, where the waterfront view was only partial:
- 3rd floor: Stack 12 had a 22.16 per cent premium.
- 4th floor: The difference jumped to 41.88 per cent, the highest in this comparison.
This suggests that even a partial waterfront view was priced significantly higher than a condo-facing unit. Another interesting pattern is that by the 8th floor, the premium narrowed to 14.64 per cent. By the 11th floor, it further dropped to 18.25 per cent.
Some realtors opined this was because once both stacks had unblocked views (i.e., from the 6th floor and up), the waterfront premium stabilised or shrank.
There’s also an interesting anomaly on the 13th floor: Stack 12 (waterfront-facing) was actually 26.29 per cent cheaper than Stack 10 on the 13th floor. We don’t have any explanation for this!
Now let’s compare the resale gains:

Sold On | Address | Area (sqft) | Bedrooms | Sale Price (S$ psf) | Profit (S$) | Purchase Price (S$ psf) | Bought On | Days | Annualised (%) |
7 Jan 1999 | 130 Tanjong Rhu Road #07-10 | 2,357 | 3 | 479 | -572,340 | 722 | 11 May 1996 | 971 | -14.3 |
11 Dec 1998 | 130 Tanjong Rhu Road #04-12 | 1,894 | 3 | 538 | -552,000 | 830 | 14 May 1996 | 941 | -15.4 |
21 Feb 1998 | 130 Tanjong Rhu Road #11-10 | 2,336 | 3 | 731 | 29,920 | 718 | 30 Apr 1996 | 662 | 1 |
29 May 2009 | 130 Tanjong Rhu Road #03-10 | 2,336 | 3 | 813 | 304,000 | 677 | 1 Aug 1999 | 3,589 | 1.8 |
12 Mar 2007 | 130 Tanjong Rhu Road #04-10 | 2,336 | 3 | 771 | 420,000 | 585 | 7 May 1999 | 2,866 | 3.4 |
7 Mar 2008 | 130 Tanjong Rhu Road #08-10 | 2,336 | 3 | 1,113 | 893,900 | 724 | 11 May 1996 | 4,318 | 3.6 |
17 May 2010 | 130 Tanjong Rhu Road #10-10 | 2,336 | 3 | 1,250 | 1,244,680 | 711 | 1 Jul 1999 | 3,973 | 5.2 |
11 Nov 2013 | 130 Tanjong Rhu Road #10-12 | 1,894 | 3 | 1,504 | 1,284,000 | 843 | 1 Mar 1995 | 6,830 | 3.3 |
3 Mar 2011 | 130 Tanjong Rhu Road #13-12 | 1,894 | 3 | 1,346 | 1,540,000 | 544 | 1 Mar 1995 | 5,846 | 6 |
17 Mar 2022 | 130 Tanjong Rhu Road #08-12 | 1,894 | 3 | 1,689 | 1,658,000 | 830 | 1 Feb 1995 | 9,906 | 2.7 |
Waterfront units (Stack 12) had higher absolute gains, but annualised returns were a mixed bag. The best performer (#13-12) had a 6 per cent annualised gain, but #10-10 (condo-facing) wasn’t too far behind at 5.2 per cent.
Timing was, again, a more important factor. Both waterfront and condo-facing units suffered in the 1997 crash, with huge losses for short-term sellers. The units that saw better gains, like #13-12, were held for long periods of over a decade.
From this set of units, though, we can conclude that the premiums for waterfront views didn’t always translate into higher percentage returns.
We could also say that Stack 10 (condo-facing) was riskier as a short-term holding, compared to Stack 12:
#07-10 (Stack 10, condo-facing) lost $572,340 (-14.3 per cent annualised) in 971 days, the worst-performing unit in this batch. In contrast, #04-12 (Stack 12, waterfront-facing) lost $552,000 (-15.4 per cent annualised) in 941 days. This is a similar scale of loss, but with a slightly higher percentage decline. During the Asian Financial Crisis, Stack 10 had more severe losses across multiple units.
View premiums vs profit margins: The final take
While the transaction analysis we’ve conducted might seem counter-intuitive given the persistent marketing emphasis on views, the historical patterns at Pebble Bay are clear for those who know where to look.
Based on these indicators, we’re advising our clients to prioritise entry pricing and timing factors over view premium when selecting waterfront properties in today’s market.
Wondering if your current property plans should be adjusted based on these findings? Schedule a session with our real estate consultants to identify value opportunities in your target developments. We’re happy to share what we’re seeing on the ground, and guide you toward a more informed decision.
If you’d like to get in touch for a more in-depth consultation, you can do so here.
Ryan J
A seasoned content strategist with over 17 years in the real estate and financial journalism sectors, Ryan has built a reputation for transforming complex industry jargon into accessible knowledge. With a track record of writing and editing for leading financial platforms and publications, Ryan's expertise has been recognised across various media outlets. His role as a former content editor for 99.co and a co-host for CNA 938's Open House programme underscores his commitment to providing valuable insights into the property market.Read next from Property Investment Insights

Property Investment Insights Do Mega-Developments Really Outperform Regular Condos? A Parc Clematis Vs Clavon Case Study

Property Investment Insights Affinity at Serangoon vs The Garden Residences: Same Launch Year, Same Location — But Which Gave Better Capital Gains?

Property Investment Insights Why I Bought A $1.45 Million 2-Bedder At ELTA: A Buyer’s Case Study

Property Investment Insights Can You Upgrade From An HDB To A $1.8M Condo In 2025? Here’s What It Takes
Latest Posts

Homeowner Stories Why These Buyers Chose Older Leasehold Condos—And Have No Regrets

Singapore Property News $1.16M For A 4-Room HDB In Clementi? Why This Integrated Development Commands Premium Prices

Editor's Pick Arina East Residences Review: First Condo Launch in Tanjong Rhu in 13 Years, Near MRT Station

Editor's Pick 4 Potential Residential En Bloc Sites That Could Be Worth Watching In 2025

Property Market Commentary Can Singapore’s Housing Market Handle A Rapidly Ageing Population?

Editor's Pick We Tour Freehold Landed Homes Within 1km Of Tao Nan & CHIJ Katong (From $3.88M In 2021)

Singapore Property News Why Lower Land Prices In Singapore Don’t Mean Cheaper New Condos

Singapore Property News Ang Mo Kio’s Most Expensive 5-Room HDB Flat Sold For $1.5 Million: Here’s Why

On The Market 5 Cheapest 5-Room HDB Flats In Central Singapore (Under $750,000)

Editor's Pick Why We Chose A $2.7M 4-Bedder At Lentor Mansion Over A Resale Condo

Singapore Property News This Rare HDB Maisonette In Queenstown Just Set A $1.51M Record: Here’s Why

Property Advice Selling Your Home For The First Time? Here’s a Step-by-Step Timeline To Follow In Singapore

Editor's Pick We Tour Jalan Baiduri, Where A Freehold Semi-D Home Just Sold For $4.4 Million In 2025

Singapore Property News Why Some Central 2 Bedroom Homeowners In Singapore Are Stuck

Property Market Commentary Looking To Buy Singapore Property In 2025? Here’s What’s Different (And What Could Catch You Off Guard)
