


Over the past year, demand for landed homes has gone through the roof. Around $2 billion in transactions have already been recorded for 1H 2021, with 245 sales. This is the highest amount we’ve seen since the last peak in H2 2010; at the time, transactions totalled $2.4 billion. It’s been said many times before, but this increased appetite for landed property has definitely been brought upon because of the pandemic.
At Stacked, we’ve been getting many enquiries about landed property – more specifically, on leasehold landed property. Everyone knows the value of freehold, but many are apprehensive on how a leasehold landed property will perform. So in this piece, we aim to find out the general relationship between a freehold and leasehold landed property over the years:
A note on the following data points
For the following article, we looked at landed prices between 1995 to 2021 (Up till August 2021). The time period involves 69,781 transactions in total, with 55,087 being freehold, and 14,459 being leasehold. 235 transactions were excluded, as it was not indicated whether they were freehold or leasehold.
We have treated 900+ -year leases as being, for all intents and purposes, the same as freehold properties.
How have leasehold vs. freehold landed prices moved?
| Land | Strata | |||
| Year | Land (Freehold/900+) | Land (Leasehold) | Strata (Freehold/900+) | Strata (Leasehold) |
| 1995 | $621 | $546 | $497 | |
| 1996 | $654 | $567 | $608 | $496 |
| 1997 | $633 | $553 | $510 | $434 |
| 1998 | $442 | $404 | $499 | $290 |
| 1999 | $488 | $456 | $450 | $353 |
| 2000 | $537 | $490 | $504 | $414 |
| 2001 | $466 | $470 | $414 | $360 |
| 2002 | $458 | $404 | $382 | $345 |
| 2003 | $429 | $363 | $346 | $334 |
| 2004 | $438 | $372 | $351 | $318 |
| 2005 | $444 | $387 | $407 | $326 |
| 2006 | $497 | $410 | $537 | $332 |
| 2007 | $631 | $548 | $622 | $463 |
| 2008 | $686 | $593 | $650 | $454 |
| 2009 | $702 | $623 | $565 | $456 |
| 2010 | $888 | $825 | $673 | $561 |
| 2011 | $1,091 | $846 | $741 | $589 |
| 2012 | $1,256 | $981 | $799 | $652 |
| 2013 | $1,351 | $1,078 | $903 | $727 |
| 2014 | $1,336 | $867 | $876 | $707 |
| 2015 | $1,295 | $898 | $772 | $628 |
| 2016 | $1,243 | $894 | $713 | $591 |
| 2017 | $1,265 | $946 | $773 | $631 |
| 2018 | $1,356 | $911 | $808 | $679 |
| 2019 | $1,408 | $926 | $771 | $693 |
| 2020 | $1,435 | $913 | $722 | $676 |
| 2021 | $1,540 | $1,049 | $839 | $743 |
As of 2021, freehold landed properties – across Singapore – average around $1,540 psf, whereas leasehold landed properties average around $1,049 psf.
This is a difference of 46.8% which is quite wide. Back in 2010, freehold landed across Singapore averaged at $888 psf, while leasehold landed averaged $825 psf.
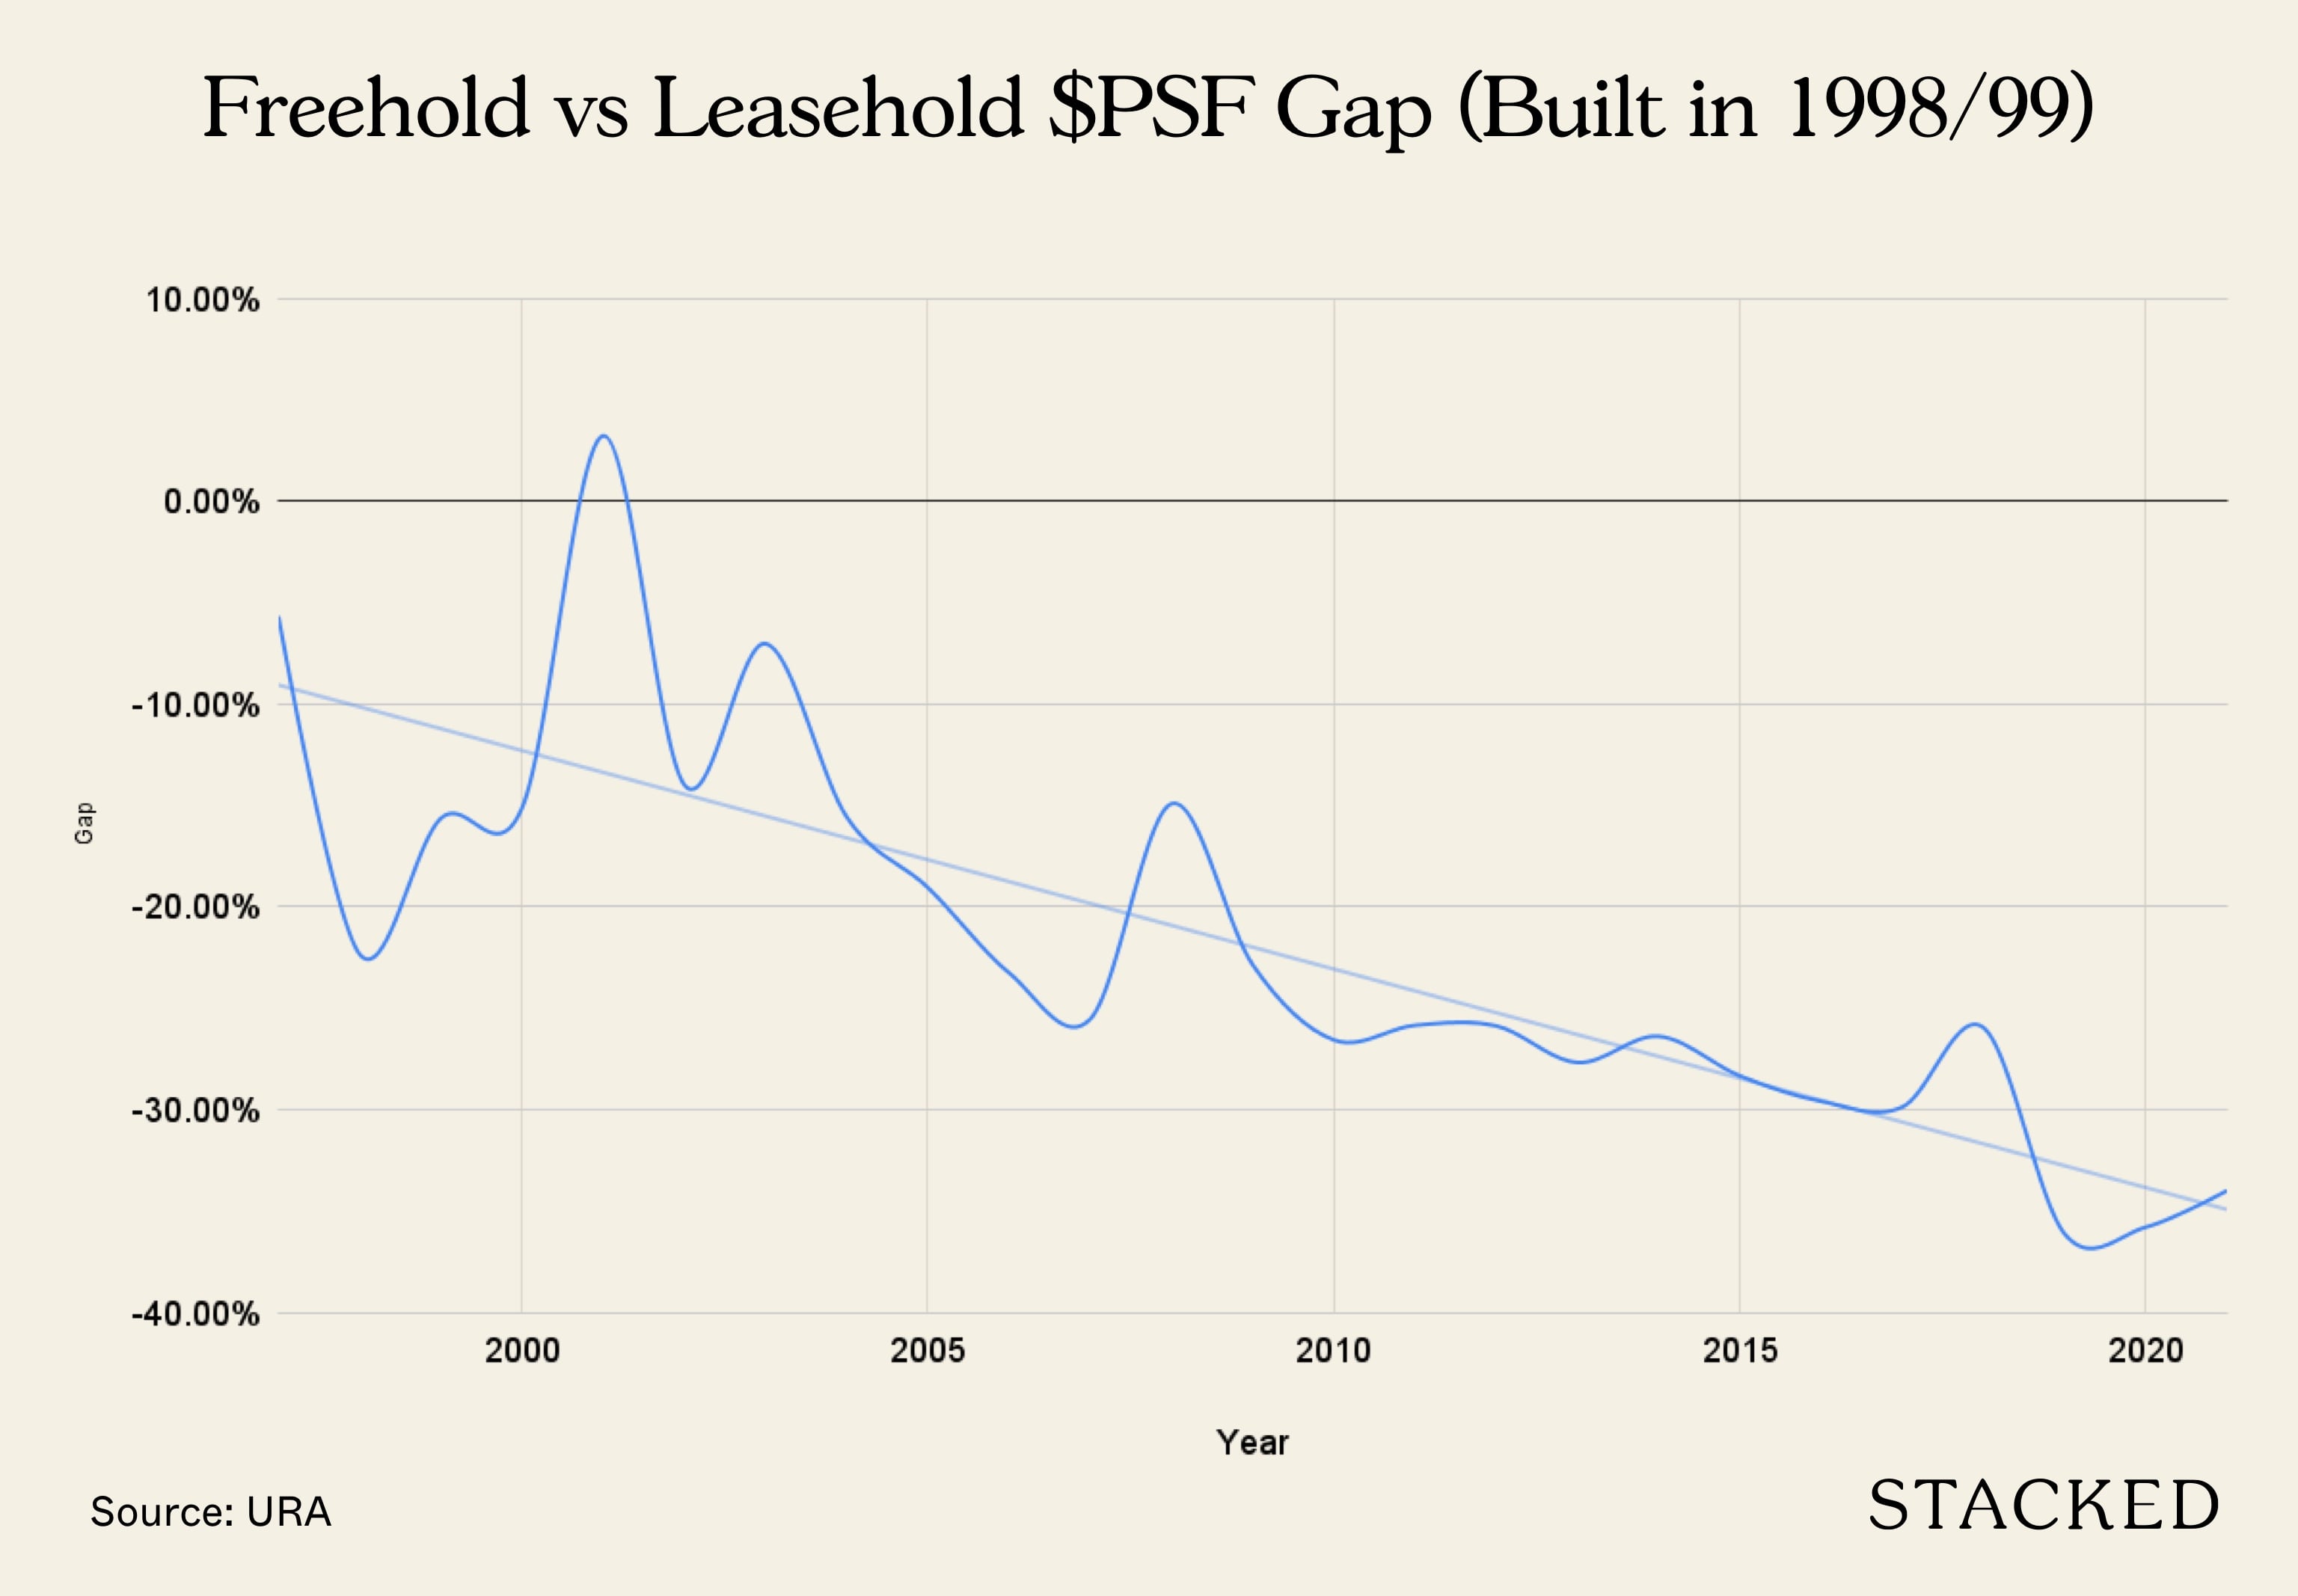
Of course, this is across Singapore which means that different projects of different ages are included. For a fairer measure of this, we decided to track landed properties built in 1998 and 1999. Here’s what the $PSF looks like over time since then:
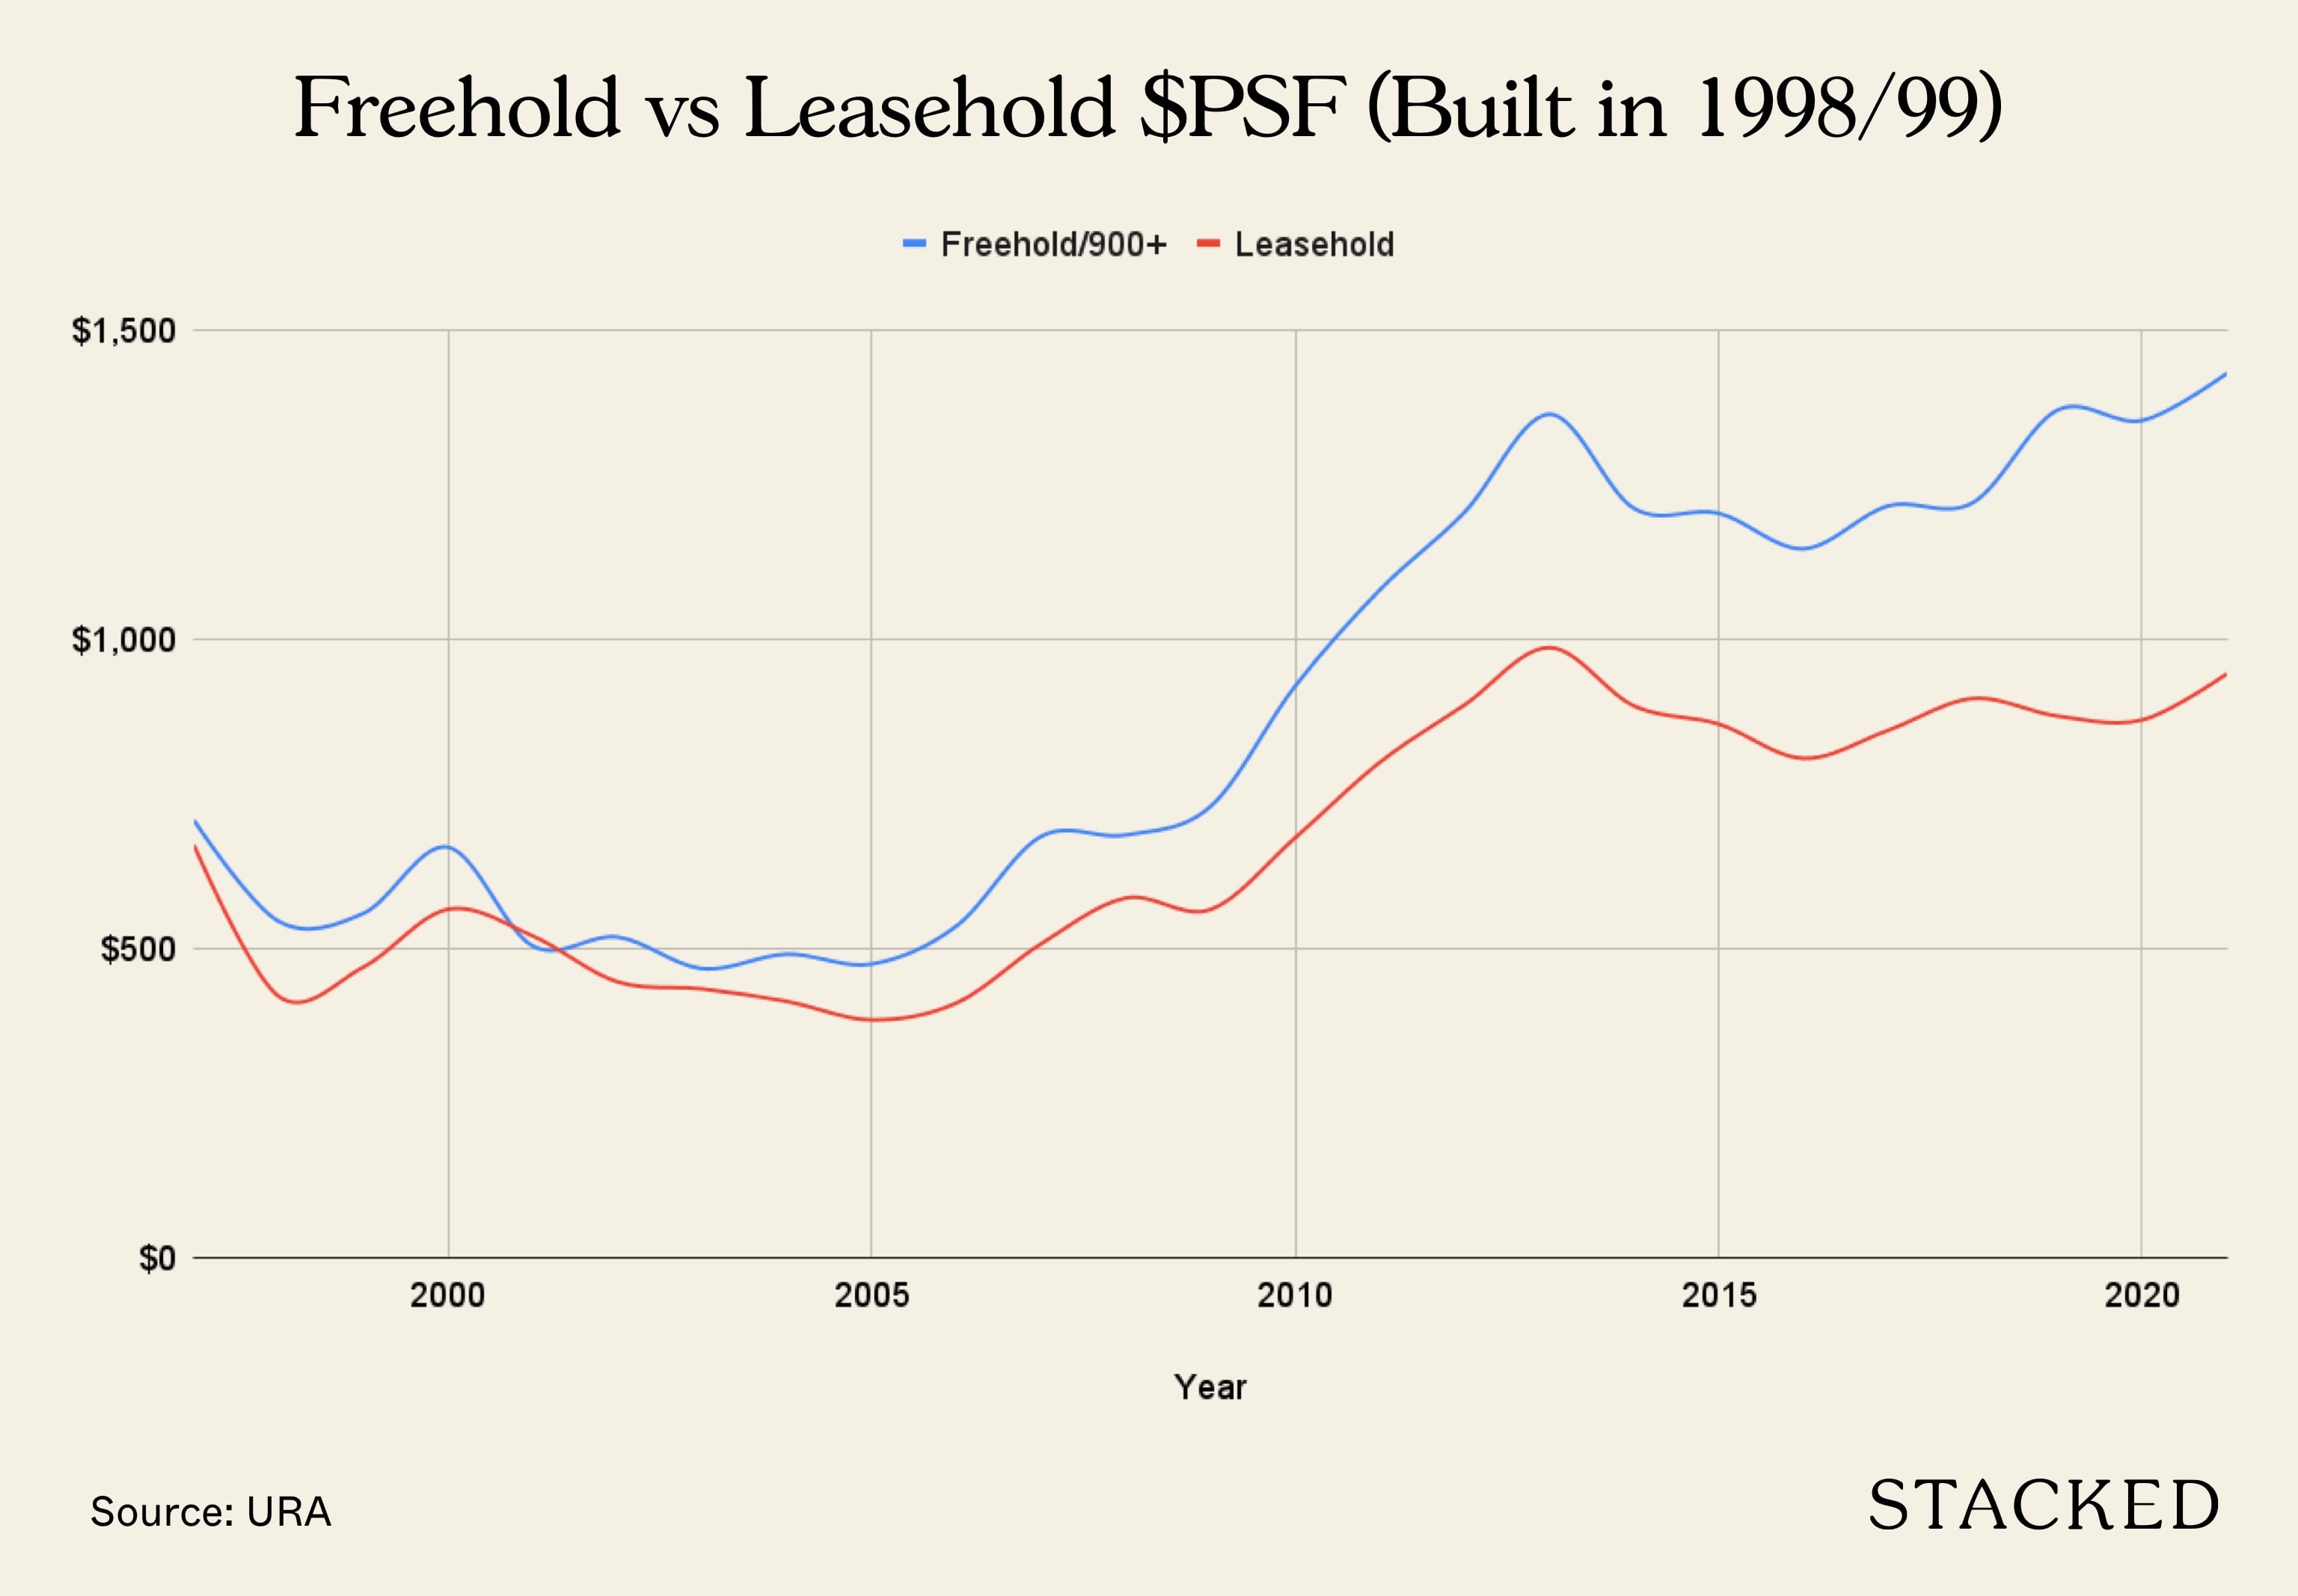
While both tenures increased over time, it’s clear that the gap between freehold and leasehold landed homes grow over time:
On the other hand, freehold strata housing averaged just around $839 psf, while leasehold cluster housing / townhouses averaged around $743. The difference in $PSF is significantly lower simply because the area used in the calculation is larger since the strata area (which includes the build up) is considered, not the land area. Note that for strata homes, you do not actually own the land the building sits on.
Many people feel an apprehension towards leasehold landed properties as they get older, and that view is quite contrary to the non-landed residential market.
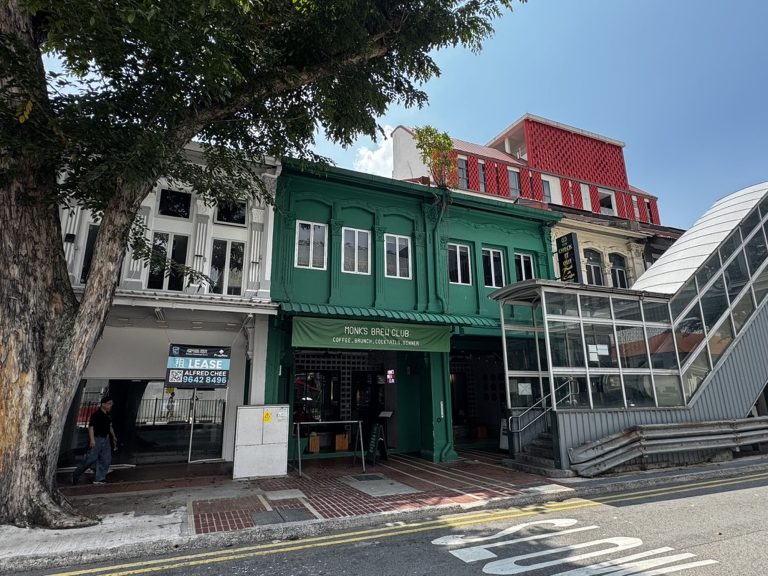
We surmise this is because, for leasehold condos, there’s a chance of en-bloc sale at the end of the road. For leasehold landed properties, however, there’s usually nothing except repossession by the state. Some might point to the possibility of en bloc as in the case of the terrace houses in Guillemard Road (now NoMa). This is a possibility, however, we must remember that many landed homes are also located in areas zoned as landed by URA with the intention of maintaining the neighbourhood characteristics. For these areas, the odds of an en bloc are lower.
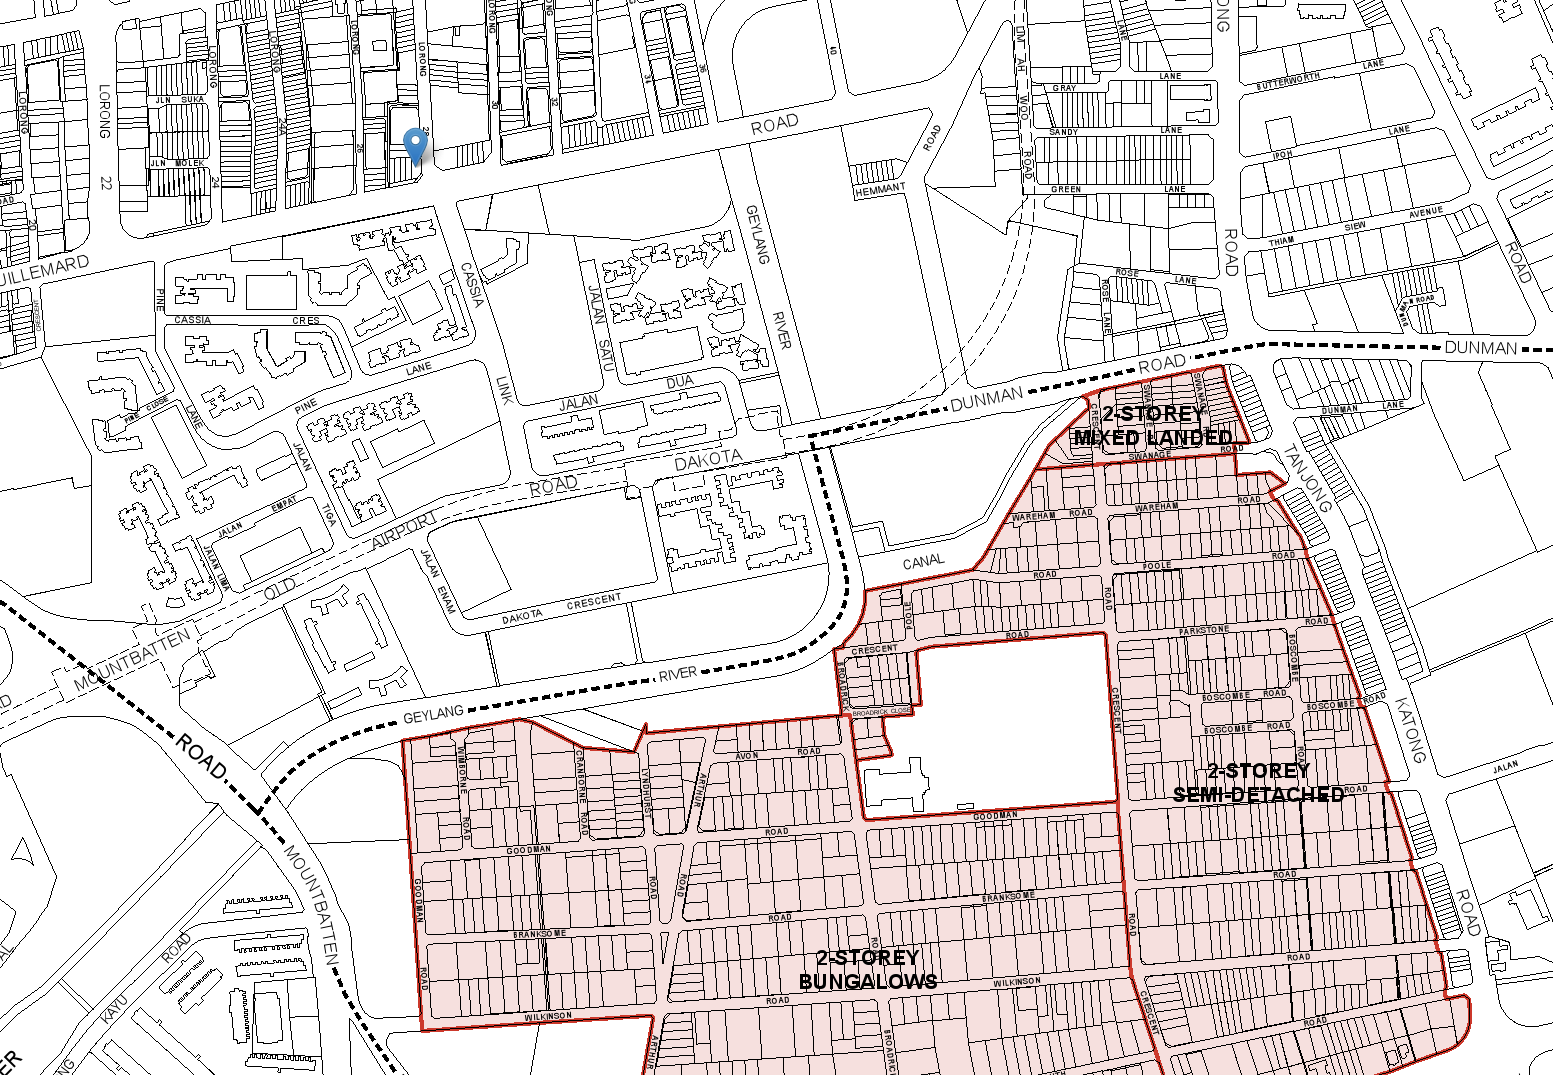
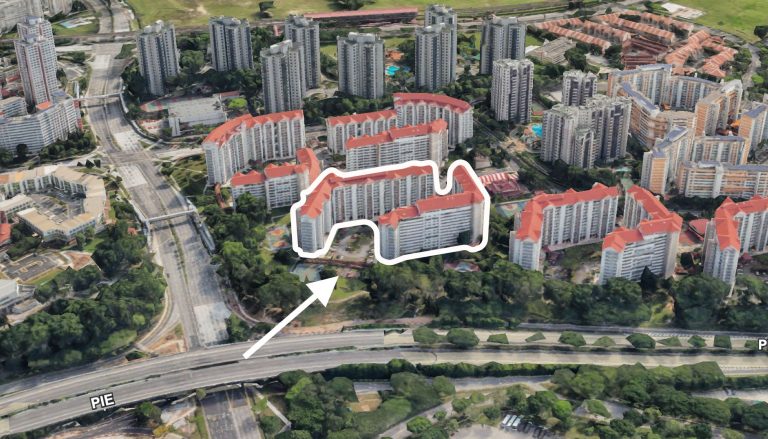
From URA’s control plans, you can see how come landed areas are zoned as such, while others aren’t which means there is a good chance of building it up.
As such, leasehold landed properties may always perform worse in the long run, compared to freehold counterparts. As leasehold homes get older, and awareness of this increases, it will likely widen the gap between freehold and leasehold landed.
However, note that for cluster housing/townhouses, the price gap between freehold and leasehold is less glaring; it’s not much wider today compared to the past decade. Again, this could be related to en-bloc prospects. Unlike “true landed” properties, cluster homes at least have a shot at collective sales!
General landed home prices by district
Do note that not all districts are included as some have few transactions. The $PSF above is calculated based on only leasehold landed properties (exclude strata landed homes).
Here’s what the $PSF looks like by region (we did it this way as there are too many districts to show in 1 chart):
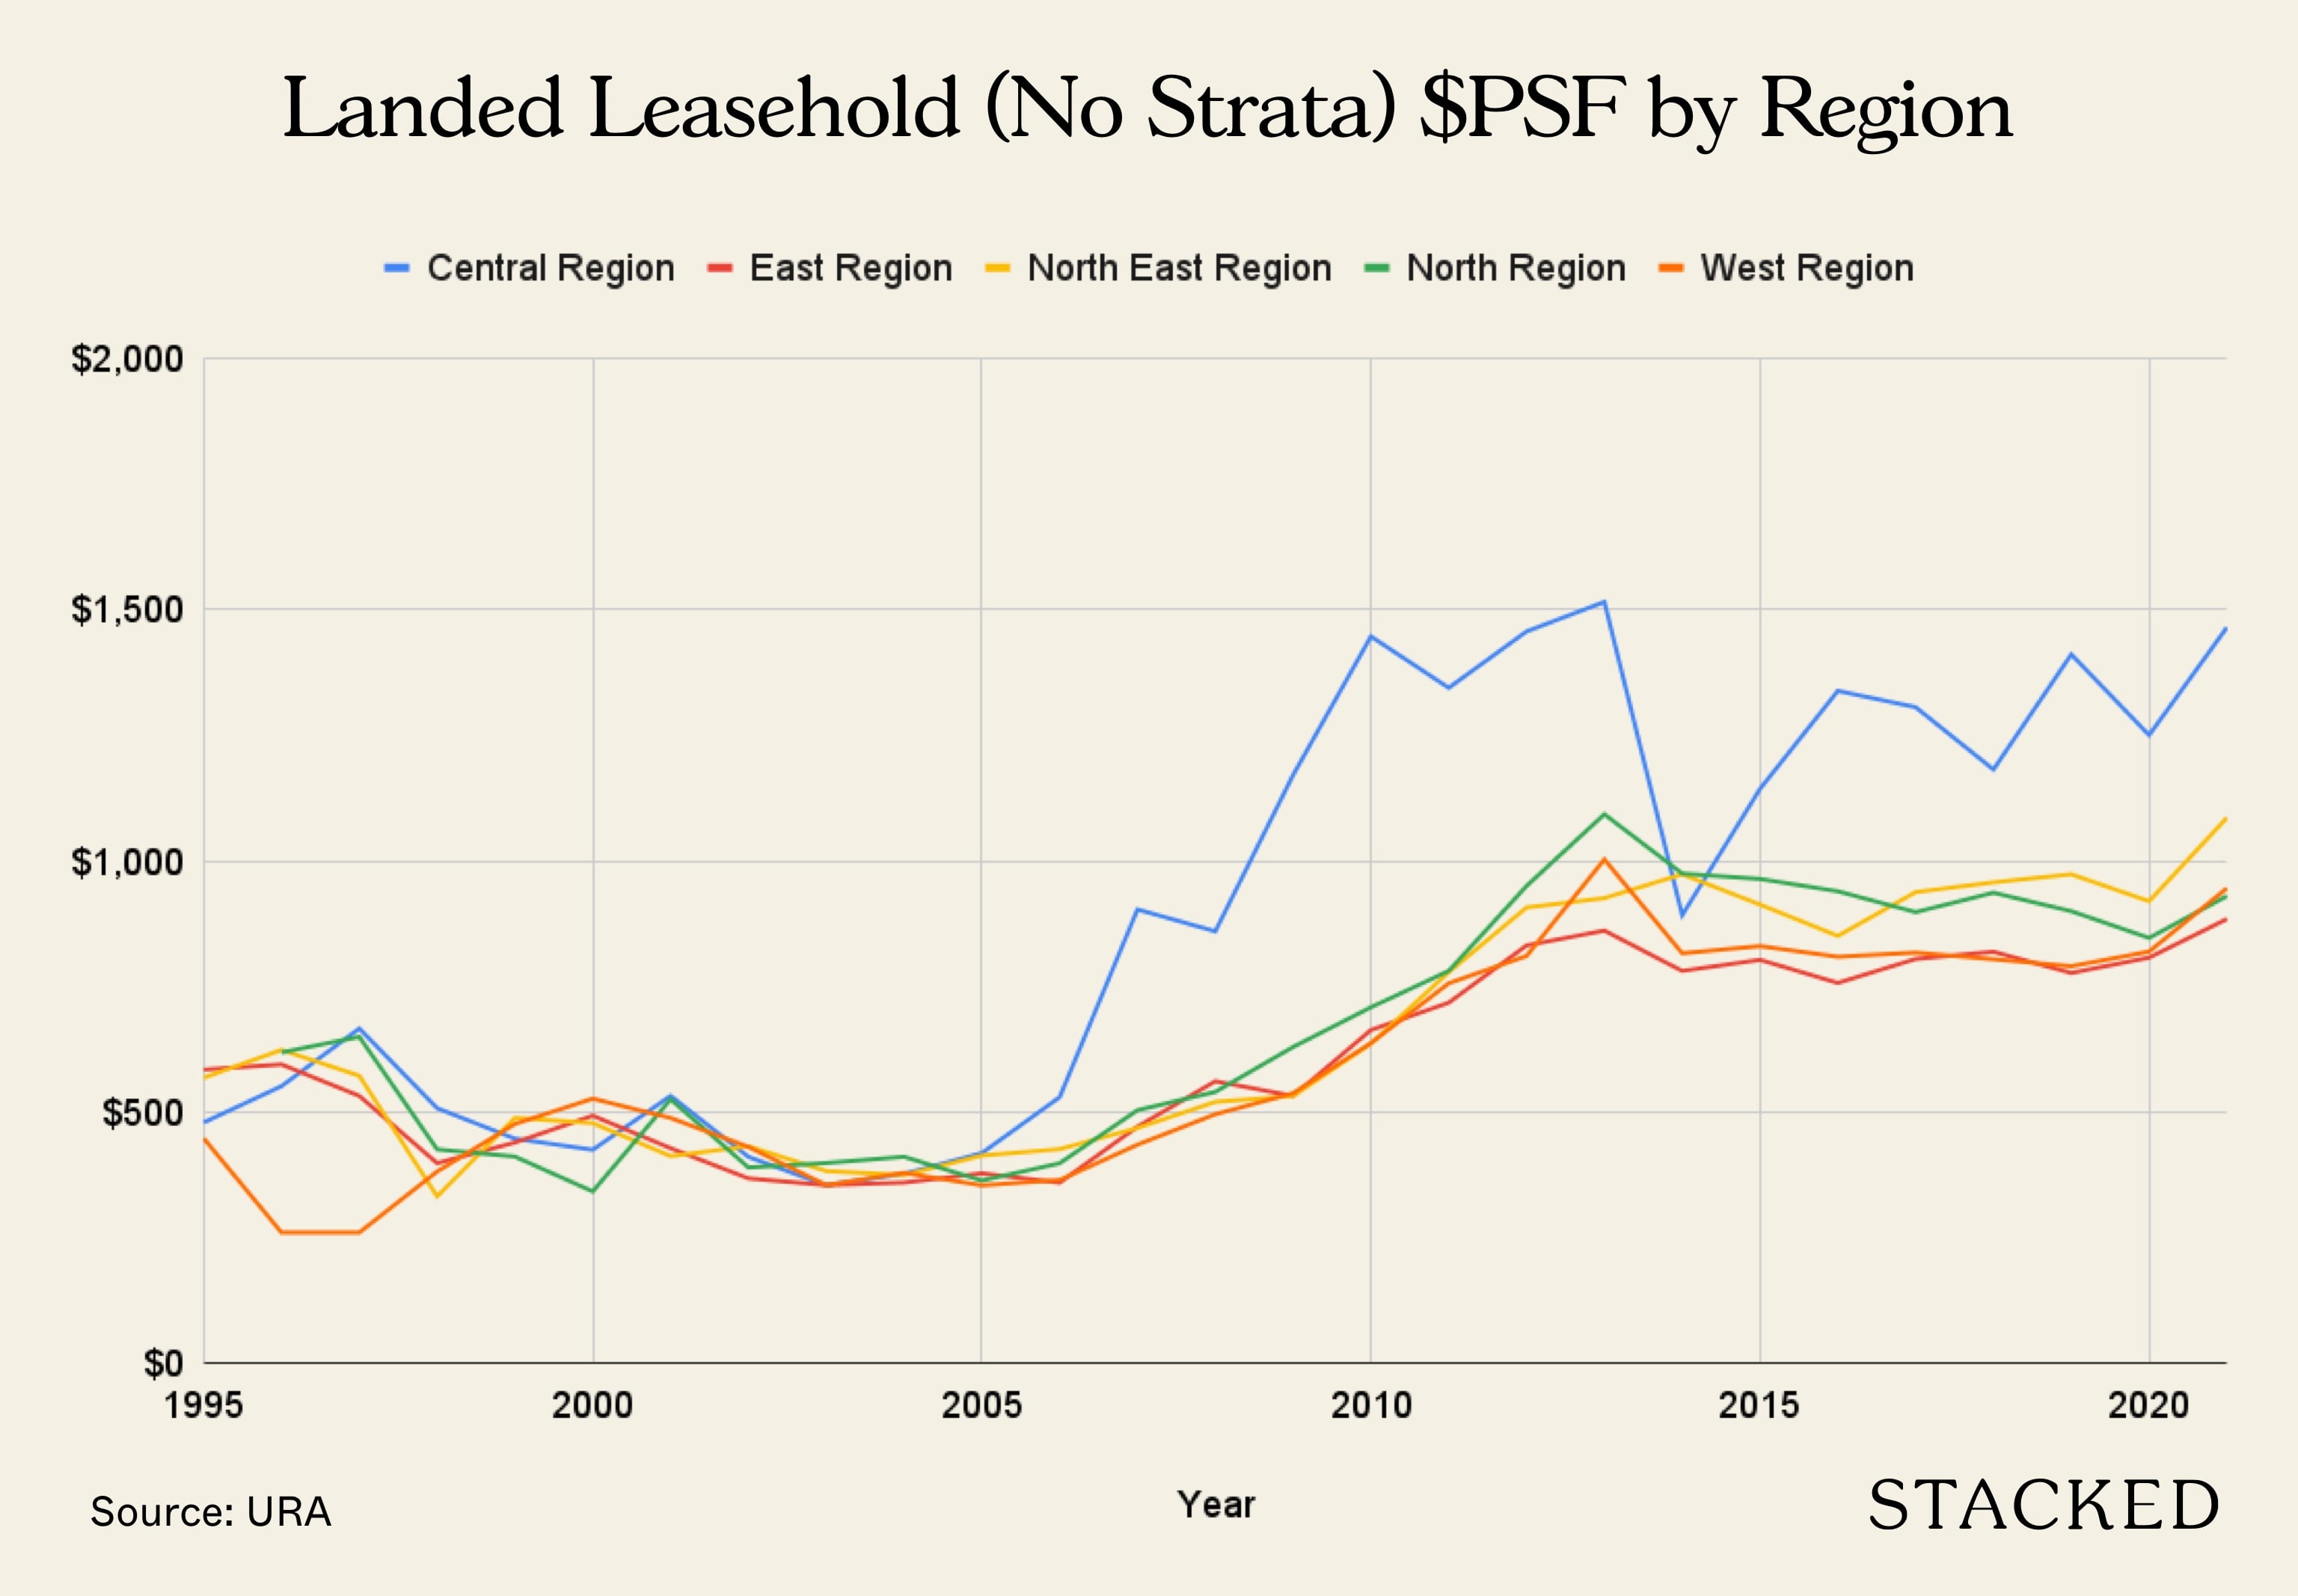
Note that the big price hikes in the central region – which started around 2006 – were largely due to the rising demand for Sentosa Cove properties. The subsequent crash was also due to Sentosa Cove’s sharp decline in popularity, following cooling measures like the Additional Buyers Stamp Duty (ABSD).
(We have more about Sentosa Cove in this earlier article.)
| Year | Central Region | East Region | North East Region | North Region | West Region |
| 1995 | $479 | $585 | $569 | $448 | |
| 1996 | $552 | $595 | $624 | $619 | $260 |
| 1997 | $667 | $532 | $573 | $650 | $261 |
| 1998 | $508 | $399 | $332 | $426 | $382 |
| 1999 | $447 | $440 | $489 | $412 | $477 |
| 2000 | $425 | $493 | $478 | $342 | $527 |
| 2001 | $532 | $428 | $412 | $526 | $489 |
| 2002 | $411 | $368 | $432 | $390 | $431 |
| 2003 | $355 | $355 | $383 | $399 | $355 |
| 2004 | $377 | $360 | $375 | $411 | $379 |
| 2005 | $418 | $378 | $414 | $364 | $354 |
| 2006 | $530 | $360 | $426 | $398 | $365 |
| 2007 | $904 | $471 | $469 | $504 | $435 |
| 2008 | $860 | $562 | $520 | $540 | $496 |
| 2009 | $1,171 | $532 | $532 | $630 | $538 |
| 2010 | $1,447 | $664 | $637 | $709 | $638 |
| 2011 | $1,345 | $718 | $779 | $781 | $757 |
| 2012 | $1,457 | $832 | $907 | $950 | $811 |
| 2013 | $1,516 | $861 | $926 | $1,093 | $1,003 |
| 2014 | $892 | $781 | $974 | $975 | $816 |
| 2015 | $1,144 | $803 | $913 | $964 | $831 |
| 2016 | $1,339 | $757 | $851 | $940 | $809 |
| 2017 | $1,306 | $805 | $938 | $898 | $818 |
| 2018 | $1,182 | $819 | $958 | $937 | $804 |
| 2019 | $1,411 | $777 | $974 | $900 | $791 |
| 2020 | $1,251 | $808 | $920 | $847 | $820 |
| 2021 | $1,465 | $884 | $1,086 | $930 | $946 |
In most recent days, realtors noted that demand has been strongest in Districts 19, 15, 28, 16, 10, and 20. We’re informed these six districts accounted for over half (61 per cent) of landed home transactions between 2018 to 2021.
From our own wider findings, landed prices in almost every region are closing on their previous peaks. The east and north-east regions have already surpassed their respective peaks in 2013 and 2014.
In the north and west, prices average $930 psf and $946 psf respectively. This is still down from their respective peaks of $1,093 and $1,003, in 2013.
In the central region, prices average $1,465 psf, still under the 2013 peak price of $1,516.69 psf. However, realtors we spoke to said that – given the current momentum – they expect prices will reach the 2013 peak by early 2022.
Price movement by unit type
| Year | Detached House | Semi-Detached House | Terrace House |
| 1995 | $161 | $385 | $636 |
| 1996 | $350 | $541 | $607 |
| 1997 | $409 | $647 | $526 |
| 1998 | $334 | $413 | $405 |
| 1999 | $333 | $416 | $491 |
| 2000 | $357 | $450 | $516 |
| 2001 | $384 | $432 | $504 |
| 2002 | $411 | $339 | $432 |
| 2003 | $332 | $307 | $405 |
| 2004 | $257 | $353 | $405 |
| 2005 | $234 | $357 | $413 |
| 2006 | $396 | $400 | $417 |
| 2007 | $624 | $545 | $539 |
| 2008 | $473 | $597 | $605 |
| 2009 | $1,119 | $589 | $561 |
| 2010 | $1,631 | $772 | $711 |
| 2011 | $1,289 | $736 | $792 |
| 2012 | $1,519 | $911 | $906 |
| 2013 | $1,663 | $1,046 | $951 |
| 2014 | $948 | $821 | $863 |
| 2015 | $1,173 | $860 | $878 |
| 2016 | $1,050 | $791 | $918 |
| 2017 | $1,322 | $895 | $903 |
| 2018 | $1,108 | $885 | $899 |
| 2019 | $953 | $844 | $954 |
| 2020 | $1,055 | $864 | $905 |
| 2021 | $1,343 | $989 | $1,015 |
The price movement between unit types (detached, semi-detached, and terrace) shows less difference, compared to factors like freehold versus leasehold.

Note that the more volatile prices for detached homes (i.e., bungalows) can mostly be credited to Sentosa Cove; we’ve explained the price swings here above.
Otherwise, there’s no clear indicator that detached units, semi-detached units, or terrace houses perform better than their counterparts.
The good news for buyers is that, between Q1 and Q2 2021, momentum has slowed for landed homes.
Q1 2021 saw a large surge in landed home prices, with an increase of almost 6.7 per cent from Q4 2020. As of Q2, however, landed prices rose only 0.8 per cent.
While demand is far from quenched, it could at least mean price growth has slowed. Realtors on the ground noted that, as sellers detect the eagerness of buyers, many have started to raise prices to less palatable levels.
In addition, returns to Heightened Alert, or other upcoming Covid-restrictions, seem probable right now; this could further drag down transaction volumes, after the strong surge last quarter.
If you’re looking for an investment, stick to freehold.
If you’re looking for a home or an indulgence, a leasehold landed property might make more sense.
Barring significant changes, it’s clear that buyers looking to leave a legacy, seek further asset progression, etc., should be looking at freehold landed. This should ideally be a “true landed” property, and not cluster housing; strata-titled landed homes can be a hit or miss, in comparison to their counterparts.
However, those looking purely at homeownership (e.g., you don’t care about resale gains, because you just want to live out your remaining years there) may want to pick leasehold.
A price gap of 34 per cent can make or break retirement savings – and there may be no difference in quality or lifestyle; a freehold unit doesn’t necessarily mean a better view or more amenities.
Finally, note that a return of foreign buyers could help leasehold landed to catch up
Realtors pointed out that foreign buyers can’t purchase freehold, landed properties on the mainland; not barring special permission. As such, foreigners are the main demographic for leasehold landed homes; especially on Sentosa Cove.
(Singaporeans overwhelmingly prefer freehold units on the mainland).
As such, any easing of Additional Buyers Stamp Duty (ABSD) on foreigners, or a return of foreign investors after Covid-19, could narrow the price gap between leasehold and freehold landed.
In our follow-up article, we’ll look at where to find some of the lowest-priced freehold housing, so follow us on Stacked for an update. You can also follow us for in-depth reviews of new and resale properties alike.
At Stacked, we like to look beyond the headlines and surface-level numbers, and focus on how things play out in the real world.
If you’d like to discuss how this applies to your own circumstances, you can reach out for a one-to-one consultation here.
And if you simply have a question or want to share a thought, feel free to write to us at stories@stackedhomes.com — we read every message.


4 Comments
If the house on leasehold landed property is the MAXIMUM allowable based on regulations, then the value of the property is in the built-up space (not the land) because it is often not worth it to demolish the house to build a new house of the same size. Therefore, leasehold landed property should be compared to other leasehold properties like HDB flats and leasehold condos.
HDB flats are selling for as high as $1,170 per sq ft. This should be used as comparable (or point of reference) for leasehold landed property (if, as described above, it is the maximum built-up area) with the land included at no extra charge.
Comparing freehold and leasehold landed property is an “apple-and-oranges” comparison because the former is bought for investment while the latter is for housing (like HDB and leasehold condo).
Any idea whats the ratio of freehold to leasehold landed property in singapore?