Why Some Old 99-Year Condos Can Still Be Worth Investing In: Here’s The Math
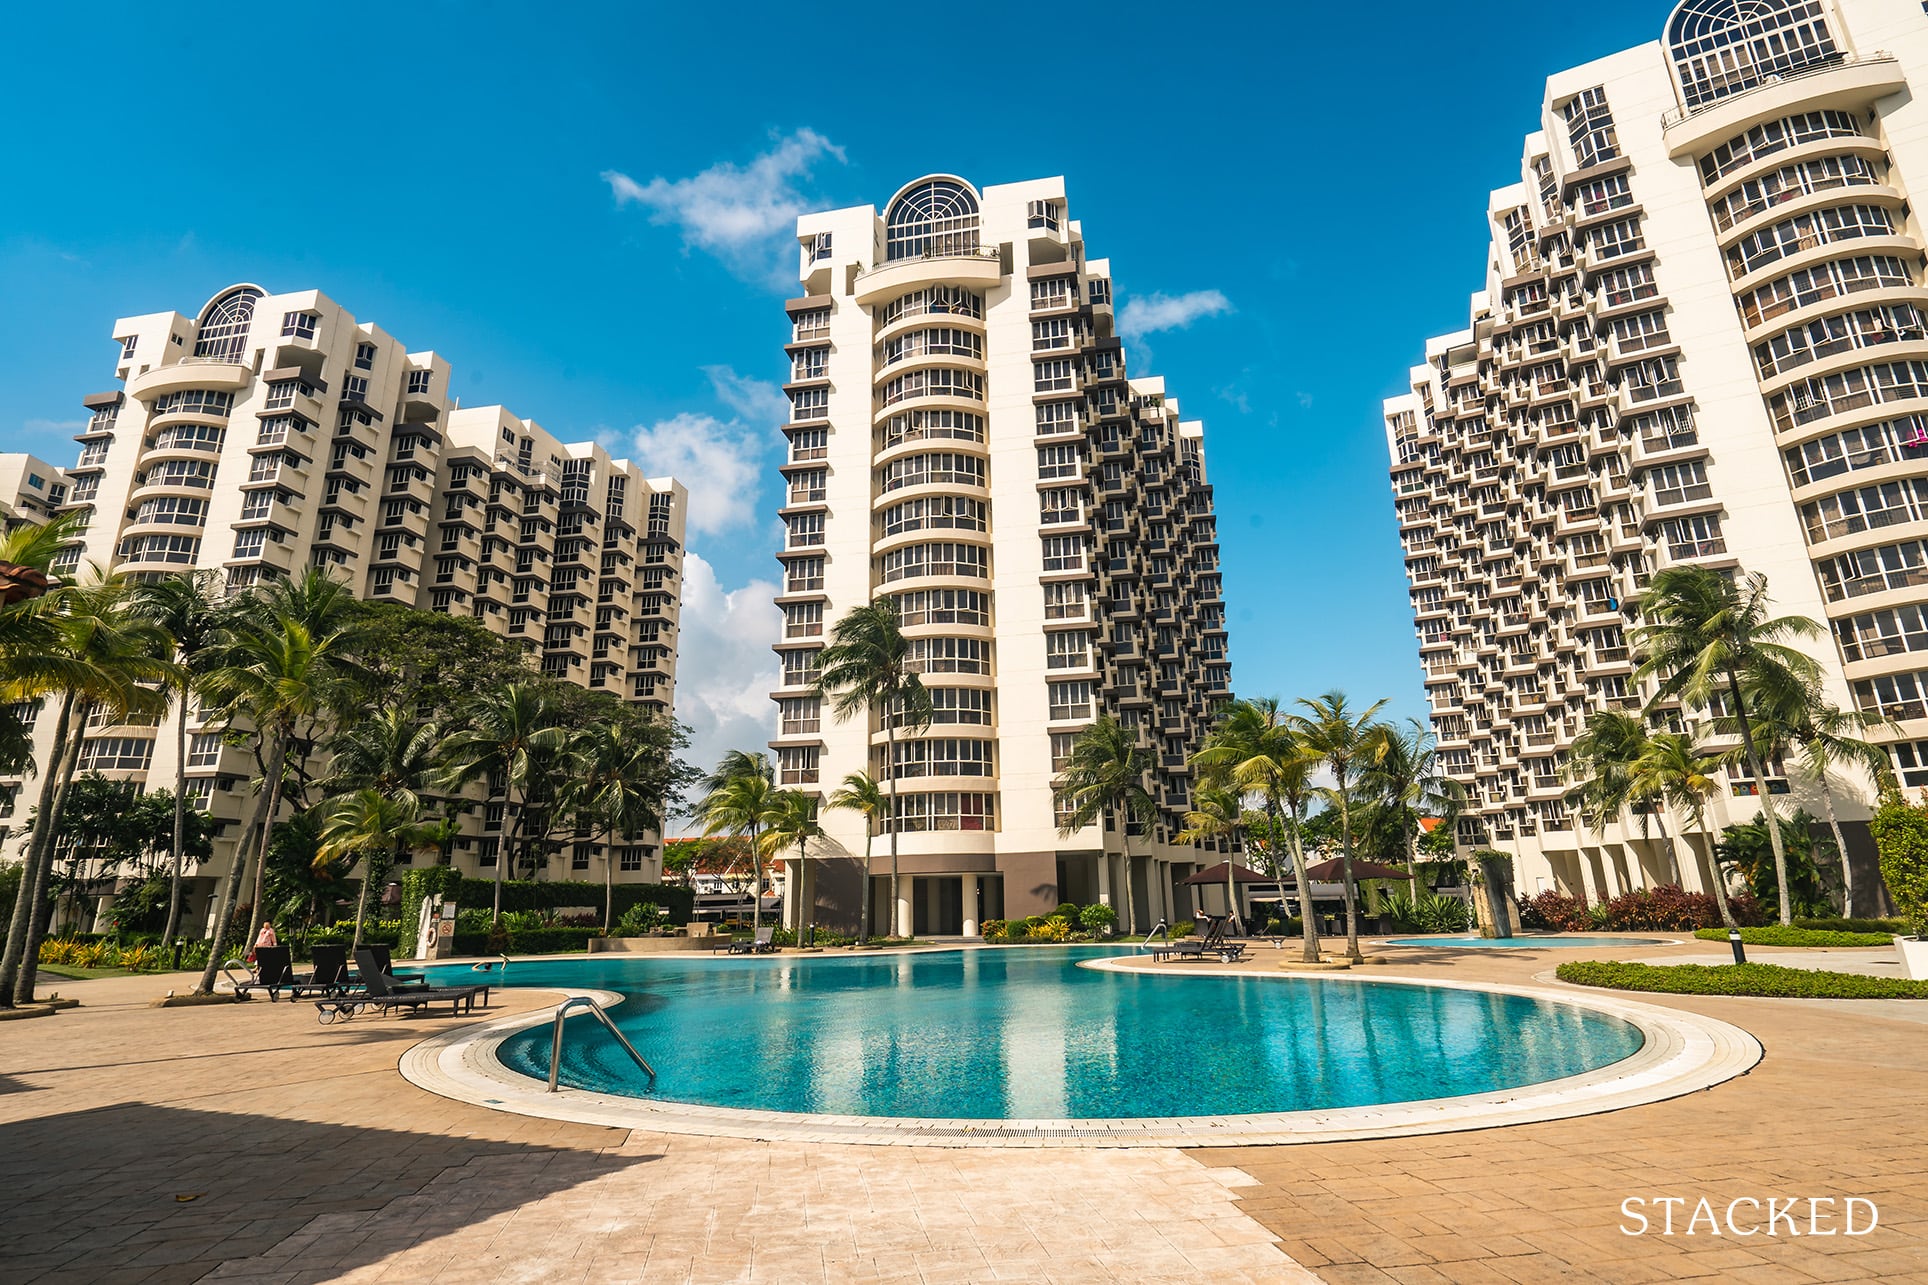
Get The Property Insights Serious Buyers Read First: Join 50,000+ readers who rely on our weekly breakdowns of Singapore’s property market.
A seasoned content strategist with over 17 years in the real estate and financial journalism sectors, Ryan has built a reputation for transforming complex industry jargon into accessible knowledge. With a track record of writing and editing for leading financial platforms and publications, Ryan's expertise has been recognised across various media outlets. His role as a former content editor for 99.co and a co-host for CNA 938's Open House programme underscores his commitment to providing valuable insights into the property market.
There’s no shortage of biases in the Singapore property market. Some long-time investors swear by freehold properties, while others prefer resale homes, finding new launch prices too steep. And if you’ve spoken to a property agent, you’ve likely heard the pitch that new launches are the best choice for capital appreciation.
These assumptions have led to misconceptions, especially about older leasehold projects. Far from being obsolete, many of these developments remain solid investments – and might just be the hidden gems of the property market. To show why some of these overlooked properties deserve a second look in 2024, let’s explore some surprising comparisons:
Changi Court versus The Lakeshore
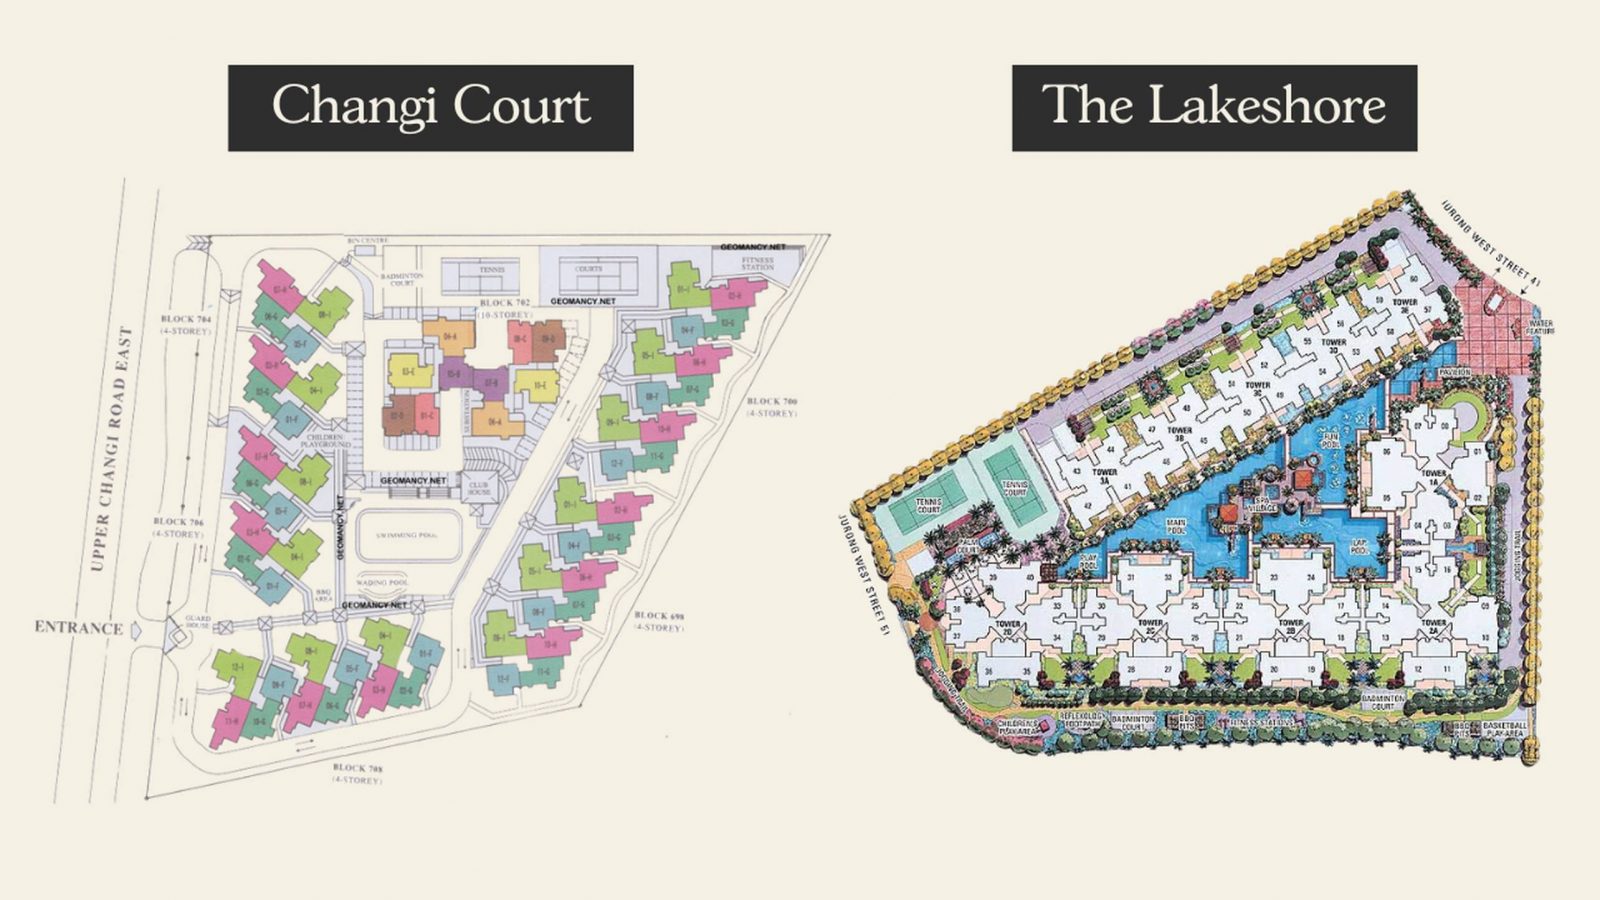
Changi Court is an older freehold property along Upper Changi Road East. This 297-unit condo was completed in 1997. While the immediate surroundings are sparse on amenities, it has several strong rental advantages: the SIA Training Centre is close to this condo, making the condo convenient for foreign staff and trainees. Second, the SUTD campus is almost next to Changi Court, making it a popular rental choice for foreign students and teaching staff. And third, the Upper Changi MRT station (DTL) is right next to this condo, which helps to make up for the fewer amenities.
The Lakeshore is newer and bigger: this leasehold, 848-unit leasehold condo is in Jurong West, and within walking distance to Lakeside MRT station (EWL). The Lakeshore does have a much nicer waterfront view though. The Lakeshore also doesn’t have any big malls nearby, though it does share some heartland amenities with the nearby HDB enclave, including an NTUC and Giant.
But does The Lakeshore’s leasehold status worsen its performance, especially since it’s coming to 20 years old? Let’s compare the two and see how it pans out:
Here’s a look at the numbers for a unit at Changi Court:
| Changi Court (FH TOP 1997) | |
| 2016 Purchase Price | $1,120,000.00 |
| Stamp Duty | $29,400.00 |
| Conveyancing Fee (Legal Fees) | $3,200.00 |
| Downpayment | $280,000.00 |
| Annual Value | $30,000.00 |
| Over 8 Years | |
| Property Tax | $28,800.00 |
| Rental (Y1-Y8) | $265,956.00 |
| Agency Fee (Y1-Y8) | $12,078.84 |
| MCST (Assumed 400/month) | $38,400.00 |
| Including Returns and Costs | |
| Total Rental Received | $265,956.00 |
| Total Costs (incl. SD) | $111,878.84 |
| Total Monthly Repayments | $331,345.28 |
| PNL | -$177,268.11 |
| Based on historical ROR | 3.24% |
| 2024 Sale Price | $1,445,000.00 |
| Loan Redemption Amount | $679,719.00 |
| Agency Fee | $31,501.00 |
| Conveyancing Fee (Legal Fees) | $2,200.00 |
| Proceeds | $731,580.00 |
| Net Proceeds | $554,311.89 |
| Initial Investment (Downpayment) | $312,600.00 |
| Total Returns | 77.32% |
| Annualized Returns | 8.53% |
| Net Cost Per Year | $51,328.01 |
| Average Rent Per Year | $33,244.50 |
| Net Rental Yield | -1.61% |
| Gross Rental Yield from Pur.P | 2.97% |
(Note that for our comparison, we are using a unit purchased in 2016)
Now let’s look at the numbers for a unit at The Lakeshore:
| The Lakeshore (LH TOP 2008) | |
| Purchase Price | $1,180,000.00 |
| Stamp Duty | $31,800.00 |
| Conveyancing Fee (Legal Fees) | $3,200.00 |
| Downpayment | $295,000.00 |
| Annual Value | $30,000.00 |
| Over 8 Years | |
| Property Tax | $28,800.00 |
| Rental (Y1-Y8) | $350,550.00 |
| Agency Fee (Y1-Y8) | $15,920.81 |
| MCST (Assumed 400/month) | $38,400.00 |
| Including Returns and Costs | |
| Total Rental Received | $350,550.00 |
| Total Costs (incl. SD) | $118,120.81 |
| Total Monthly Repayments | $349,095.92 |
| PNL | -$116,666.73 |
| Based on historical ROR | 4.04% |
| 2024 Sale Price | $1,620,000.00 |
| Loan Redemption Amount | $716,132.00 |
| Agency Fee | $35,316.00 |
| Conveyancing Fee (Legal Fees) | $2,200.00 |
| Proceeds | $866,352.00 |
| Net Proceeds | $749,685.27 |
| Initial Investment (Downpayment) | $330,000.00 |
| Total Returns | 127.18% |
| Annualized Returns | 12.44% |
| Net Cost Per Year | $54,027.09 |
| Average Rent Per Year | $43,818.75 |
| Net Rental Yield | -0.87% |
| Gross Rental Yield from Pur.P | 3.71% |
We can see the leasehold Lakeshore outperforms Changi Court in terms of gross rental yield (3.71 per cent, compared to Changi Court’s 2.97 per cent). Note that this is true even though Lakeshore was purchased at a lower quantum.
More from Stacked
Is Your New Launch Within A Popular Primary School Now? 122 New Projects Updated With The New Home-School Distance Changes
One of the biggest concerns among home buyers is school proximity. Even if you don’t have children yourself, it’s well…
There’s also a drastic difference in total returns: The Lakeshore unit saw 12.4 per cent annualised returns over Changi Court’s 8.5 per cent. However, this could be related to Jurong seeing much more in the way of neighbourhood improvements compared to the relatively quiet stretch along Upper Changi Road. This goes to show that sometimes if the location is on the upswing, it can outweigh concerns such as lease status.
Now let’s look at another comparison: Oleander Towers versus Bullion Park
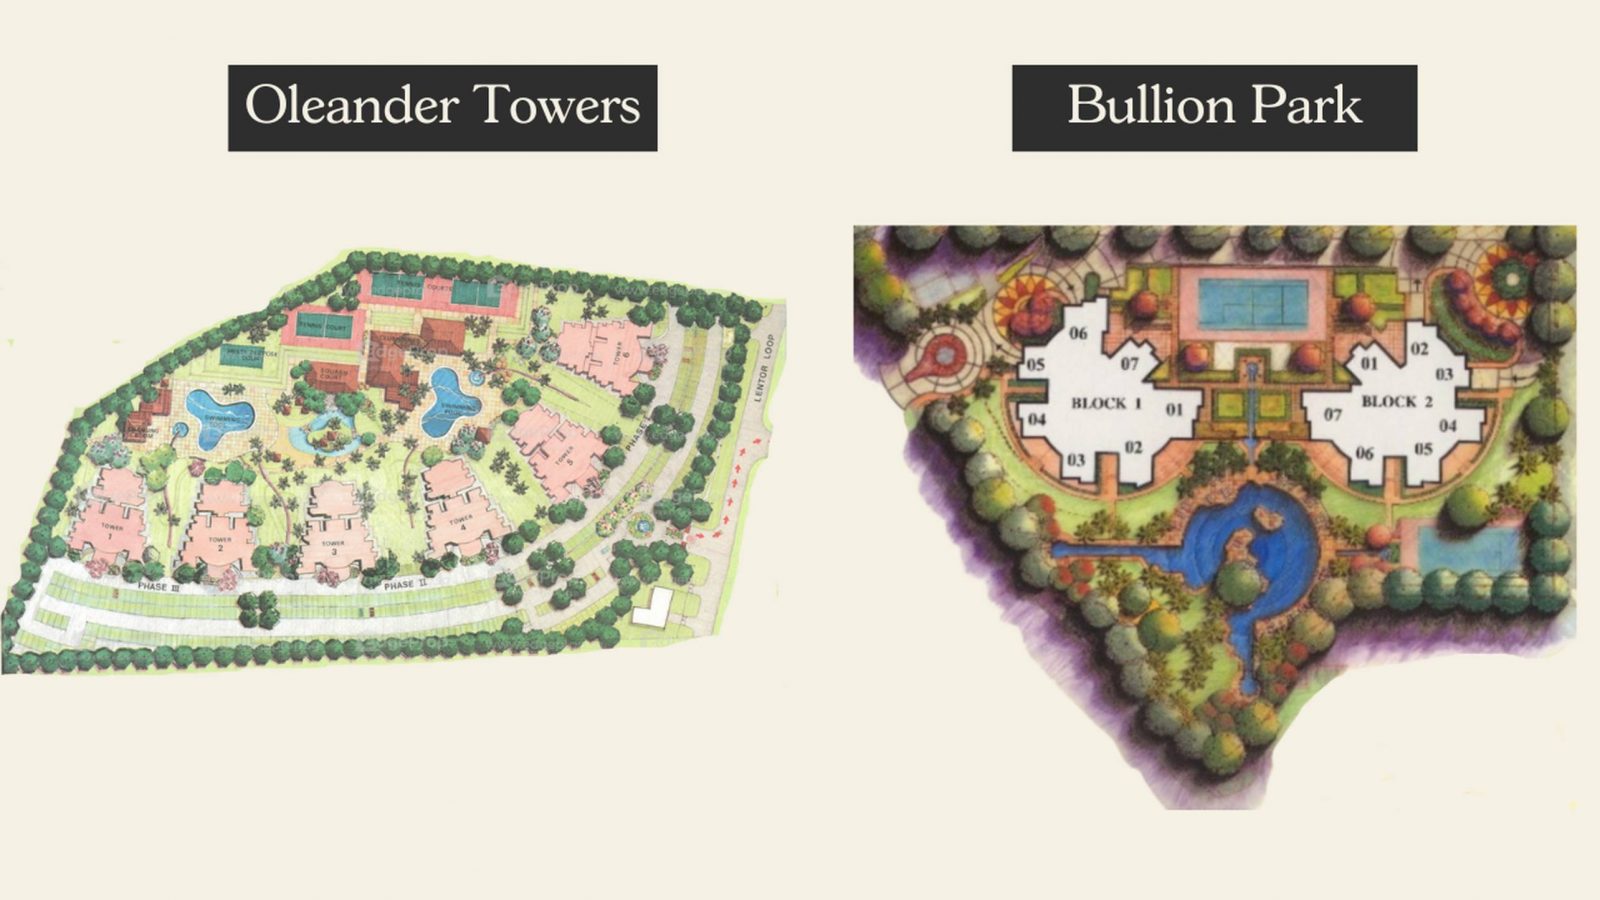
This time let’s look at two projects that are both older, but one is a freehold condo.
Oleander Towers is a leasehold condo with 318 units, dating back to 1998. It’s quite nondescript as far as condos go, being somewhat within Toa Payoh’s HDB enclave. It’s quite easy to underestimate this project, as it blends in with the other residential high-rises; but there’s something to be said for a condo with HDB-level conveniences nearby, and access to Toa Payoh MRT (NSL).
Bullion Park, which we’ve covered for its phenomenal size (albeit in an ulu location) is a freehold project dating back to 1993. This 472 unit condo has benefitted from the emergence of Lentor MRT (TEL), which has resolved some of its longstanding accessibility issues. It’s still by far one of the most spacious condo options in District 26.
Here’s a look at the numbers for a unit at Oleander Towers:
| Oleander Towers (LH TOP 1998) | |
| Purchase Price | $1,138,000.00 |
| Stamp Duty | $30,120.00 |
| Conveyancing Fee (Legal Fees) | $3,200.00 |
| Downpayment | $284,500.00 |
| Annual Value | $30,000.00 |
| Over 8 Years | |
| Property Tax | $28,800.00 |
| Rental (Y1-Y8) | $332,148.00 |
| Agency Fee (Y1-Y8) | $15,085.06 |
| MCST (Assumed 400/month) | $38,400.00 |
| Including Returns and Costs | |
| Total Rental Received | $332,148.00 |
| Total Costs (incl. SD) | $115,605.06 |
| Total Monthly Repayments | $336,670.47 |
| PNL | -$120,127.53 |
| Based on historical ROR | 4.99% |
| 2024 Sale Price | $1,680,000.00 |
| Loan Redemption Amount | $690,643.00 |
| Agency Fee | $36,624.00 |
| Conveyancing Fee (Legal Fees) | $2,200.00 |
| Proceeds | $950,533.00 |
| Net Proceeds | $830,405.47 |
| Initial Investment (Downpayment) | $317,820.00 |
| Total Returns | 161.28% |
| Annualized Returns | 14.71% |
| Net Cost Per Year | $52,369.44 |
| Average Rent Per Year | $41,518.50 |
| Net Rental Yield | -0.95% |
| Gross Rental Yield from Pur.P | 3.65% |
Now, here’s a look at the numbers for a unit at Bullion Park:
| Bullion Park (FH TOP 1992) | |
| Purchase Price | $1,120,000.00 |
| Stamp Duty | $29,400.00 |
| Conveyancing Fee (Legal Fees) | $3,200.00 |
| Downpayment | $280,000.00 |
| Annual Value | $30,000.00 |
| Over 8 Years | |
| Property Tax | $28,800.00 |
| Rental (Y1-Y8) | $259,488.00 |
| Agency Fee (Y1-Y8) | $11,785.08 |
| MCST (Assumed 400/month) | $38,400.00 |
| Including Returns and Costs | |
| Total Rental Received | $259,488.00 |
| Total Costs (incl. SD) | $111,585.08 |
| Total Monthly Repayments | $331,345.28 |
| PNL | -$183,442.36 |
| Based on historical ROR | 4.96% |
| 2024 Sale Price | $1,650,000.00 |
| Loan Redemption Amount | $679,719.00 |
| Agency Fee | $35,970.00 |
| Conveyancing Fee (Legal Fees) | $2,200.00 |
| Proceeds | $932,111.00 |
| Net Proceeds | $748,668.64 |
| Initial Investment (Downpayment) | $312,600.00 |
| Total Returns | 139.50% |
| Annualized Returns | 13.29% |
| Net Cost Per Year | $51,291.29 |
| Average Rent Per Year | $32,436.00 |
| Net Rental Yield | -1.68% |
| Gross Rental Yield from Pur.P | 2.90% |
This time, we can see the annualised returns are practically neck-and-neck, with neither showing a significant edge in terms of pure gains. The tiebreaker between the two, however, comes again in the form of rent: Oleander Tower has a substantially higher gross yield at 3.65 per cent, versus Bullion Park’s 2.9 per cent.
When it comes to picking a unit for investment, beware of generalisations
There are certain theories and sayings that might apply on a collective level. If we were to bunch together all the freehold and all the leasehold condos*, or all the old and the new ones, we may see that in general, one group performs better than the other.
This may not help the individual investor choosing a specific unit, however, as the property market is chock full of exceptions to every rule; and even the rules can change based on prevailing policy measures and market conditions.
The key takeaway then, is to avoid letting collective results prejudice you against a specific project or unit. Even if what you see is older, and even if it doesn’t have freehold status, that doesn’t mean it should immediately be struck off the list. Likewise, a newer freehold unit doesn’t always justify its price point. Make your decision based on localised, specific observations and numbers – not just on wider market movements.
For more on-the-ground observations and reviews (old and new condos alike), follow us on Stacked. If you’d like to get in touch for a more in-depth consultation, you can do so here.
*And even if we did make a collective comparison, it isn’t true that freehold will always come out ahead.
Ryan J
A seasoned content strategist with over 17 years in the real estate and financial journalism sectors, Ryan has built a reputation for transforming complex industry jargon into accessible knowledge. With a track record of writing and editing for leading financial platforms and publications, Ryan's expertise has been recognised across various media outlets. His role as a former content editor for 99.co and a co-host for CNA 938's Open House programme underscores his commitment to providing valuable insights into the property market.Read next from Property Investment Insights
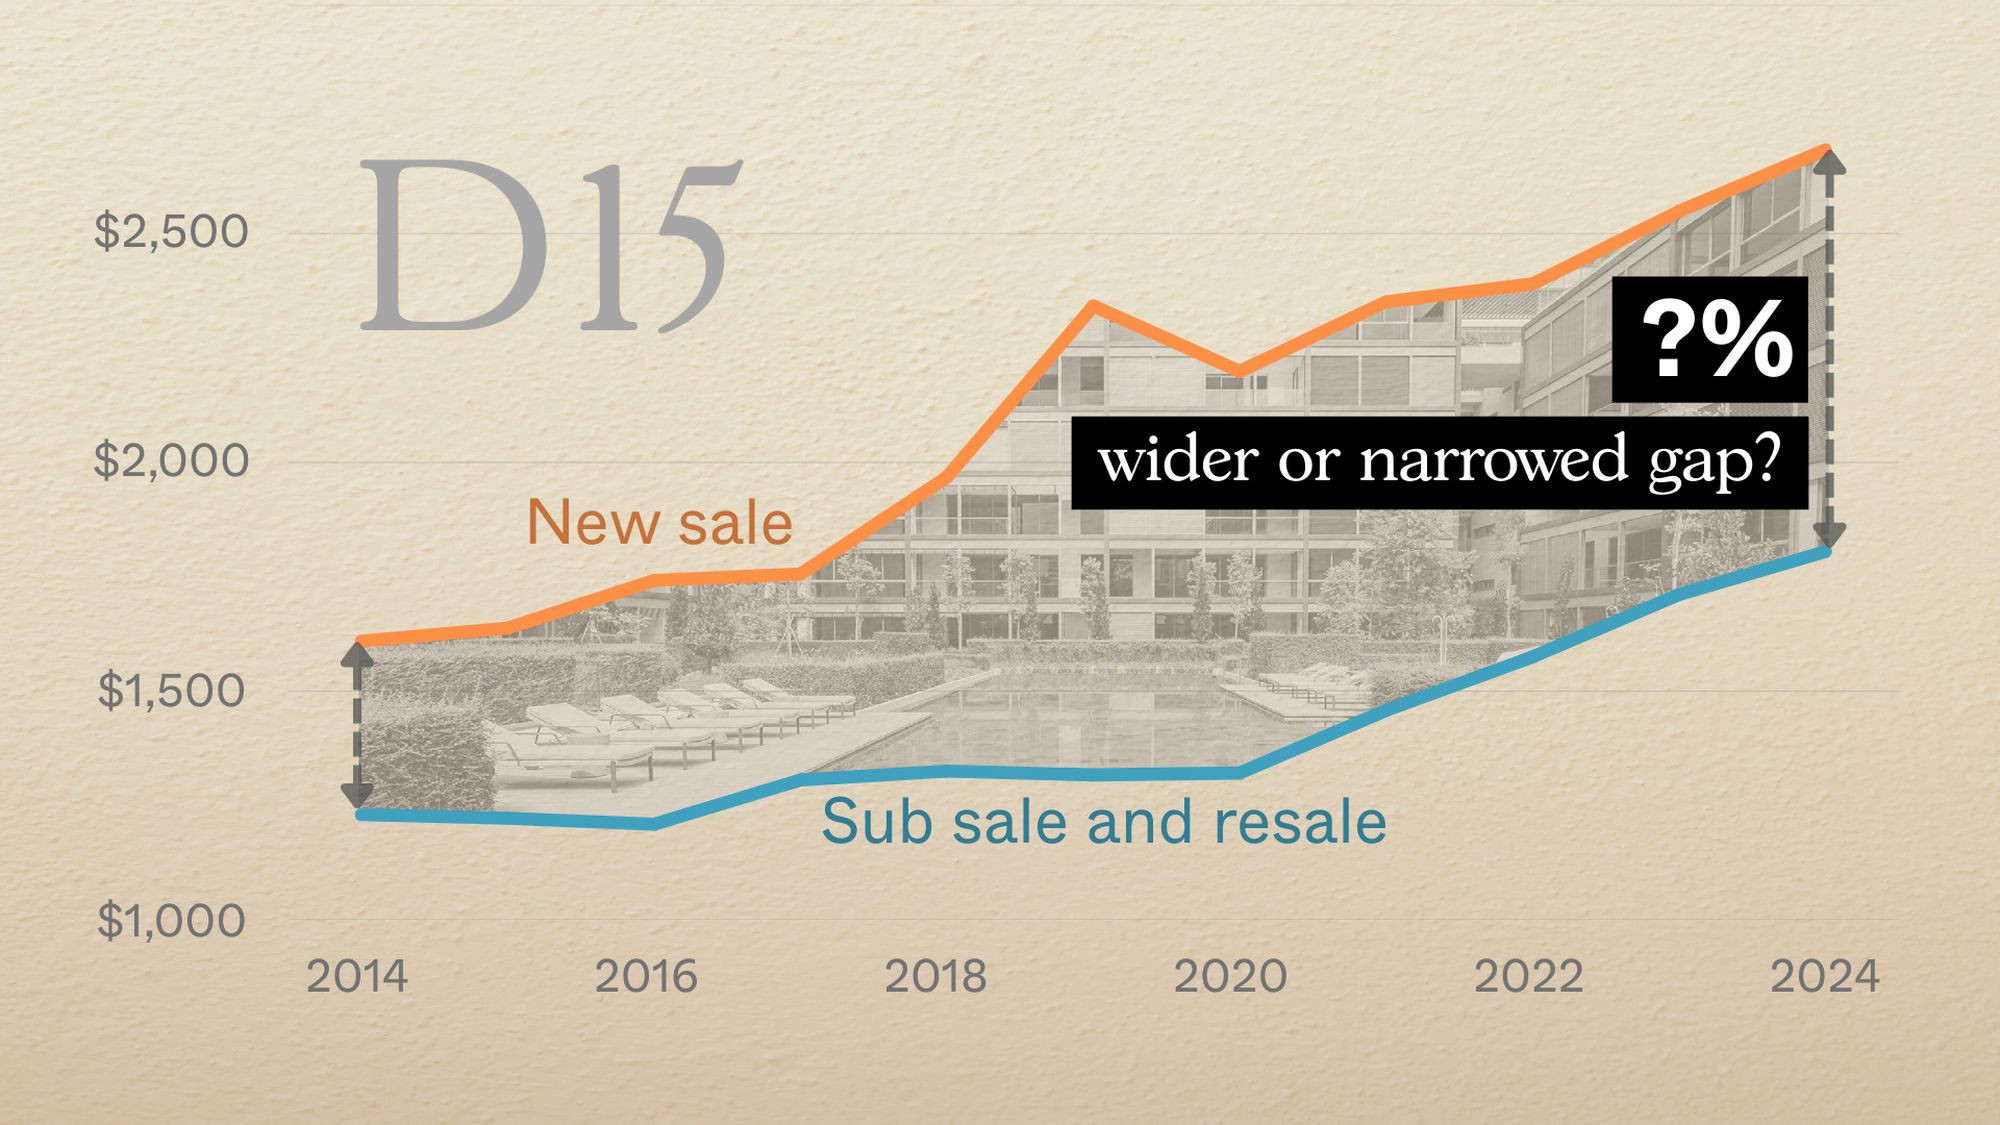
Property Investment Insights District 15 Resale vs New Launch Condos – Analysing Price Gaps for Larger Family Units
Property Investment Insights Are Singapore’s Suburban Condos Still Affordable? The Surprising Truth
Property Investment Insights New Launch vs Resale One and Two Bedders in D15: Here’s Where The Price Gaps Are The Biggest
Property Investment Insights Analysing 10 Years of District 12 Boutique Condo Transactions: Insights Into What Drives Profitability
Latest Posts
Singapore Property News How A Waterfront Development With 4,000 Homes Is Going To Reshape Singapore’s Property Market
On The Market 5 Rare HDB Flats Above 1,700 Sq Ft You Can Buy Right Now – From $850K
On The Market Rare 16,000 Sq ft Freehold Plot In D15 Hits The Market For $39M
Editor's Pick I Transformed My Two-Bedroom Unit Into A Dual-Key Layout – Here’s Why I Would Not Do It Again

Property Market Commentary Why More Families Are Choosing Two-Bedders Over Bigger Properties in 2025

Property Market Commentary What The URA Master Plan Reveals About Marina Bay’s Future (And How It Could Impact Property Values)
Editor's Pick We Toured An ‘Exclusive’ Freehold Landed Enclave In Singapore That Feels Close To Nature – And Even Has A Canal Running Through It
Singapore Property News Where Condo Prices Rose Fastest (and Slowest) in Singapore’s Outside Central Regions

Editor's Pick I Left Singapore for New York and Ended Up Launching a $450M Manhattan Project. Here’s What I Learned About Buying Property Here
On The Market 5 Cheapest Freehold 3-Bedroom Condo Units In Singapore You Can Buy This Week – Including Quiet Spot in Floraville
Editor's Pick Rare Detached Freehold Home On Singapore’s ‘Millionaire’s Row’ Up For Sale At $14m

Editor's Pick The 5 Most Common Property Questions Everyone Asks In Singapore – But No One Can Answer
Editor's Pick A 5-Room HDB In Boon Keng Just Sold For A Record $1.5m – Here’s How Much The Owners Could Have Made
Property Market Commentary 6 Upcoming New Condo Launches To Keep On Your Radar For The Rest Of 2025
Editor's Pick We Toured A Little Known Landed Enclave Where The Last Sale Fetched Under $3 Million


Kudos on your informative, well researched and well analyzed article. Unlike the fluff pieces nowadays (including in the mainstream media), I came away feeling informed and inspired. I do not feel I wasted my 10 mins.
One like wish though – for the nerd in me, it would be lovely if your data table could explain what each row was. E.g. if I don’t know what “cvy fee” is, I’d love to tap on that cell and see a little tooltip or something that explains what it is.
All the best!