


Resale flat prices are finally starting to slow; but that’s not the impression on the ground level. Just about everyone we’ve spoken to continues to complain of high prices, and the sensational reports of million-dollar flats may not be helping. For a more nuanced perspective, we looked at the performance of 3, 4, and 5-room flats across various neighbourhoods.
How the results are derived
We averaged the HDB prices for each month by estate across different flat types. This means that if there happens to be more expensive flats transacted for that month, the prices would be higher. Naturally, this could result in greater inaccuracy especially if we attempt to derive an appreciation rate to this, so we averaged out the rate of return per period (in this case, months) to derive a more accurate appreciation across this year.
Here are the results:
So many readers write in because they're unsure what to do next, and don't know who to trust.
If this sounds familiar, we offer structured 1-to-1 consultations where we walk through your finances, goals, and market options objectively.
No obligation. Just clarity.
Learn more here.
For 5-room flats
| ESTATE | 2023-01 | 2023-02 | 2023-03 | 2023-04 | 2023-05 | 2023-06 | 2023-07 | 2023-08 | Average Returns |
| KALLANG/WHAMPOA | $801,800 | $850,861 | $876,929 | $839,089 | $872,172 | $927,986 | $894,969 | $953,543 | 2.60% |
| BUKIT MERAH | $847,452 | $896,089 | $877,385 | $891,917 | $880,736 | $948,189 | $937,167 | $947,040 | 1.66% |
| SERANGOON | $689,118 | $672,000 | $669,000 | $654,648 | $672,750 | $703,200 | $759,525 | $748,250 | 1.25% |
| SENGKANG | $619,072 | $622,573 | $635,118 | $658,164 | $631,729 | $632,712 | $648,488 | $650,704 | 0.74% |
| ANG MO KIO | $851,104 | $801,833 | $740,270 | $749,657 | $729,099 | $797,571 | $703,592 | $855,359 | 0.61% |
| PASIR RIS | $641,096 | $644,765 | $668,869 | $657,071 | $659,573 | $657,590 | $678,905 | $664,769 | 0.54% |
| JURONG EAST | $632,800 | $639,000 | $634,815 | $670,500 | $667,750 | $662,000 | $643,684 | $655,716 | 0.54% |
| BUKIT PANJANG | $626,667 | $596,571 | $635,288 | $631,676 | $649,635 | $612,387 | $649,667 | $638,308 | 0.37% |
| QUEENSTOWN | $986,000 | $964,378 | $966,429 | $1,094,600 | $957,700 | $1,012,500 | $917,875 | $985,800 | 0.36% |
| GEYLANG | $742,296 | $770,378 | $787,500 | $765,833 | $846,984 | $832,315 | $769,210 | $751,667 | 0.32% |
| YISHUN | $639,100 | $647,127 | $622,737 | $646,319 | $638,448 | $623,786 | $646,706 | $649,950 | 0.28% |
| BEDOK | $688,071 | $656,194 | $693,656 | $747,000 | $748,984 | $699,651 | $717,783 | $695,299 | 0.27% |
| CHOA CHU KANG | $588,605 | $578,021 | $574,922 | $603,222 | $596,101 | $593,889 | $587,131 | $597,605 | 0.24% |
| HOUGANG | $680,325 | $696,639 | $650,118 | $679,460 | $685,799 | $695,057 | $748,985 | $677,696 | 0.11% |
| TAMPINES | $692,019 | $655,700 | $689,924 | $710,769 | $732,645 | $681,461 | $683,709 | $690,840 | 0.07% |
| BISHAN | $918,143 | $865,667 | $961,708 | $867,167 | $854,364 | $916,578 | $906,309 | $903,400 | -0.01% |
| JURONG WEST | $598,582 | $587,954 | $592,885 | $609,570 | $595,016 | $593,414 | $590,985 | $593,952 | -0.10% |
| WOODLANDS | $594,898 | $591,561 | $591,170 | $593,899 | $590,866 | $597,600 | $602,542 | $587,612 | -0.17% |
| SEMBAWANG | $598,305 | $612,383 | $596,069 | $596,926 | $623,060 | $632,038 | $600,063 | $587,774 | -0.21% |
| PUNGGOL | $678,763 | $652,359 | $665,803 | $677,795 | $691,465 | $680,640 | $690,438 | $664,822 | -0.26% |
| BUKIT BATOK | $773,194 | $769,684 | $762,698 | $753,645 | $764,467 | $769,538 | $744,218 | $755,028 | -0.33% |
| TOA PAYOH | $913,654 | $834,222 | $906,143 | $975,476 | $886,000 | $901,333 | $906,444 | $873,154 | -0.42% |
| CLEMENTI | $900,750 | $752,667 | $822,667 | $882,538 | $841,555 | $936,000 | $925,800 | $753,194 | -1.86% |
Kallang/Whampoa took the lead for 5-room flats, with averages steadily creeping up to the million-dollar mark. Realtors we spoke to said prices could rise even further, due to the contrast between existing resale flats and the recent 2023 BTO launch (you can see details of this here).
The recent launches in Kallang/Whampoa only had 2, 3, and 4-room flats; and it also consists of some Prime flats, which come with SR and 10-year MOPs. Realtors said that, faced with the lack of 5-room options and such heavy restrictions, buyers may be convinced to purchase 5 existing resale, 5-room flats in the surroundings.
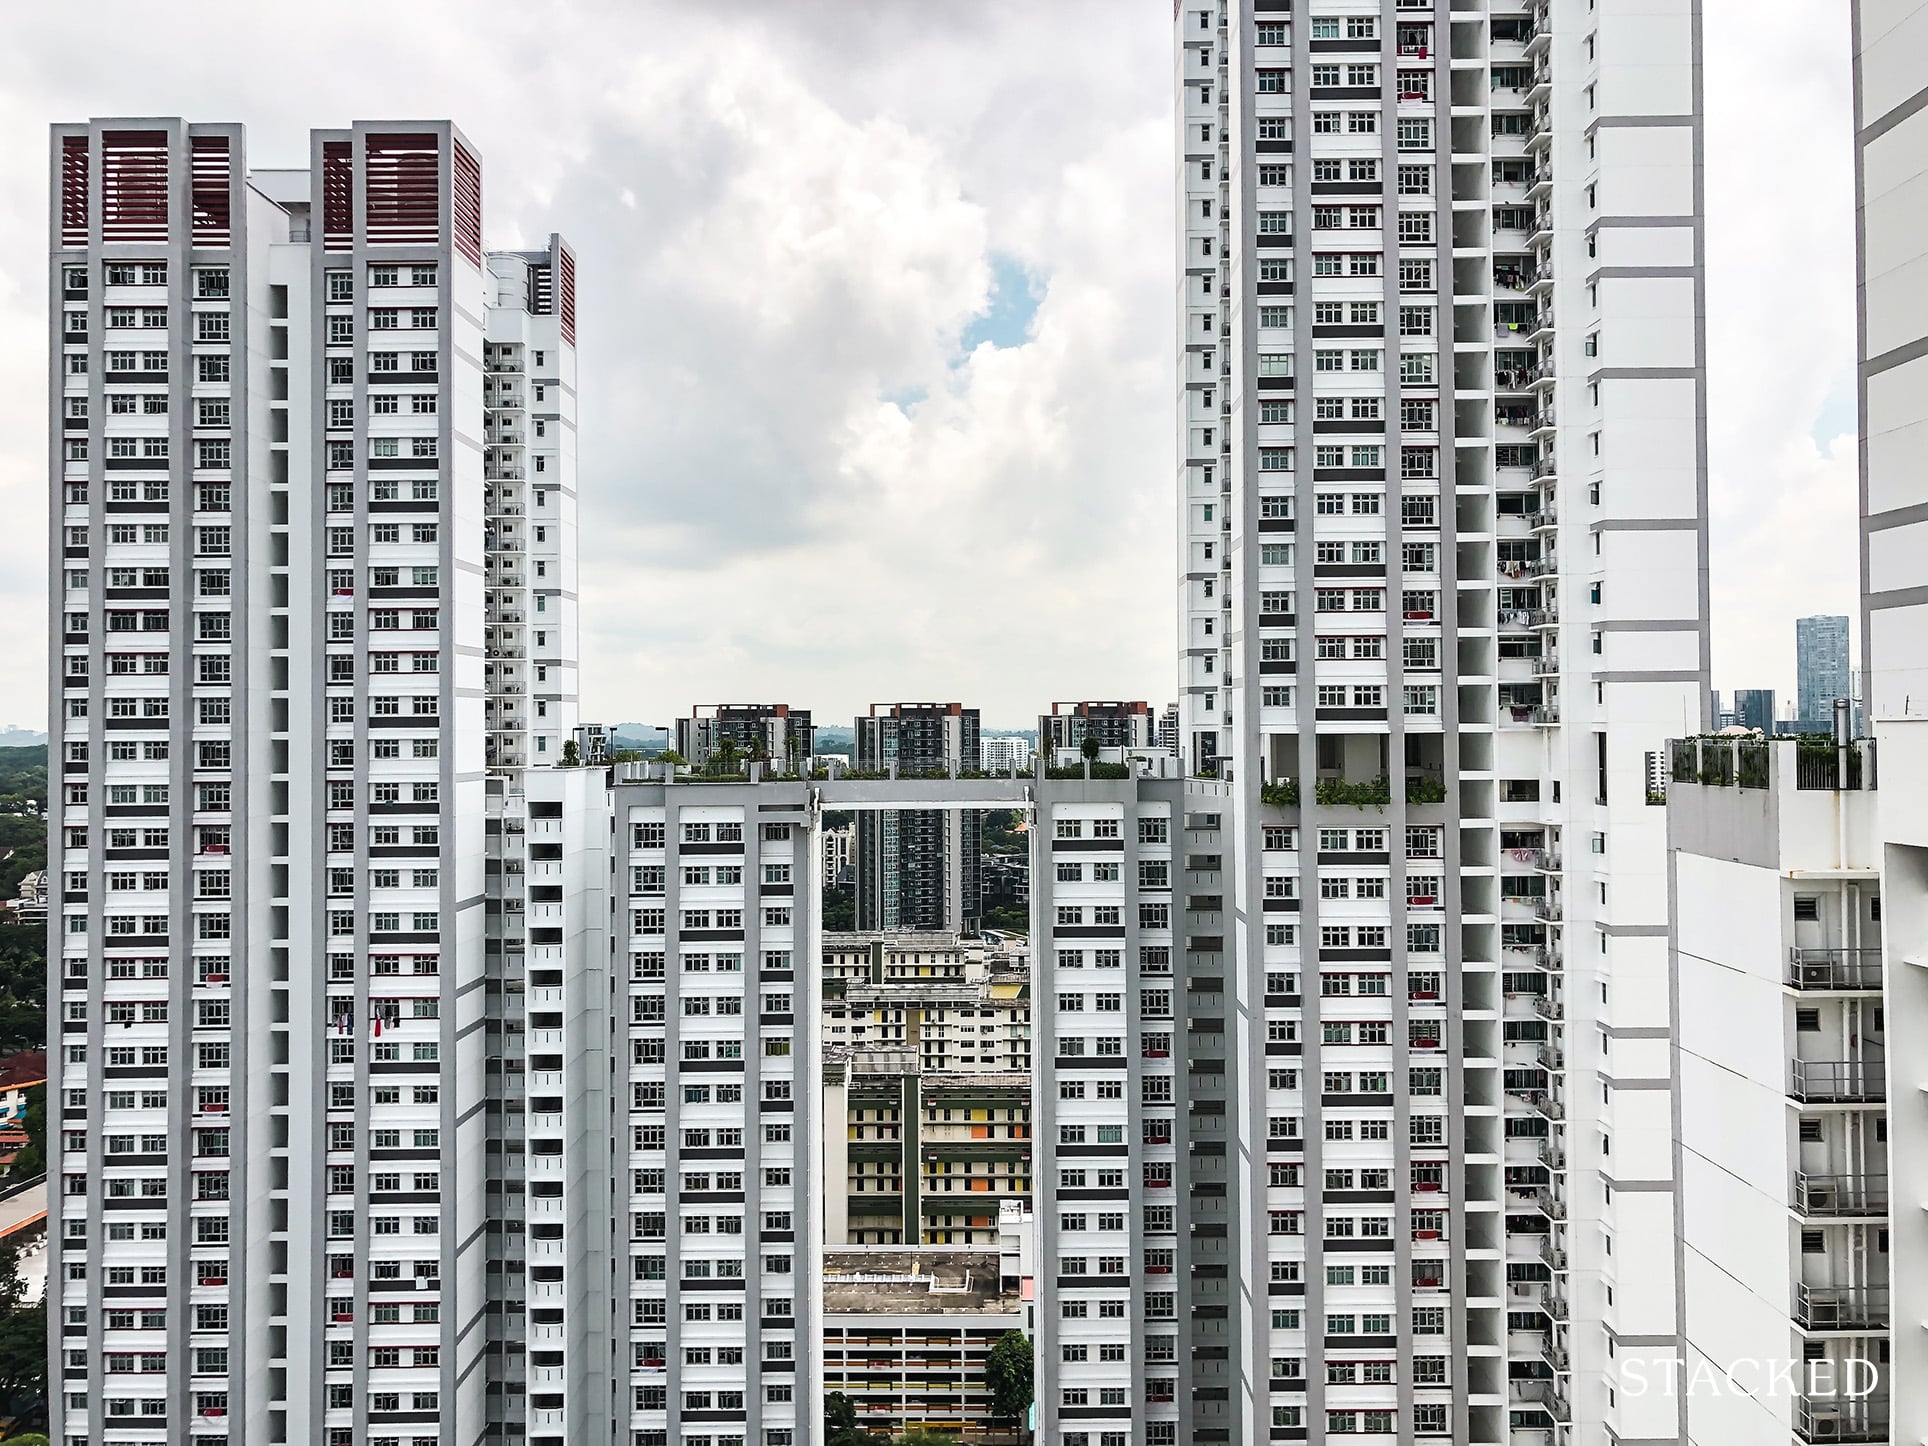
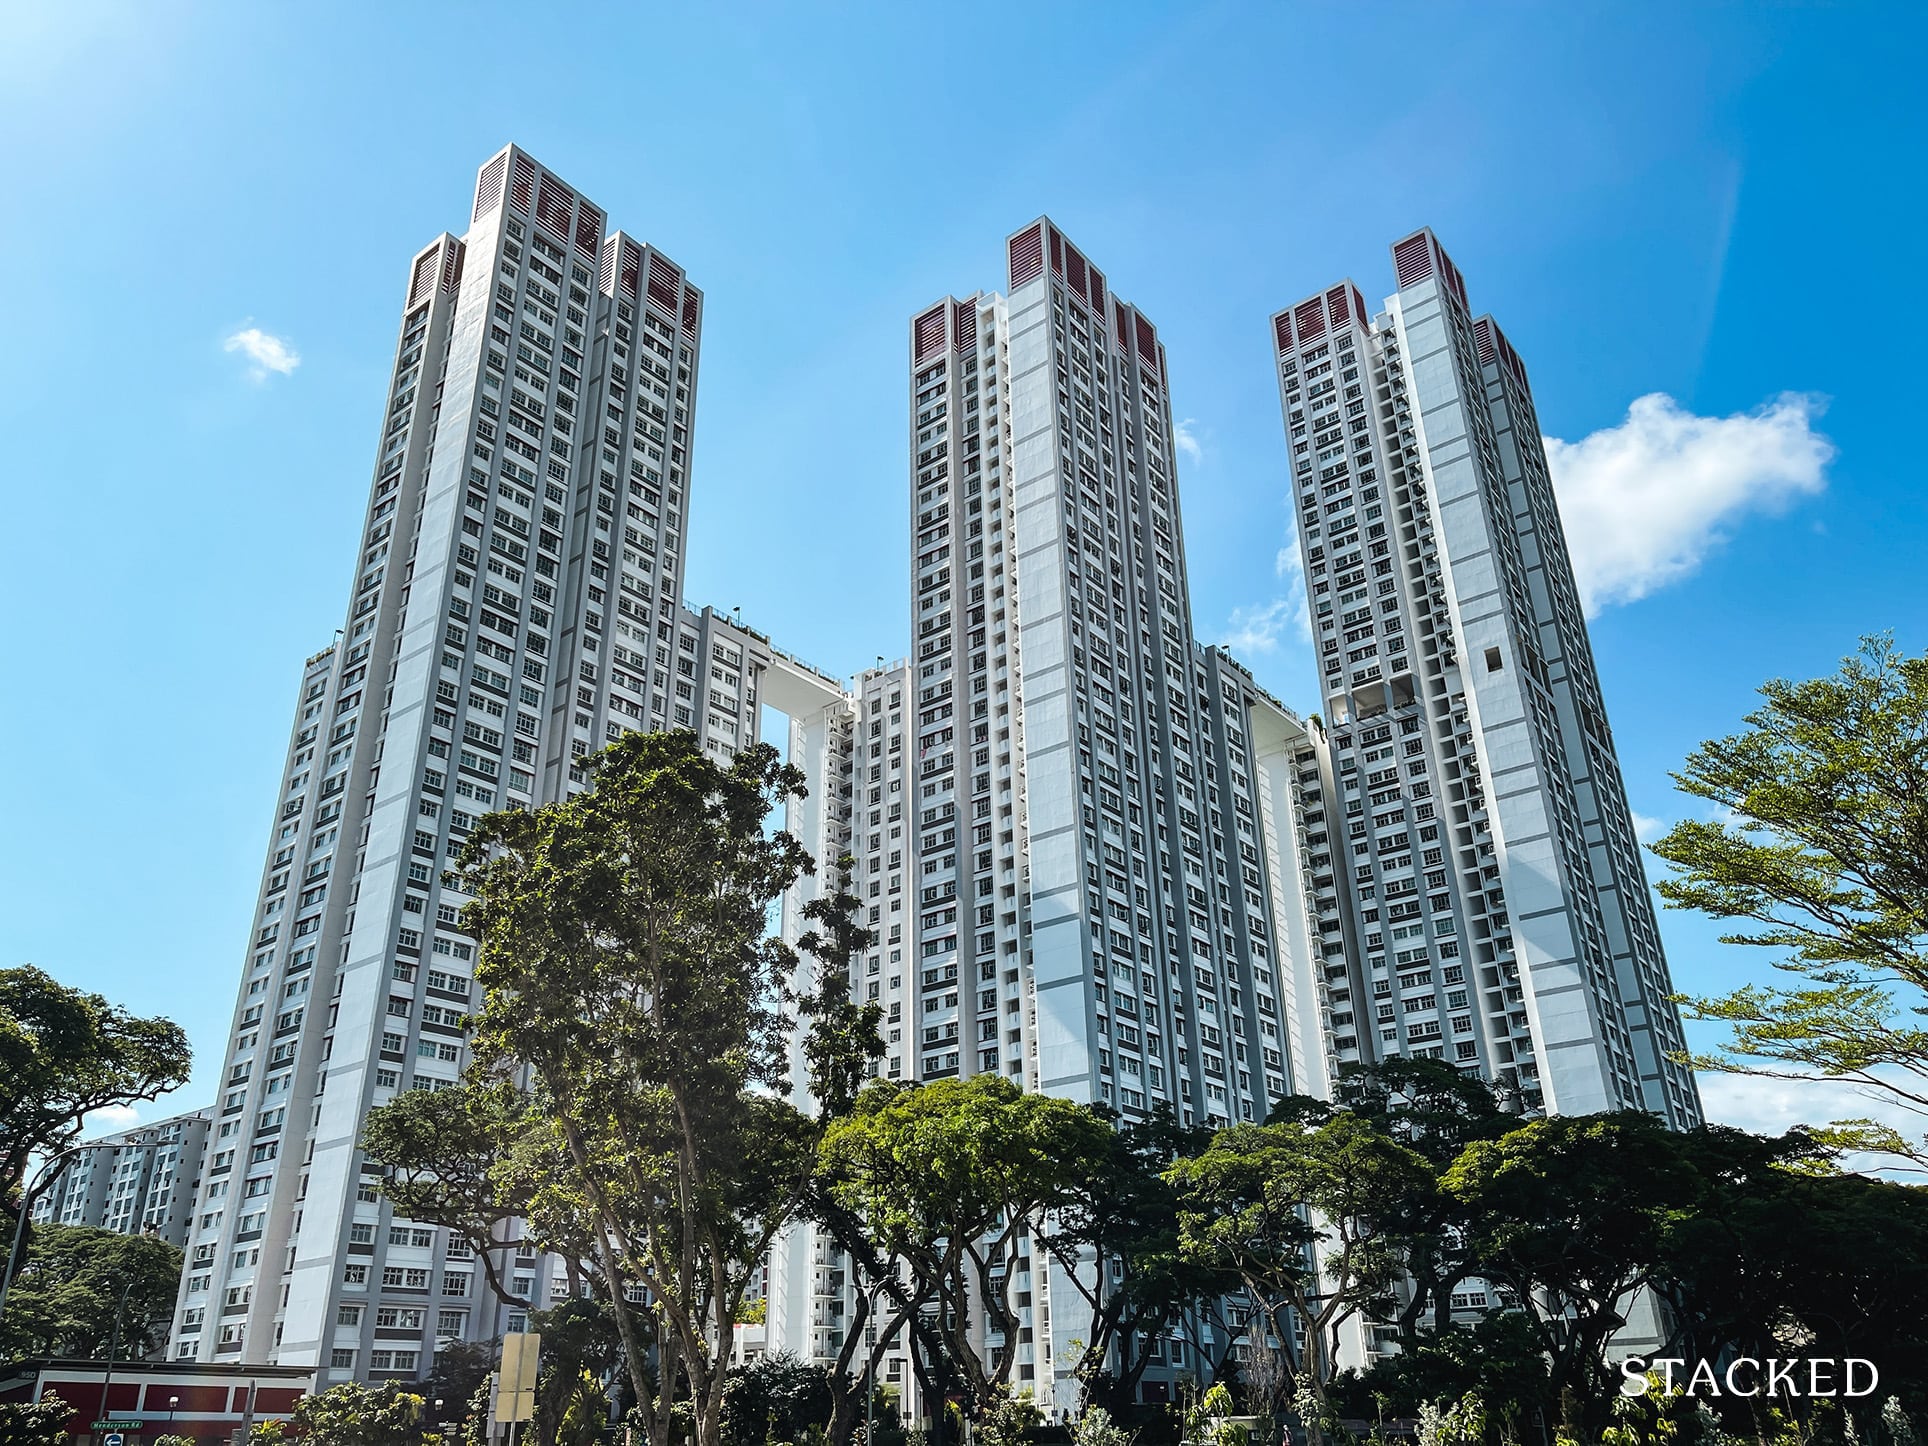
Bukit Merah saw the next highest pick-up in prices, with the average up by 1.66 per cent. Realtors said this was likely due to City Vue @ Henderson, a SERS project that has been a consistent top performer. City Vue is located within eight minutes of the Red Hill MRT station and offers sweeping unblocked views of the greenery and the city. Back in May 2022, a 5-room flat here set record prices at $1.4 million dollars. You can see the full review of this project here.
The third highest pick-up was in Serangoon, with the price average up by 1.25 per cent. This isn’t surprising, as there’s been pent-up demand for flats in the Serangoon area for years. When Serangoon North Vista launched in May, it was oversubscribed 13 times over; and this was one of the first BTO launches we’ve seen in the area for about nine years.
One realtor said her client, who bought a 5-room flat in Serangoon, had done so after a failed ballot. Given the oversubscription rate, and the infrequency of new launches, it seems buyers have resigned themselves to resale despite the cost.
Another realtor commented that, with the latest developments in Serangoon North and Woodleigh, this town is fast becoming a hub to rival Bishan.
For 4-room flats
| ESTATE | 2023-01 | 2023-02 | 2023-03 | 2023-04 | 2023-05 | 2023-06 | 2023-07 | 2023-08 | Average Returns |
| GEYLANG | $548,282 | $578,573 | $631,054 | $632,017 | $670,955 | $677,316 | $678,846 | $665,607 | 2.88% |
| CENTRAL AREA | $946,861 | $789,841 | $884,429 | $1,026,000 | $849,625 | $888,700 | $916,667 | $1,048,444 | 2.33% |
| CLEMENTI | $646,642 | $577,668 | $737,471 | $649,056 | $668,520 | $714,189 | $647,122 | $685,450 | 1.62% |
| BISHAN | $680,563 | $684,914 | $677,238 | $697,493 | $697,941 | $679,526 | $711,926 | $754,294 | 1.52% |
| QUEENSTOWN | $823,768 | $855,427 | $859,500 | $842,259 | $838,508 | $809,278 | $895,409 | $882,917 | 1.09% |
| JURONG EAST | $473,046 | $472,089 | $477,605 | $475,048 | $492,000 | $535,982 | $496,263 | $502,300 | 0.96% |
| BEDOK | $530,855 | $541,883 | $559,174 | $586,894 | $600,046 | $544,532 | $608,682 | $554,351 | 0.87% |
| YISHUN | $476,447 | $495,930 | $485,701 | $490,951 | $499,934 | $495,041 | $500,028 | $500,269 | 0.72% |
| KALLANG/WHAMPOA | $738,027 | $689,485 | $728,642 | $712,122 | $776,966 | $795,993 | $845,304 | $764,169 | 0.71% |
| JURONG WEST | $494,087 | $482,145 | $488,519 | $486,628 | $484,494 | $496,711 | $503,567 | $518,660 | 0.71% |
| TAMPINES | $560,718 | $553,381 | $581,856 | $565,605 | $573,932 | $570,658 | $563,541 | $586,564 | 0.68% |
| PUNGGOL | $581,327 | $577,477 | $581,044 | $586,843 | $594,642 | $598,962 | $591,286 | $609,236 | 0.68% |
| PASIR RIS | $540,273 | $562,717 | $547,450 | $558,034 | $560,500 | $543,495 | $590,056 | $561,000 | 0.63% |
| SEMBAWANG | $529,590 | $536,171 | $532,005 | $545,733 | $539,646 | $550,510 | $551,097 | $551,646 | 0.59% |
| SENGKANG | $557,218 | $548,694 | $573,612 | $570,479 | $569,341 | $557,771 | $556,290 | $575,397 | 0.49% |
| BUKIT MERAH | $814,112 | $728,917 | $777,576 | $780,164 | $790,077 | $822,483 | $871,956 | $827,917 | 0.41% |
| SERANGOON | $575,941 | $638,429 | $602,667 | $613,931 | $564,042 | $601,698 | $606,813 | $584,462 | 0.40% |
| CHOA CHU KANG | $499,757 | $498,762 | $485,475 | $490,456 | $507,217 | $495,501 | $498,291 | $511,350 | 0.35% |
| WOODLANDS | $493,154 | $483,412 | $492,740 | $486,956 | $477,120 | $501,120 | $497,784 | $504,171 | 0.34% |
| HOUGANG | $532,403 | $520,016 | $539,307 | $530,291 | $531,225 | $533,533 | $545,249 | $544,553 | 0.34% |
| MARINE PARADE | $534,000 | $635,000 | $570,000 | $592,500 | $549,500 | $560,000 | $560,000 | $513,500 | -0.15% |
| BUKIT PANJANG | $515,832 | $499,694 | $510,059 | $508,778 | $519,351 | $517,176 | $522,438 | $509,779 | -0.15% |
| BUKIT BATOK | $591,632 | $589,693 | $593,359 | $579,073 | $583,568 | $597,169 | $606,093 | $582,332 | -0.20% |
| ANG MO KIO | $696,370 | $612,620 | $665,562 | $600,060 | $634,607 | $641,146 | $572,567 | $653,738 | -0.42% |
| TOA PAYOH | $730,841 | $773,702 | $715,391 | $681,113 | $732,189 | $800,060 | $748,511 | $682,905 | -0.70% |
It’s interesting to see that Geylang beat Central area flats by a nose, although half a percentage point isn’t much difference.
Realtors said most of the interest in Geylang is still focused on Geylang East. This area is reaping the benefit of Paya Lebar Quarter (PLQ), which has been transformed into a major commercial hub. HDB flats here are also in a heavily built-up area (perhaps too built-up in the opinions of some.)
However, realtors also opined that an overall average may not reflect Geylang’s situation too well. One realtor noted that gains could be disproportionate, as areas like Kampong Ubi and MacPherson tend to see less dramatic gains.
The other top gainers are no surprise – Central Area flats, Clementi, and Bishan are usually at the top in most years. The big gap between Central Area flats and the others may be down to a familiar name: Pinnacle @ Duxton. We saw a new record here in April this year, with a 4-room flat managing to set a record of $1.4 million.
For 3-room flats
| ESTATE | 2023-01 | 2023-02 | 2023-03 | 2023-04 | 2023-05 | 2023-06 | 2023-07 | 2023-08 | Average Returns |
| BISHAN | $405,500 | $402,500 | $463,333 | $496,667 | $397,981 | $345,000 | $488,000 | $520,000 | 5.20% |
| CENTRAL AREA | $414,800 | $483,111 | $462,600 | $440,760 | $379,000 | $451,500 | $484,538 | $450,000 | 1.83% |
| QUEENSTOWN | $456,207 | $406,200 | $436,129 | $429,549 | $454,843 | $424,100 | $406,520 | $493,654 | 1.62% |
| BUKIT PANJANG | $384,100 | $393,091 | $390,667 | $389,611 | $403,761 | $412,667 | $397,467 | $418,967 | 1.29% |
| SERANGOON | $389,593 | $391,667 | $405,761 | $379,625 | $382,736 | $384,800 | $419,389 | $416,274 | 1.04% |
| BUKIT BATOK | $378,012 | $387,863 | $406,769 | $407,422 | $408,541 | $410,659 | $417,637 | $404,507 | 1.00% |
| GEYLANG | $389,671 | $375,936 | $358,636 | $348,129 | $409,924 | $356,083 | $363,162 | $402,745 | 0.92% |
| SENGKANG | $445,171 | $448,778 | $425,555 | $452,999 | $456,366 | $451,500 | $466,905 | $460,761 | 0.55% |
| ANG MO KIO | $383,903 | $411,619 | $405,506 | $406,272 | $394,679 | $398,641 | $414,488 | $396,928 | 0.54% |
| JURONG EAST | $368,587 | $375,431 | $377,875 | $351,250 | $365,625 | $368,833 | $386,337 | $377,875 | 0.43% |
| CLEMENTI | $447,786 | $440,928 | $436,051 | $459,187 | $441,485 | $472,243 | $431,885 | $456,056 | 0.40% |
| PUNGGOL | $453,394 | $451,909 | $451,635 | $448,332 | $453,129 | $453,289 | $462,991 | $466,037 | 0.40% |
| SEMBAWANG | $441,143 | $430,667 | $431,250 | $440,000 | $424,778 | $437,876 | $437,286 | $450,241 | 0.32% |
| YISHUN | $385,201 | $381,544 | $383,107 | $392,272 | $386,044 | $385,319 | $392,517 | $390,190 | 0.19% |
| WOODLANDS | $377,229 | $383,320 | $397,481 | $382,305 | $373,488 | $363,731 | $370,263 | $380,514 | 0.16% |
| JURONG WEST | $353,566 | $328,478 | $342,200 | $356,040 | $371,722 | $340,404 | $363,956 | $353,371 | 0.16% |
| TAMPINES | $424,740 | $414,869 | $420,698 | $430,463 | $432,480 | $434,065 | $426,106 | $427,902 | 0.12% |
| HOUGANG | $398,774 | $388,213 | $394,338 | $387,918 | $381,518 | $404,278 | $401,717 | $398,581 | 0.03% |
| KALLANG/WHAMPOA | $434,385 | $421,995 | $444,762 | $414,258 | $412,707 | $417,617 | $413,357 | $430,164 | -0.06% |
| BEDOK | $379,324 | $385,651 | $380,811 | $368,948 | $370,867 | $379,763 | $372,428 | $376,576 | -0.09% |
| BUKIT MERAH | $492,747 | $465,407 | $511,000 | $463,161 | $526,757 | $519,578 | $544,776 | $464,315 | -0.38% |
| TOA PAYOH | $409,555 | $401,085 | $398,651 | $402,366 | $406,485 | $429,965 | $384,763 | $389,693 | -0.60% |
| MARINE PARADE | $466,889 | $450,486 | $438,972 | $429,778 | $464,065 | $428,981 | $447,750 | $440,800 | -0.70% |
| CHOA CHU KANG | $416,857 | $409,000 | $394,833 | $390,178 | $400,167 | $372,000 | $399,189 | $373,000 | -1.47% |
Bishan, famed for DBSS projects like Natura Loft, topped the charts with an incredible 5.2 per cent rise. This is way ahead of even Central Area flats, and is something of a milestone – with averages reaching $520,000, it’s more plausible for some sellers to go from a 3-room flat to a condo.
Interestingly, most realtors felt this is a temporary quirk, and not likely to last. One realtor noted that 1,500 new flats will be built near Bishan MRT by 2025. In addition, more new flats are being built in the Sin Ming area. If you couple this with the age of many Bishan flats (they can date back to the ‘70s and ‘80s), this is likely to cool prices in the long term.
Queenstown and Central Area flats also saw high gains, but these are the usual names on the list. One realtor explained it as follows:
“The flats in the mature areas are still seeing prices go up despite their age, because they are still considered a better deal than the Prime and Plus housing. Do you want to have a 10-year MOP, when you can get a resale flat without this restriction in a place like Toa Payoh or Queenstown? So far buyers have decided it’s worth the premium, rather than the longer MOP or trusting the luck of the ballot.”
Despite continued news of million-dollar flats, they’re still far from being a norm
None of the towns see an actual average of $1 million or more, even the highly desirable Central Area, Bishan, Queenstown, etc. flats. While the number of million-dollar flats has definitely reached new highs, we don’t seem to have reached the point where they’re reflective of the wider HDB market. So despite continuous news of new estates hitting the $1 million mark (like the recent executive apartment in Bukit Panjang), again, these are the highest prices achieved and not the average of the area.
What will be interesting, over the next few years, is to see the effect of Prime and Plus flats. So far, opinion is divided on whether these new flat types can siphon demand from the resale market.
For more news and updates, follow us on Stacked. We’ll update you as the situation progresses. You can also find in-depth reviews of new and resale projects – and some HDB developments too – in the Singapore market.
At Stacked, we like to look beyond the headlines and surface-level numbers, and focus on how things play out in the real world.
If you’d like to discuss how this applies to your own circumstances, you can reach out for a one-to-one consultation here.
And if you simply have a question or want to share a thought, feel free to write to us at stories@stackedhomes.com — we read every message.

0 Comments