Should We Keep Our 4-Room Queenstown BTO Or Give It Up For A Resale HDB/Condo?
December 6, 2024
Hello Stackedhomes,
I have been a huge fan of your page since 2020, especially reading the stories of couples from all walks of life and seeing you curate solutions that best fit their needs. The time has come for my fiancee and I to have our own conundrum, and we wish to seek your advice as well. Can I check is the advice chargeable?
My fiancee and I have purchased the option for a 4-room BTO at Queenstown. However, our main gripe is that the BTO would only be completed in 2028, and we’re getting married next year and would have to rent for 4 years. Hence we are considering giving up the BTO and looking at other options.
1. Buy a 5 bedroom resale. But we’re concerned also about the lease decay hence would prefer >= 90-year developments. In addition, we would like a place that’s located not too far from town (ideally <40mins from Dhoby Ghaut MRT)
2. Buy a 3br new launch condo/resale condo
3. Buy a 3br condo with 99-1 and decouple in future to purchase another 2br condo for investment/rental (seems unfeasible financially)
4. Original BTO option. Rent $3k a month for 4 years, stay BTO for 5 years, and purchase a new condo under my fiancee’s name and rent out our BTO.
Could you advise which option would be the wisest financially? We’re looking at a 10-15 time year horizon.
Any help would be greatly appreciated!
Thank you very much in advance!
Disclaimer: Some personal and financial information were removed for privacy reasons
Hello,
Thanks for writing in and we appreciate your support.
Deciding whether to forfeit your BTO flat is undoubtedly a challenging decision, especially given the consistently high demand and limited supply – particularly for units in central locations. Securing a BTO flat often feels like a game of luck, and not everyone comes out ahead. Your dilemma is understandable, as forfeiting the flat feels like you are giving up a coveted opportunity but holding on would mean incurring substantial rental costs.
We will start by assessing your affordability before we explore the various pathways that you’re considering in more detail.
Affordability
For the purchase of an HDB
| Maximum loan based on ages of 30 and 28 with a combined monthly income of $16K, at a 4.8% interest | $837,701 (25-year tenure) |
| CPF + cash | $1,000,000 |
| Total loan + CPF + cash | $1,837,701 |
| BSD based on $1,837,701 | $61,485 |
| Estimated affordability | $1,776,216 |
For the purchase of a private property
| Maximum loan based on ages of 30 and 28 with a combined monthly income of $16K, at a 4.8% interest | $1,677,260 (30-year tenure) |
| CPF + cash | $1,000,000 |
| Total loan + CPF + cash | $2,677,260 |
| BSD based on $2,677,260 | $103,463 |
| Estimated affordability | $2,573,797 |
Based on your affordability, the options you are considering are all feasible.
Now let’s take a look at the performance of the various property types you’re looking at.
Performance of resale 5-room HDBs
| Year | <1980 | 1980-1990 | 1991-2000 | 2001-2010 | 2011-2020 |
| 2013 | $666,696 | $571,371 | $544,141 | $573,451 | $862,500 |
| 2014 | $665,208 | $547,093 | $514,542 | $525,165 | $880,667 |
| 2015 | $625,696 | $539,496 | $494,915 | $482,707 | $927,326 |
| 2016 | $633,256 | $548,537 | $494,137 | $482,000 | $836,368 |
| 2017 | $630,114 | $552,698 | $500,729 | $478,845 | $765,656 |
| 2018 | $613,583 | $532,676 | $501,746 | $473,275 | $745,050 |
| 2019 | $580,913 | $528,019 | $490,354 | $488,205 | $644,979 |
| 2020 | $557,345 | $530,707 | $501,486 | $498,328 | $630,492 |
| 2021 | $629,762 | $592,566 | $565,810 | $548,677 | $689,425 |
| 2022 | $676,334 | $643,078 | $624,433 | $596,549 | $739,897 |
| 2023 | $703,938 | $676,249 | $654,779 | $621,063 | $773,044 |
| Average | 0.70% | 1.81% | 2.02% | 0.97% | -0.81% |
The data shows that flats built between 2011 and 2020 experienced the lowest growth rates over the last ten years, which is somewhat surprising given that they are among the newest flats on the market. In contrast, flats built before 1980 (some of the oldest available) had the second-lowest growth rate. When examining the year-on-year growth rates, 5-room flats built between 1980 and 2000 showed a much steadier appreciation over time, whereas the other flats experienced most of their growth during and post pandemic.
One possible explanation for this trend could be the increased demand for larger living spaces, especially during and after the pandemic, which boosted interest in older flats. These units typically offer more spacious layouts, a feature that became highly desirable as remote work and home-centred lifestyles gained popularity. In contrast, newer flats are often more compact and optimised for efficiency instead.
Moreover, flats built between 2011 and 2020 generally entered the market at relatively high initial prices, reflecting the increased costs of land and construction. This high starting valuation may constrain their potential for further appreciation, as there is less room for price growth compared to older flats, which were originally sold at lower prices.
This data suggests that older flats don’t necessarily experience greater depreciation than newer ones, at least as of this current moment, as supply is still constrained. Beyond age, other factors play a significant role in a property’s value, including location, supply and demand, and even down to details like the unit’s layout.
Performance of non-landed private properties
To compare the growth rates of new launches against resale properties, we’ll examine the performance of new launch properties completed in 2013 and compare them to properties completed between 2002 and 2012. This approach helps to assess the potential gains of purchasing a new launch property versus a resale property over a similar period.
Since many of the new launches completed in 2013 only came on the resale market in 2015 due to the Seller’s Stamp Duty (SSD) holding period, our analysis will focus on resale transactions from 2015 onward. To account for regional variations in property trends, let’s analyse each district individually. Additionally, some districts lack condominiums completed in 2013, so they have been omitted from this comparison.
Core Central Region (CCR)
| Year | D1 condos completed in 2013 | D1 condos completed between 2002 – 2012 | D2 condos completed in 2013 | D2 condos completed between 2002 – 2012 | D9 condos completed in 2013 | D9 condos completed between 2002 – 2012 | D10 condos completed in 2013 | D10 condos completed between 2002 – 2012 | D11 condos completed in 2013 | D11 condos completed between 2002 – 2012 |
| 2015 | $2,465 | $2,013 | $2,162 | $1,673 | $2,318 | $1,984 | $2,315 | $1,744 | $1,647 | $1,539 |
| 2016 | $2,108 | $1,956 | $1,786 | $1,675 | $2,316 | $1,969 | $2,324 | $1,709 | $1,665 | $1,566 |
| 2017 | $1,889 | $1,916 | $1,894 | $1,633 | $2,337 | $2,011 | $1,996 | $1,695 | $1,708 | $1,585 |
| 2018 | $2,059 | $1,977 | $2,033 | $1,748 | $2,474 | $2,164 | $2,134 | $1,851 | $1,816 | $1,690 |
| 2019 | $1,897 | $1,933 | $1,918 | $1,656 | $2,377 | $2,123 | $2,528 | $1,845 | $1,819 | $1,674 |
| 2020 | $1,921 | $1,804 | $2,020 | $1,606 | $2,281 | $2,099 | $2,005 | $1,798 | $1,793 | $1,638 |
| 2021 | $1,912 | $1,958 | $2,063 | $1,725 | $2,486 | $2,231 | $2,158 | $1,943 | $1,931 | $1,731 |
| 2022 | $1,909 | $1,944 | $2,129 | $1,738 | $2,547 | $2,261 | $2,164 | $2,127 | $1,953 | $1,842 |
| 2023 | $1,918 | $1,994 | $2,261 | $1,836 | $2,627 | $2,249 | $2,417 | $2,239 | $2,077 | $1,987 |
| Average | -2.83% | -0.02% | 0.90% | 1.27% | 1.66% | 1.63% | 1.32% | 3.29% | 2.99% | 3.31% |
Rest of Central Region (RCR)
| Year | D3 condos completed in 2013 | D3 condos completed between 2002 – 2012 | D4 condos completed in 2013 | D4 condos completed between 2002 – 2012 | D5 condos completed in 2013 | D1 condos completed between 2002 – 2012 | D8 condos completed in 2013 | D8 condos completed between 2002 – 2012 |
| 2015 | $1,469 | $1,384 | $1,225 | $1,547 | $1,188 | $1,163 | $1,426 | $1,347 |
| 2016 | $1,444 | $1,384 | $1,083 | $1,497 | $1,313 | $1,150 | $1,365 | $1,355 |
| 2017 | $1,431 | $1,371 | $1,013 | $1,567 | $1,216 | $1,157 | $1,412 | $1,312 |
| 2018 | $1,458 | $1,403 | $1,179 | $1,601 | $1,327 | $1,218 | $1,403 | $1,413 |
| 2019 | $1,513 | $1,452 | $1,260 | $1,555 | $1,264 | $1,215 | $1,248 | $1,397 |
| 2020 | $1,471 | $1,479 | $1,263 | $1,512 | $1,337 | $1,222 | $1,224 | $1,369 |
| 2021 | $1,509 | $1,489 | $1,365 | $1,592 | $1,415 | $1,314 | $1,397 | $1,475 |
| 2022 | $1,692 | $1,651 | $1,788 | $1,711 | $1,576 | $1,409 | $1,483 | $1,538 |
| 2023 | $1,767 | $1,766 | $1,928 | $1,789 | $1,644 | $1,511 | $1,527 | $1,682 |
| Average | 2.42% | 3.16% | 6.55% | 1.92% | 4.35% | 3.38% | 1.10% | 2.91% |
| Year | D12 condos completed in 2013 | D12 condos completed between 2002 – 2012 | D13 condos completed in 2013 | D13 condos completed between 2002 – 2012 | D14 condos completed in 2013 | D14 condos completed between 2002 – 2012 | D15 condos completed in 2013 | D15 condos completed between 2002 – 2012 |
| 2015 | $1,460 | $1,220 | $1,627 | $1,195 | $1,416 | $1,119 | $1,389 | $1,261 |
| 2016 | $1,492 | $1,219 | $1,588 | $1,181 | $1,363 | $1,055 | $1,413 | $1,212 |
| 2017 | $1,411 | $1,203 | $1,573 | $1,187 | $1,426 | $1,074 | $1,362 | $1,254 |
| 2018 | $1,451 | $1,273 | $1,621 | $1,272 | $1,429 | $1,205 | $1,395 | $1,319 |
| 2019 | $1,492 | $1,248 | $1,067 | $1,275 | $1,468 | $1,164 | $1,474 | $1,320 |
| 2020 | $1,464 | $1,296 | $1,512 | $1,330 | $1,437 | $1,093 | $1,454 | $1,313 |
| 2021 | $1,475 | $1,383 | $1,529 | $1,367 | $1,520 | $1,204 | $1,457 | $1,434 |
| 2022 | $1,697 | $1,472 | $1,731 | $1,485 | $1,597 | $1,297 | $1,560 | $1,541 |
| 2023 | $1,888 | $1,576 | $1,818 | $1,609 | $1,683 | $1,501 | $1,701 | $1,705 |
| Average | 3.45% | 3.31% | 3.32% | 3.85% | 2.24% | 4.05% | 2.65% | 3.95% |
Outside Central Region (OCR)
| Year | D18 condos completed in 2013 | D18 condos completed between 2002 – 2012 | D19 condos completed in 2013 | D19 condos completed between 2002 – 2012 | D21 condos completed in 2013 | D21 condos completed between 2002 – 2012 | D23 condos completed in 2013 | D23 condos completed between 2002 – 2012 | D27 condos completed in 2013 | D27 condos completed between 2002 – 2012 |
| 2015 | $1,036 | $846 | $1,181 | $965 | $1,381 | $1,274 | $1,006 | $885 | $996 | $744 |
| 2016 | $991 | $836 | $1,128 | $943 | $1,350 | $1,255 | $1,010 | $867 | $929 | $699 |
| 2017 | $891 | $813 | $1,130 | $958 | $1,256 | $1,295 | $998 | $865 | $908 | $706 |
| 2018 | $934 | $827 | $1,083 | $999 | $1,265 | $1,411 | $1,039 | $927 | $916 | $738 |
| 2019 | $942 | $844 | $1,103 | $993 | $1,397 | $1,455 | $1,073 | $927 | $907 | $698 |
| 2020 | $890 | $832 | $1,090 | $1,003 | $1,498 | $1,451 | $1,074 | $941 | $948 | $737 |
| 2021 | $962 | $880 | $1,165 | $1,080 | $1,613 | $1,503 | $1,158 | $990 | $980 | $828 |
| 2022 | $1,079 | $1,005 | $1,328 | $1,214 | $1,721 | $1,696 | $1,254 | $1,082 | $1,060 | $863 |
| 2023 | $1,236 | $1,102 | $1,445 | $1,287 | $1,822 | $1,808 | $1,458 | $1,150 | $1,163 | $948 |
| Average | 2.56% | 3.49% | 2.74% | 3.75% | 3.68% | 4.56% | 4.88% | 3.40% | 2.08% | 3.26% |
The data shows varying performance between new launches and resale properties across different districts, though resale properties generally exhibit a higher growth rate in most districts. This trend may be due to the fact that new launches were initially priced higher, leaving more room for resale properties in the area to catch up over time.
Since each condominium project has unique characteristics, such as tenure, unit mix, number of units, and layout design, it’s challenging to definitively say whether a new launch or a resale property is the better choice. Ultimately, the decision depends on the specific attributes of each project.
Performance of BTOs
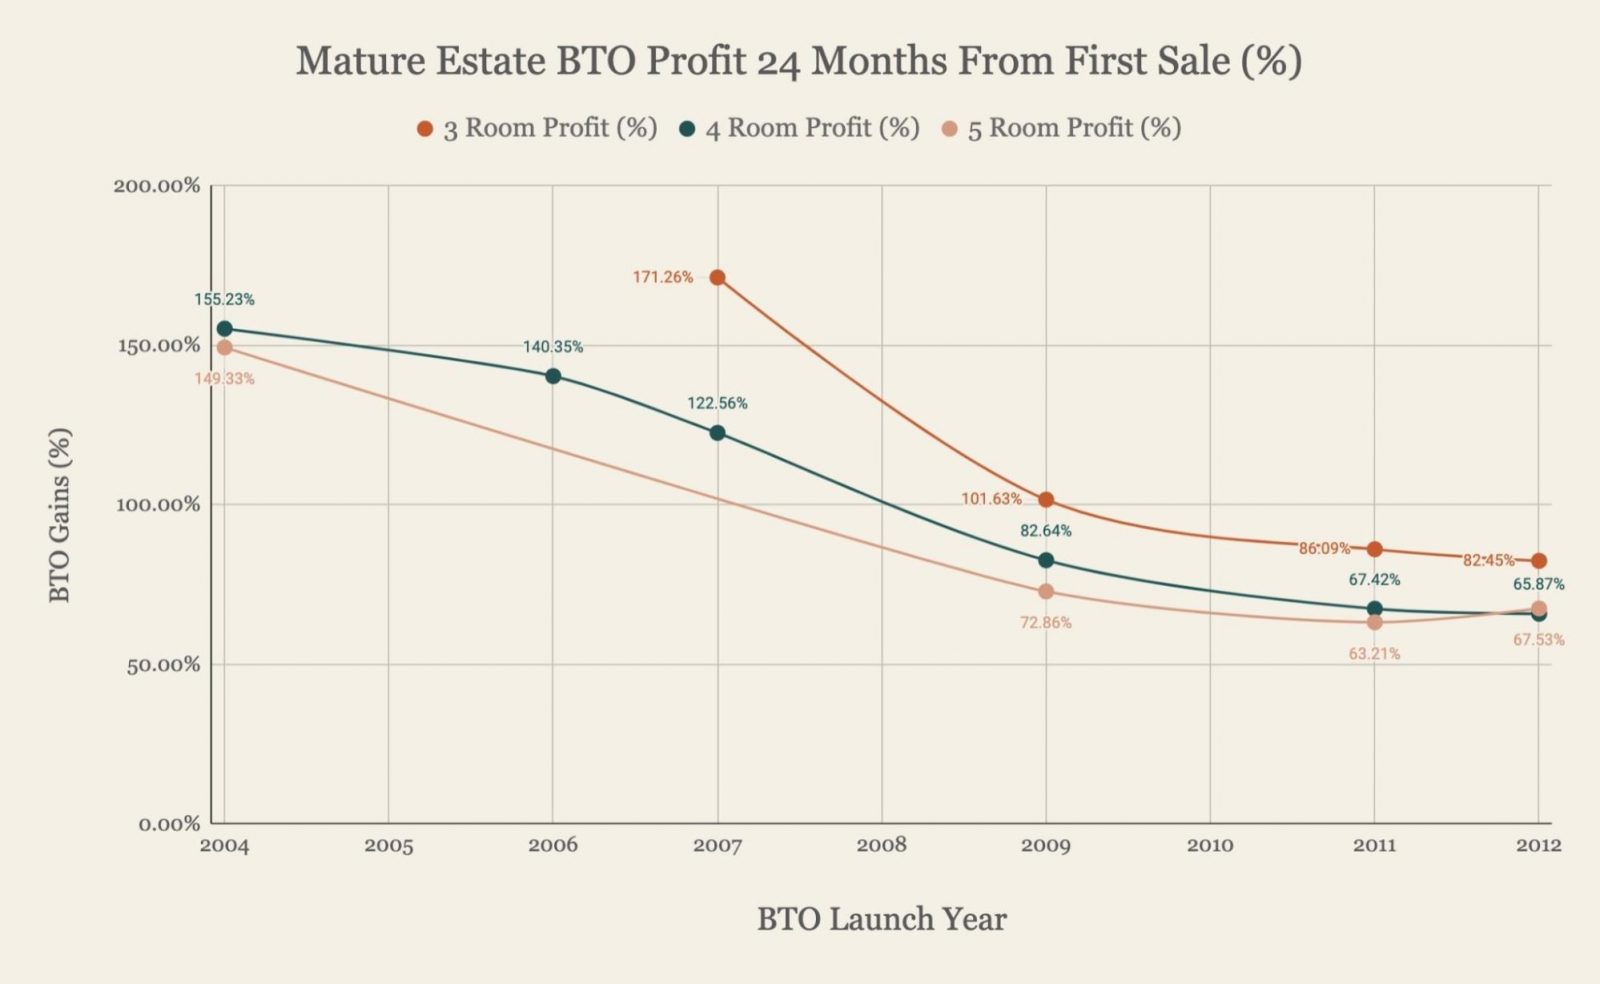
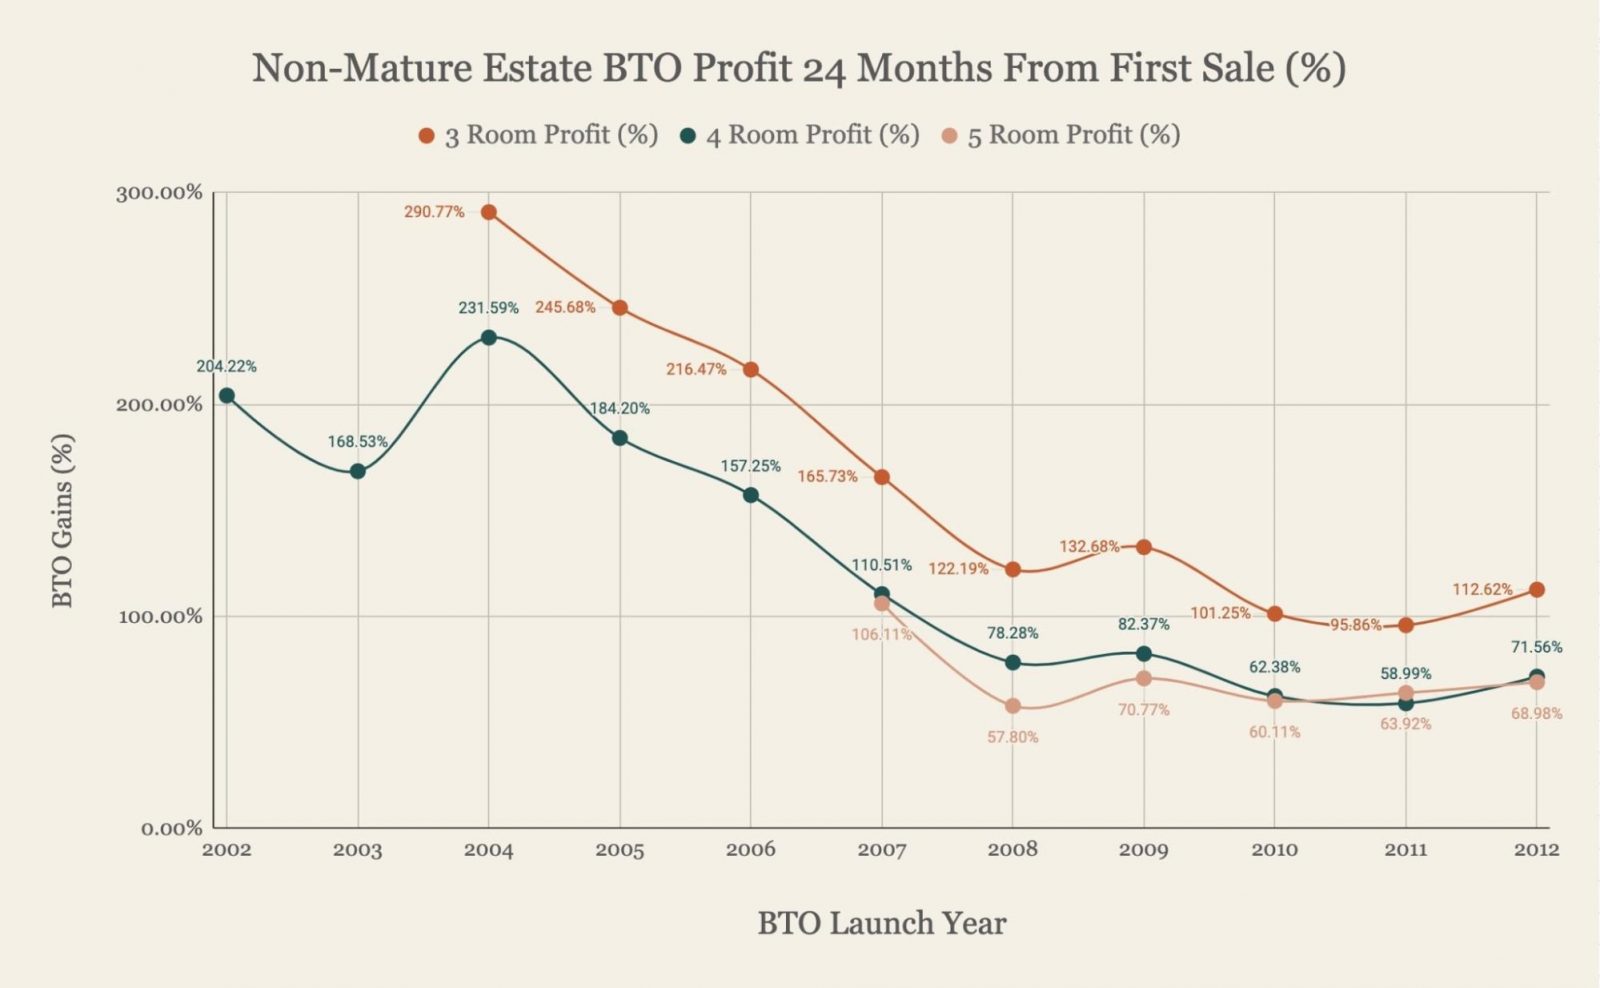
We previously wrote an article exploring the profitability of BTOs, which you can read here. Over the years, rising land and construction costs have led to higher BTO prices and lower profits. However, the data shows that BTO flats still yield profits of at least 50%, which remains a significant return.
On the topic of BTOs, we’re assuming that the unit you secured is from the June 2024 launch, prior to the introduction of the Prime, Plus, and Standard categories. However, if it’s Holland Vista in Queenstown, it falls under the Prime Location Public Housing (PLH) model. This means it comes with a 10-year Minimum Occupation Period (MOP), restricting your spouse from purchasing a second property until the MOP is fulfilled. Additionally, upon resale, a subsidy recovery fee of 9% of the resale price or valuation (whichever is higher) will apply.
Now let’s take a look at the potential costs for the various options.
Costs of potential pathways
Buy a 5-room resale flat
Centrally located 5-room flats with at least 90 years remaining on their lease are currently transacting at prices ranging from $1M to $1.5M. One advantage of this option is the limited supply of newer 5-room flats in the central region, as HDB has not included them in centrally located BTO launches since 2017. This scarcity could help maintain their value over time.
For calculation purposes, let’s assume you purchase a unit at the median price of $1.25M and hold it for 15 years. You’ll also need to rent a place at the start to stay as the completion and renovations would take time. Factoring in the potential that the seller applies for an extension, we can conservatively look at 12 months of rental during this time. However, if there’s no submission delay, then it could be as quick as 3 to 4 months to get the keys.
While you have substantial CPF and cash reserves that don’t need to be fully allocated to this purchase (leaving room for other investments) we’ll assume for this calculation that the full amount is used.
| Purchase price | $1,250,000 |
| BSD | $34,600 |
| CPF + cash | $1,000,000 |
| Loan required | $284,600 |
| BSD | $34,600 |
| Interest expense (Assuming 25-year tenure at 4% interest) | $134,175 |
| Property tax | $19,950 |
| Town council service & conservancy fees (Assuming $90/month) | $16,200 |
| Rental expense (Assuming $3K/month) | $36,000 |
| Total cost | $240,925 |
Buy a 3-bedroom new launch condo
Similar to purchasing a BTO, buying a new launch property means you’ll need to rent a place while waiting for the property to be completed. Based on the current market, a centrally located 3-bedroom unit will likely require you to stretch your maximum budget.
For calculation purposes, let’s assume you purchase a property for $2.5M, rent for 3.5 years during the construction phase, and reside in the property for 11.5 years.
| Purchase price | $2,500,000 |
| BSD | $94,600 |
| CPF + cash | $1,000,000 |
| Loan required | $1,594,600 |
Progressive payment plan
| Stage | % of purchase price | Disbursement amount | Monthly estimated interest | Monthly estimated principal | Monthly estimated repayment | Duration | Total interest cost |
| Completion of foundation | 5% | $0 | $0 | $0 | $0 | 6-9 months (from launch) | $0 |
| Completion of reinforced concrete | 10% | $94,600 | $315 | $136 | $451 | 6-9 months | $1,224 |
| Completion of brick wall | 5% | $219,600 | $732 | $316 | $1,048 | 3-6 months | $4,392 |
| Completion of ceiling/roofing | 5% | $344,600 | $1,149 | $497 | $1,646 | 3-6 months | $6,894 |
| Completion of electrical wiring/plumbing | 5% | $469,600 | $1,565 | $677 | $2,242 | 3-6 months | $9,390 |
| Completion of roads/car parks/drainage | 5% | $594,600 | $1,982 | $857 | $2,839 | 3-6 months | $11,892 |
| Issuance of TOP | 25% | $1,219,600 | $4,065 | $1,757 | $5,822 | Usually a year before CSC | $24,390 |
| Certificate of Statutory Completion (CSC) | 15% | $1,594,600 | $5,315 | $2,298 | $7,613 | Monthly repayment until property is sold | $669,690 |
| BSD | $94,600 |
| Interest expense (Assuming 30-year tenure at 4% interest) | $727,872 |
| Property tax | $69,920 |
| Maintenance fees (Assuming $350/month) | $48,300 |
| Rental expense (Assuming $3K/month) | $126,000 |
| Total cost | $1,066,692 |
Buy a resale 3-bedroom condo
The specific project you choose will determine whether you need to utilise your maximum budget. For calculation purposes, let’s assume you do and hold the property for 15 years.
| Purchase price | $2,500,000 |
| BSD | $94,600 |
| CPF + cash | $1,000,000 |
| Loan required | $1,594,600 |
| BSD | $94,600 |
| Interest expense (Assuming 30-year tenure at 4% interest) | $804,915 |
| Property tax | $91,200 |
| Maintenance fees (Assuming $350/month) | $63,000 |
| Total cost | $1,053,715 |
Buy a BTO
With $1M in CPF and cash, you have the flexibility to fully pay for the BTO and still have funds remaining for other investments. For this scenario, let’s assume you take that approach. As with the previous examples, we’ll consider a 15-year timeframe, where you rent for 4 years during construction and reside in the property for 11 years.
| Purchase price | $615,000 |
| BSD | $13,050 |
| CPF + cash | $1,000,000 |
| Loan required | $0 |
| CPF + cash remaining | $371,950 |
| BSD | $13,050 |
| Property tax | $4,598 |
| Town council service & conservancy fees (Assuming $75/month) | $9,900 |
| Rental expense | 144000 |
| Total cost | $171,548 |
Assuming that you invest $300,000 of the remaining CPF + cash for 15 years, let’s take a look at the potential gains at various ROI.
| ROI | Potential Gains |
| 4% | $240,283 |
| 5% | $323,678 |
| 6% | $418,967 |
| 7% | $527,709 |
What should you do?
Let’s do a quick recap on the potential cost incurred for the various options.
| Potential pathways | Property value | Cost incurred | Average growth rate required in order to breakeven on the cost in 15 years |
| Buy a 5-room resale flat | $1,250,000 | $240,925 | 1.18% |
| Buy a 3-bedroom new launch condo | $2,500,000 | $1,066,692 | 2.40% |
| Buy a resale 3-bedroom condo | $2,500,000 | $1,053,715 | 2.37% |
| Buy a BTO | $615,000 | $171,548 | 1.65% |
When comparing the average annual growth rates required to break even across the different options, all pathways appear feasible based on historical data. However, each option presents distinct advantages and trade-offs that merit careful consideration.
Buying a BTO incurs the lowest costs since you can avoid taking a loan. With your available CPF and cash, you can fully pay for the BTO and allocate the remainder to other investment avenues. As demonstrated earlier, even with a conservative 4% return on investment (ROI), the potential gains from your investments would more than cover the costs incurred over a 15-year horizon.
Additionally, the lower price point of a BTO makes it an appealing option if you plan to eventually purchase a second property. While we cannot confirm the feasibility of an owner-occupier arrangement without more details about your income and CPF balances, your substantial CPF and cash reserves suggest this could be a viable approach. It’s important to note that under this arrangement, the occupier’s CPF funds cannot be used for the BTO purchase. If your fiancee is not an occupier then ABSD would be due as the condo would be considered her second property, which is not ideal.
The primary drawback of the BTO pathway is the extended timeline. With a 4-year construction period and a 10-year Minimum Occupation Period (MOP), the occupier would only be eligible to purchase a second property after 14 years. This delay represents a considerable opportunity cost, as property prices and investment opportunities could evolve significantly in that time.
However, the main advantage of getting a BTO is the profit. While new rules such as the Subsidy Recovery and the income ceiling could reduce the profit you could make, it’s more likely that you’ll be sitting on cash profits during your MOP which you can use to make a downpayment for a condo or just to purchase a resale flat elsewhere and utilise the cash for other investments.
If you own a Prime HDB, you won’t be able to rent out the whole unit too. This could set you back if you intend to use it as an investment vehicle. As such, it may make sense to simply sell the BTO later and use it as a platform to upgrade or simply cash out.
Purchasing a centrally located resale 5-room HDB offers several advantages. Since no new 5-room flats have been launched in central areas since 2017, younger units in this category are limited, making them potentially more resilient in value. Additionally, under the owner-occupier arrangement, you could purchase a second property after just a 5-year MOP.
If your long-term goal is to eventually own two properties, buying an HDB first appears to be the more practical approach.
Private properties generally demonstrate stronger capital appreciation compared to resale HDB flats, as evidenced by historical data. However, this depends heavily on the specific project purchased. Private properties also offer shorter holding requirements, with only a 3-year Seller’s Stamp Duty (SSD) period. By purchasing under a 99-1 arrangement, you could decouple and purchase a second property once your financial position strengthens. While this offers flexibility, the higher purchase price of a private property and the challenge of supporting the loan under a single name in the short to medium term could limit its viability.
Given these considerations, purchasing an HDB first appears to be the more prudent choice. Between a resale flat and a BTO, we recommend leaning towards the resale option. It allows you to enter the private property market sooner, with a 5-year MOP instead of a 14-year timeline for BTOs. Furthermore, the scarcity of younger, centrally located 5-room flats may support their value over time. Your BTO, being located in Queenstown and likely having restrictions, would probably be restricted from whole unit rental.
Forfeiting your BTO would not significantly affect your financial position, apart from the loss of the down payment, since your combined income already exceeds the threshold for receiving any CPF housing grants.
At Stacked, we like to look beyond the headlines and surface-level numbers, and focus on how things play out in the real world.
If you’d like to discuss how this applies to your own circumstances, you can reach out for a one-to-one consultation here.
And if you simply have a question or want to share a thought, feel free to write to us at stories@stackedhomes.com — we read every message.
Need help with a property decision?
Speak to our team →Read next from Editor's Pick

Property Advice We Can Buy Two HDBs Today — Is Waiting For An EC A Mistake?
Singapore Property News Why The Feb 2026 BTO Launch Saw Muted Demand — Except In One Town

Property Market Commentary Why Some Old HDB Flats Hold Value Longer Than Others
Overseas Property Investing A London Landmark Is Turning Into 975-Year Lease Homes — And The Entry Price May Surprise Singapore Buyers
Latest Posts

Property Market Commentary We Review 7 Of The June 2026 BTO Launch Sites – Which Is The Best Option For You?

Singapore Property News The Most Expensive Resale Flat Just Sold for $1.7M in Queenstown — Is There No Limit to What Buyers Will Pay?

On The Market Here Are The Cheapest 4-Room HDB Flats Near An MRT You Can Still Buy From $450K






4 Comments
Why are you still talking about 99-1 ? Having discussed with my agent , there are very few circumstances that authorities would find acceptable reasons for such an arrangement.
Isn’t the couple income ceiling for BTO is capped at $14K/couple? How is it possible that this couple earning $16K is able to get a BTO man….