Should You Buy A Newly MOP-ed Resale HDB Or BTO If You Plan To Upgrade In 5 Years? (We Analyse 14 Years Of Transactions)
August 17, 2020
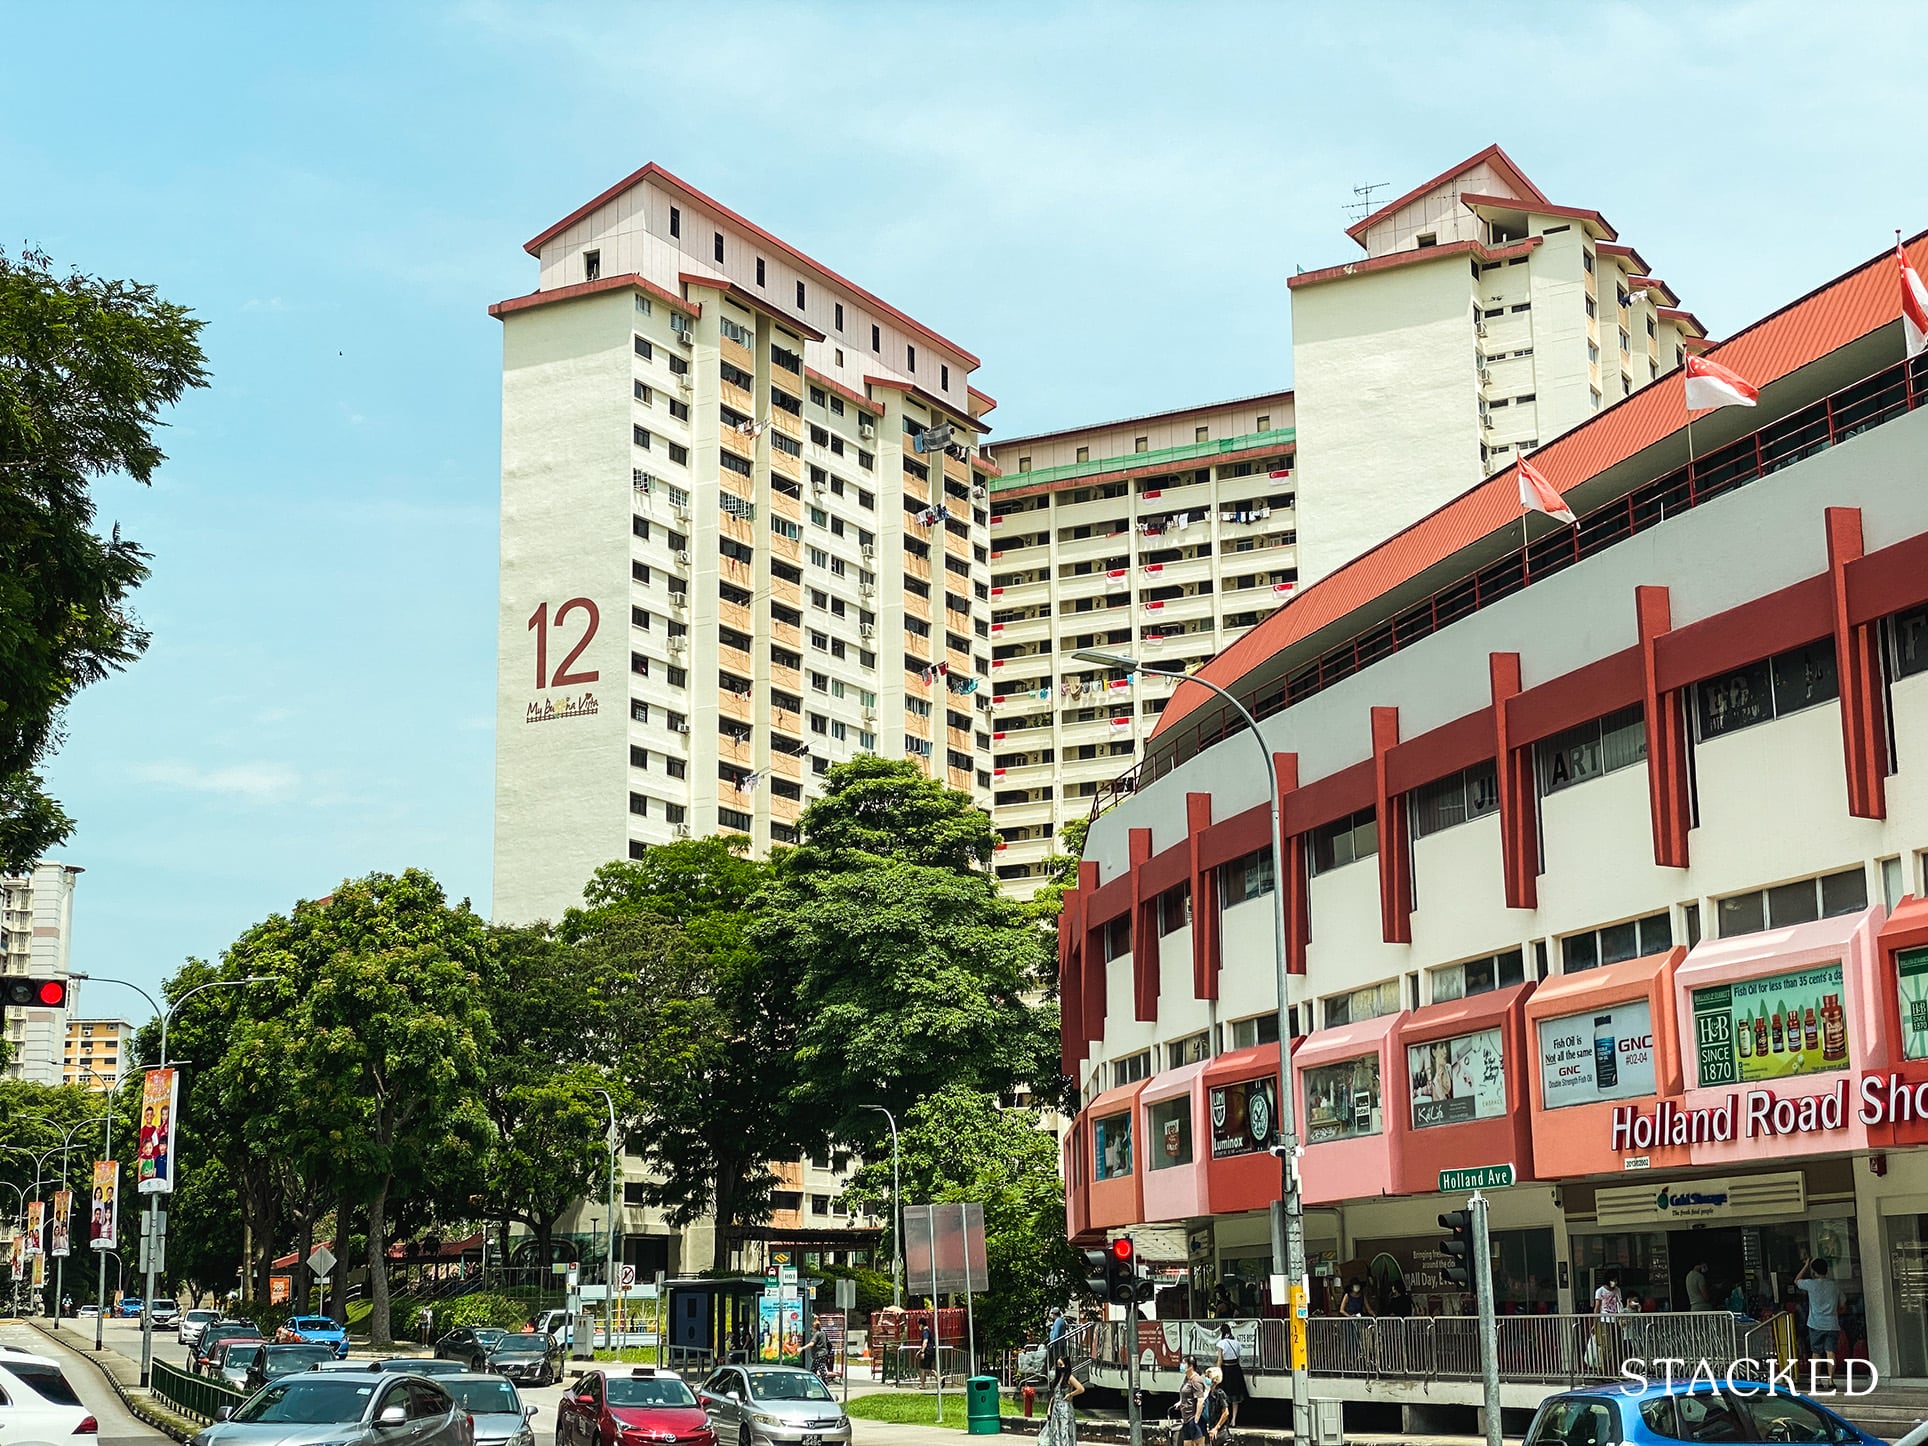
62 months.
That’s how long you might have to wait for if you’re one of the buyers looking at the UrbanVille @ Woodlands HDB BTO project.
Is it any wonder then, that many young buyers are pushed to look for resale HDB flats or smaller condo units instead – because a 5 year wait time just isn’t an ideal situation.
Here’s the thing, sometimes life just gets in the way – and you just can’t wait in limbo for a home. Whether it is as a newly wedded couple, or just a more conducive environment to embark on the journey of starting a family.
So while you might have harboured thoughts of getting a BTO to get you a nicely sized sum (upon MOP) to help as a springboard towards your condo upgrading dreams, it’s quite clear that it isn’t an option for everybody.
What then, will be the next best option?
Could you buy a resale HDB upon MOP (at its newest), stay for 5 years, before selling to upgrade (when you have accrued enough savings) to a condo?
Here’s the argument for it – with around 94 out of the 99 years lease remaining, you do get the longest possible lease possible, while still having the luxury of a newish development, and having a place to call home.
But the important question remains – if you were to sell your HDB flat after 5 years (so 10 years after MOP), could you potentially even make any money at all?
So today, let us take a closer look at this exact potential option – buying a resale HDB flat upon MOP and selling it after 5 years – could this be a good option for younger couples to consider?
For my fellow data-lovers, this statistic-centric article will comprise a breakdown of newly MOP-ed HDB flats bought at their 5-year mark and then sold again 5 years later at the 10-year mark.
We’ll try to add in some of our analysis along the way, before ascertaining some of the more comprehensive findings at the end.
Many readers write in because they're unsure what to do next, and don't know who to trust.
If this sounds familiar, we offer structured 1-to-1 consultations where we walk through your finances, goals, and market options objectively.
No obligation. Just clarity.
Learn more here.
Before We Begin, Here’s Some Context
Yes, we know that the current 5-year MOP rule wasn’t in place till 2010, but given Singapore’s relatively young age – there’s only so much property data that can be analysed as such. In any case, this just serves as a (casual) guide to what has happened in the past, and lessons that we can learn from it.
For this article, we’ll be exploring the appreciation trends of HDB/BTO flats with leases starting from 1995 up till 2009.
These flats would have been purchased 5 years after their leases started (2000 to 2014), then sold off another 5 years later (2005 to 2019).
To keep things simple, the data/findings from this analysis have been further broken down into 4 main categories:
- Estate
- Unit-Type
- Storey
- General Timeline
Following that, we’ll conclude with some thoughts on the ‘best performers’ from each of these categories.
Without further ado, let’s hop to it!
By Estate/Region
For this portion, we have also categorised each estate according to their respective regions – Core Central Region (CCR), Rest of Central Region (RCR), and Outside Central Region (OCR).
Note that sales did not occur during certain years for most of the estates, hence we are unable to do a year-by-year analysis on all the estates.
The following estate-based figures are therefore taken as a total average of sales made between 2005 and 2019.
As most of you might expect, HDB developments in the CCR have the highest appreciation rates, thanks to the presence of the CBD and bountiful amenities across the region, amongst other contributing factors. But, it’s also worth noting here that this is really only based on one project so far (Cantonment Towers).
One data point is never great to fully base a conclusion on, but I think it is safe to say based on the characteristics of the area, any BTO project here will definitely be seeing solid gains.
As for estates in the RCR, they share rather decent gains in capital appreciation given their city-fringe locales.
Ang Mo Kio and Bishan top the RCR list as highly sought-after estates in District 20 (which coincidentally ranked #5 on our district appreciation rankings) – thanks to the maturity of the estates and the presence of major public transportation nodes in the area.
Their appreciation stats over the years ranged by 28.02% and 26.84% respectively.
Although again, it must be mentioned that Bishan has had only one BTO launch in 1998, so take away what conclusion you will about the performance of the estate.
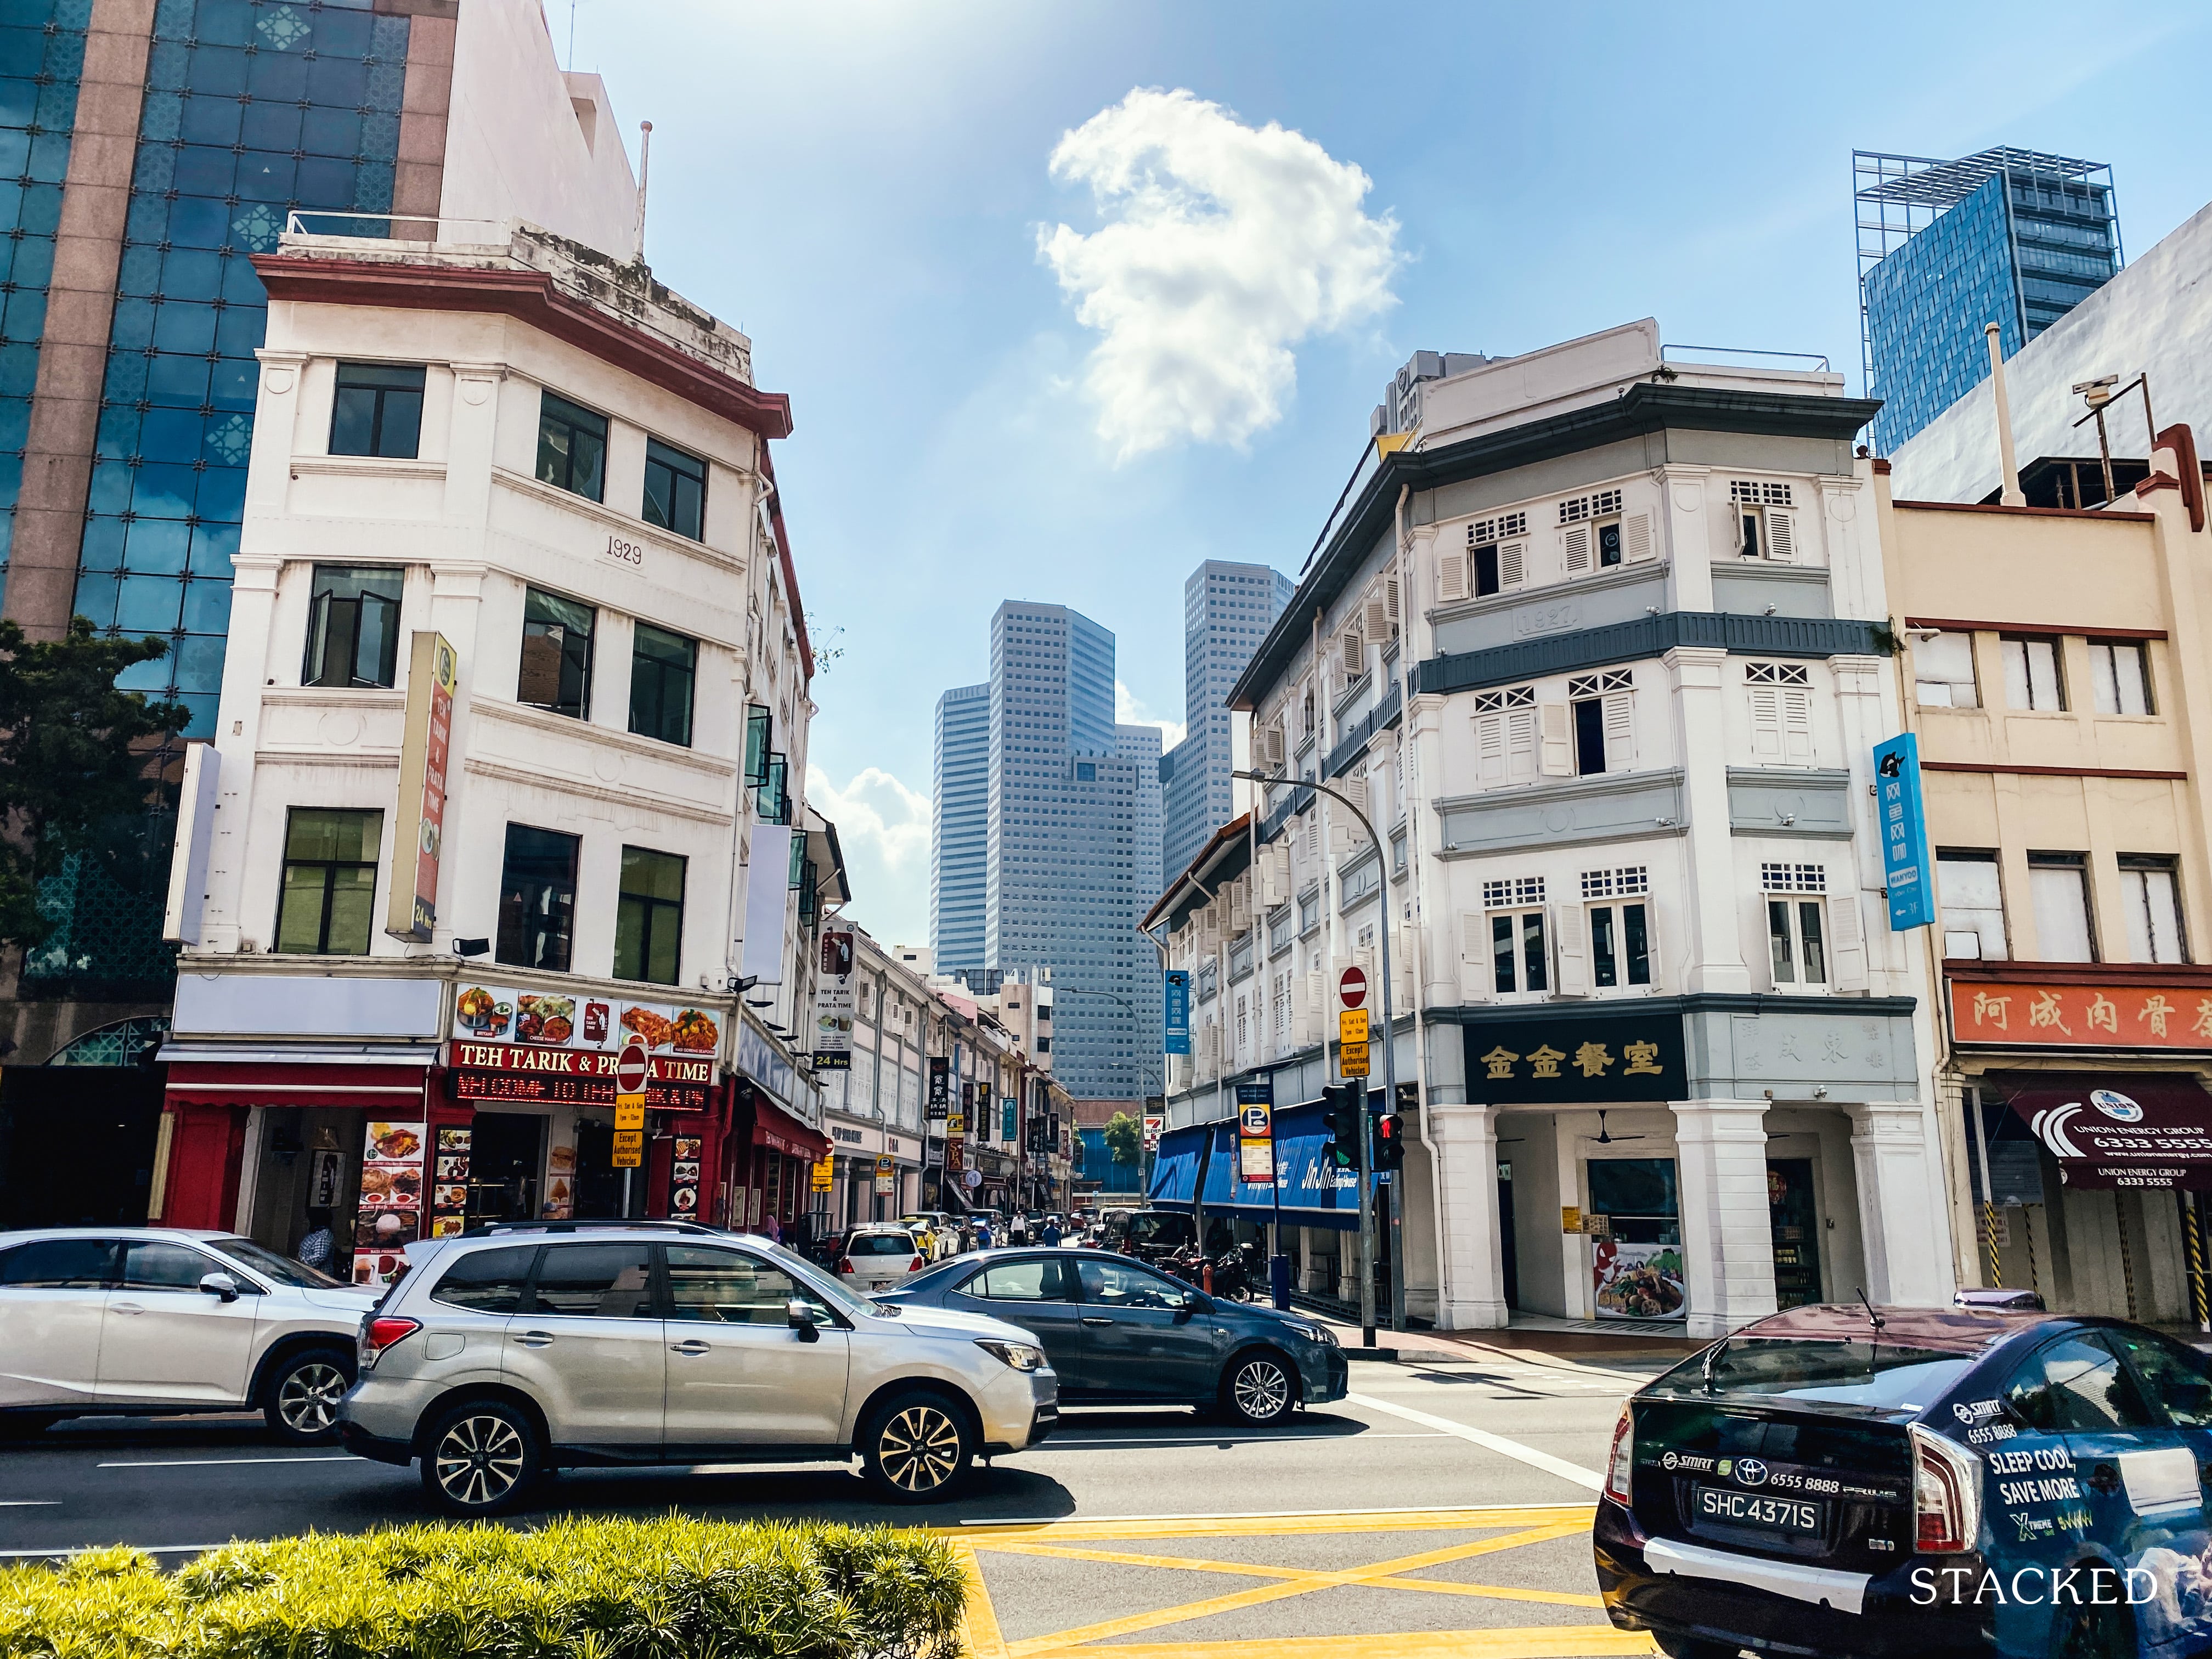
Geylang hovers at the bottom of the RCR list – though it does maintain a rather healthy appreciation of 18.05% over the years. Here’s a look into the crystal ball for future developments in that area.
Property Investment InsightsTop 10 Singapore Districts With The Highest Property Appreciation
by Ryan J. OngMoving on to the OCR, we found a vast range of varying appreciation rates across the estates involved.
Let us start with the two outliers on the graph, Pasir Ris and Tampines.
Both have garnered negative appreciation rates over the years, and their figures currently stand at -15.64% and -8.47% respectively.
But before you get the wrong idea about Pasir Ris and Tampines, you should know that this was based on the fact that the last few BTO launches in these estates were all the way back in 1995/1996.
More importantly, however, anyone who bought an HDB flat in 1995/1996 basically bought at a high.
This was attributed to HDB basing the prices of newly-built flats (RFS – Registration for Flats System not BTO back then) on market prices, instead of construction costs. Unsurprisingly, this meant that prices tripled from 1993 till the peak in 1996. But since we are looking at prices bought 5 years later (2000/2001) and resold 5 years later (2005/2006) – what gives?
Basically, the 1997 Asian Crisis had a huge impact, leaving 40,000 unsold completed flats in 2000. This was further compounded with SARS in 2003, and thus the BTO scheme had to be introduced to prevent oversupply. Of course, with more supply than demand, it meant that HDB resale prices were soft – resulting in further losses across the board.
Finally, the OCR estates that saw the best appreciation rates were Clementi, Jurong East, and Sembawang at 45.8%, 43.17% and 40.4% respectively.
The first 3 estates are still relatively close to the RCR and are filled with top-notch amenities – for instance, Jurong East features the well-known Jcube and Westgate malls (not to mention the entire industrial areas just further on), while Clementi is known for its abundance of top schools including Polytechnics and Universities.
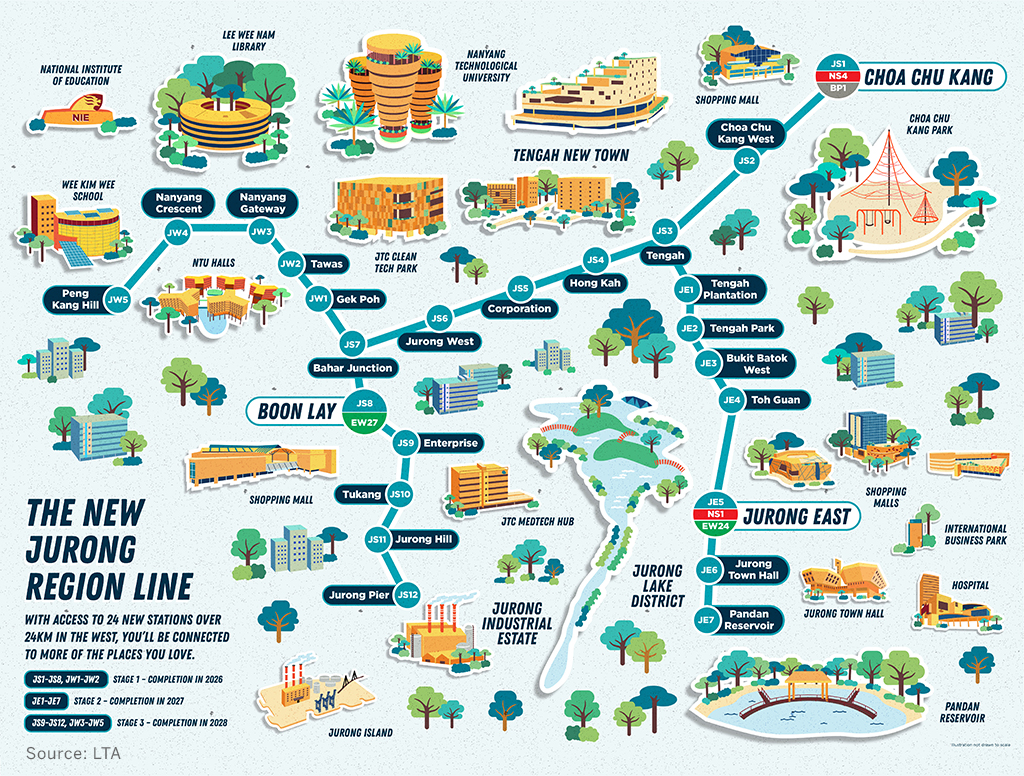
Looking at the Masterplan 2019, we realise that there is still more to come for the Jurong region. With the entire Jurong Innovation district set to bring more jobs and further connectivity, it’s easy to see the appreciation-related benefits of owning a unit from the area in current times.
As for Sembawang, despite being a non-mature estate far from the central areas, it is not surprising to find that it has some impressive appreciation rates.
Situated on the northern tip of Singapore, Sembawang offers plenty of scenic nature views and recreation options that boast plenty of shopping malls, along with a number of homes with seaside views (in other words, it’s a very ‘liveable’ place for homeowners).
Let us now zero in on the differences unit-types can make.
By Unit-Type Average
Just a heads up before we begin, you might notice that several of the 5-year phases in the graph below don’t actually display the data for certain unit-types.
(Also, note that the X-axis is showing the year in which the flat was sold, not bought).
For example, there is no data for 2-room flats sold between 2000 and 2011, or 3-room flats between 2001 and 2007 (for starters).
This is due to one of 2 reasons. Firstly, either no flats of that particular unit-type were sold in that year, or secondly, that there were too few flats of that unit-type sold to produce quantifiable data.
With the exception of flats sold in the years 2005, 2012 to 2014, and 2016 to 2019, 4-room flats were the top appreciating unit type (or least depreciating when bought in 2001).
Perhaps, you can attribute this to Singapore’s ever-growing ageing population – and the increasing demand for larger units to accommodate multi-generational families.
4-room flats have not been performing too well in recent years, though – or more specifically, when bought after 2012.
Let’s move on to storey-range performance for units bought at the 5-year mark and sold 5 years later.
By Storey
From the data we collected for this graph, we realised three things.
Firstly, there is an interesting ‘historical’ reason behind the lower appreciation rates for units on the 1st to 18th stories, compared to those on the 19th to 30th stories.
Up till 1996, flats in Singapore were built up to 18 stories high.
Coincidentally, our data showed that a majority of the flats that were purchased in 2000 and 2001 (start of the lease being 1995 and 1996 respectively) mostly had negative appreciation rates across all floors when subsequently sold off 5 years later (in 2005 and 2006).
As such, units that we see on the 19th storeys and above ‘escaped’ that period of negative appreciation rates (as we will show in our subsequent section).
If it weren’t for that fact, the average numbers on the graph above for the 1st to 18th-storey units would naturally be a little higher.
Secondly, we see that higher-storied units tend to appreciate better over the years based on the gradual increase in appreciation numbers for higher-floored units up till the 28th to 30th storey bracket.
Finally, we observe the drastic drop in appreciation stats for units on the 31st storey and higher.
To put some semblance of logic to this, it would mostly be due to the fact that these higher-floored units only came into the market from 2006 onwards (considering that our lease range for this study is from 1995 – 2009).
Let’s now have a look at the general timeline of appreciation figures across all the sales.
By Timeline
To start things off, note how high the great probability of loss is for units sold in 2005 and 2006 (bought in 2000/2001) – which we have explained earlier due to the oversupply of flats in 1995/1996.
Speaking of returns, the best run for resale HDB units was most favourable when sold between 2010 and 2014 (this means bought between 2005 and 2009).
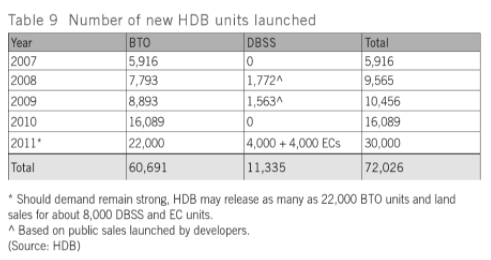
This was due to the introduction of the BTO scheme and various upgrading programmes and Selective En-bloc Redevelopment Scheme (SERS) which gave to a rise in older resale flat prices. Notably, as well, the walk-in selection was abolished in 2007 and replaced by the Sale of Balance Flats – which means that the BTO became a bottleneck in the release of new flats.
Because of a failure to anticipate a recovery of the economy, the past few years of slow BTO supply meant that resale HDB flat prices were pushed further up because of the demand.
However, times after this period were not as favourable, as you may have noticed from the drastically rising probability of loss for units bought from 2010 onwards.
Many of you may recall the period of weakened property market sentiment from 2013 to 2017, in the wake of the crisis and subsequent implementation of the cooling measures.
The removal of the COV plus the concerns over the value of ageing leasehold HDB flats gave rise to further declining resale HDB prices.
This led to housing prices tanking once again and subsequently maintaining an unsteady ebb and flow – hence the lower chances of profit and a higher probability of incurring losses when flats bought 2010 onwards were sold during this period (2015 onwards).
Key Statistical Takeaways
In light of the Covid-19 pandemic and current period of recession in Singapore, housing prices are holding steady (for now), although it is still hard to speculate the performance appreciation-wise of MOP-ed units bought after 2015.
Nonetheless, based on our findings, we find that there is a certain demographic of post-MOP flats that tend to attract higher appreciation stats when bought at the 5th-year mark and sold 5 years after.
In simple points, there are:
- BTO Flats in central areas (So either RCR or CCR), or in OCR regions with rare amenities + potential for future growth + major work hubs (ie. Clementi, Jurong East or Sembawang).
- Higher storey-ranges up till the 30th stories.
- 4-room flats
- Those bought when coinciding with good property market periods (ie. buy low sell high)
Final Words
At the end of the day, we should be aware that basing all of our future predictions solely on past trends could be quite foolish.
As one of my favourite quotes by Mark Twain goes – ‘History doesn’t repeat itself, it merely rhymes’.
When taken in proper context, let it be a way for you to take pointers to learn from.
Another point to note is that these factors are simply some of the bigger outliers that often affect appreciation trends. There are tons of other factors like ‘proximity to MRT stations’ or even ‘noise/traffic volume of area’ that could affect appreciation trends based on every other block.
These are also general averages, so it is possible that a certain 2001-built, 4-roomed, high-floor unit in a central area, when purchased in 2006 and sold in 2011, could have bad appreciation rates (even if it is relatively unlikely).
So what can we really conclude from seeing all these data? Ultimately, the truth of the matter is that the Government plays a huge role in the outcome of resale HDB prices. So depending on the regulations, these can have a ripple effect on how HDB resale prices play out.
Do have a good think about what is more important to you – profits or having a stable place to call home. Appreciation stats are but one of the few factors for a homeowner when compared to comfort and liveability.
Have a question? Feel free to reach out to us at stories@stackedhomes.com or message us on Facebook.
At Stacked, we like to look beyond the headlines and surface-level numbers, and focus on how things play out in the real world.
If you’d like to discuss how this applies to your own circumstances, you can reach out for a one-to-one consultation here.
And if you simply have a question or want to share a thought, feel free to write to us at stories@stackedhomes.com — we read every message.
Frequently asked questions
Is buying a resale HDB flat after MOP a good option for upgrading in 5 years?
What are the regions where HDB flats tend to appreciate more in value?
How does the type of HDB flat affect its potential for appreciation?
What historical trends influence the resale value of HDB flats bought after MOP?
Should I consider other factors besides appreciation when choosing an HDB flat for upgrading?
Reuben Dhanaraj
Reuben is a digital nomad gone rogue. An avid traveler, photographer and public speaker, he now resides in Singapore where he has since found a new passion in generating creative and enriching content for Stacked. Outside of work, you’ll find him either relaxing in nature or retreated to his cozy man-cave in quiet contemplation.Need help with a property decision?
Speak to our team →Read next from Property Trends
Property Trends The Room That Changed the Most in Singapore Homes: What Happened to Our Kitchens?
Property Trends Condo vs HDB: The Estates With the Smallest (and Widest) Price Gaps

Property Trends Why Upgrading From An HDB Is Harder (And Riskier) Than It Was Since Covid
Property Trends Should You Wait For The Property Market To Dip? Here’s What Past Price Crashes In Singapore Show
Latest Posts

Singapore Property News Why Some Singaporean Parents Are Considering Selling Their Flats — For Their Children’s Sake
Pro River Modern Starts From $1.548M For A Two-Bedder — How Its Pricing Compares In River Valley
New Launch Condo Reviews River Modern Condo Review: A River-facing New Launch with Direct Access to Great World MRT Station








2 Comments
Your last line on weighing the profits or stability as a home really hits home the whole point. I think we really should not look at HDB as profit making, but rather should we one day intend to move on from here (hopefully upgrade), not to make losses, more like. Going forward it is really a game of protecting your nest and value rather than making money out of it.