New Launch Vs Resale: Which Is More Profitable? We Look At 3,612 Transactions Over 5 Years
October 11, 2022

There are some untested sayings that have been in the Singapore private property market for decades. One of the more persistent ones is that new launches are better for gains; largely on the basis of “early bird discounts”, or that people are willing to pay the premium for a new build that you can move in immediately. We took a look at transactions over the past five years, to see how true it is:
Table Of Contents
Many readers write in because they're unsure what to do next, and don't know who to trust.
If this sounds familiar, we offer structured 1-to-1 consultations where we walk through your finances, goals, and market options objectively.
No obligation. Just clarity.
Learn more here.
How the following was derived
The following is based on URA transaction records, over a five-year period from September 2018 to September 2022. Through these transactions, we try to determine which of these two performed better:
- Condos bought from developers and sold later (new sale to resale) or,
- Condos bought from previous owners and sold later (resale to resale)
We analysed a total of 2,621 transactions (by this, we mean we count a successful purchase and sale as one transaction). Transactions also do not include purchases prior to September 2018, so the holding period for all transactions is 5 years or less.
This is the breakdown of transactions covered:
| Type Of Transaction | Transactions | Percentage (%) |
| New Sale to New Sale | 6 | 0.2% |
| New Sale to Resale | 285 | 10.9% |
| New Sale to Sub Sale | 573 | 21.9% |
| Resale to Resale | 1,704 | 65.0% |
| Sub Sale to Resale | 51 | 1.9% |
| Sub Sale to Sub Sale | 2 | 0.1% |
| Total | 2,621 | 100% |
The above also reveals some buyer tendencies. Over the past five years, about 11 per cent of the transactions involved buyers who purchased new launches, and then sold when the condo received its Temporary Occupancy Permit (TOP).
However, almost double that number of transactions involved sub-sales; condos that were bought at launch, and sold before the TOP. (Note that if you sell after the third year, there is no SSD applicable. It’s possible, for instance, to sell a condo in the fourth year before it’s completed, without incurring the SSD).
The majority of transactions (65 per cent) were resale-to-resale, which is an expected norm.
So were new sales or resale condos more profitable?
| Type of Tnx | Gain | Loss |
| New Sale to Resale | 12.30% | -8.05% |
| New Sale to Sub Sale | 14.98% | -5.38% |
| Resale to Resale | 14.90% | -6.35% |
| Sub Sale to Resale | 9.13% | -3.64% |
| Sub Sale to Sub Sale | 15.48% | |
| Grand Total | 14.55% | -6.39% |
Across the board, almost every transaction type saw gains of over 10% – the highest going to those who bought new and sold before TOP, and those who bought resale. This, despite cooling measures and Covid. Or should we say, perhaps because of the pandemic?
Resale to resale and new sale to sub sale transactions were the most profitable – close to 15% returns.
Flipping right after TOP (i.e., trying to buy early for the developer discount, then selling right after TOP) actually showed lower profits, at 12.3 per cent. The losses were also greater for those who adopted this strategy – at just over eight per cent compared to the 5.38% for those who sold earlier.
One reason that can explain this is that those who sell before TOP are generally those who are very satisfied with what they can get without having to hold it longer. There’s a mentality that if a target profit cannot be reached, the property can be held on to until conditions improve. This is the advantage of new leasehold properties since the depreciation effect is negligible. As such, many buyers could still hold onto their purchases, waiting for an opportune moment to let them go.
Now that we’ve considered the magnitude of returns, let’s take a look at volume:
Proportions of gains and losses
| Type of Tnx | Breakeven (Vol) | Breakeven (%) | Gain (Vol) | Gain (%) | Loss (Vol) | Loss (%) |
| New Sale to Resale | 0 | 0.0% | 256 | 89.8% | 29 | 10.2% |
| New Sale to Sub Sale | 3 | 0.5% | 553 | 96.5% | 17 | 3.0% |
| Resale to Resale | 12 | 0.7% | 1550 | 91.0% | 142 | 8.3% |
| Sub Sale to Resale | 1 | 2.0% | 43 | 84.3% | 7 | 13.7% |
| Sub Sale to Sub Sale | 0 | 0.0% | 2 | 100.0% | 0 | 0.0% |
| Grand Total | 17 | 2408 | 196 | 1 |
More from Stacked
Similar Layout, Same District—But Over $500K Cheaper? We Compare New Launch Vs Resale Condos In District 5
In this Stacked Pro breakdown:
Resale to resale saw the highest proportion of profitable transactions, with around 91 per cent of the units seeing gains. In other words, about 9 out of 10 resale buyers made money.
It’s the same for those who bought new sales as it’s only slightly lower by a thin margin – around 89.8 per cent of these transactions still saw gains. So both new launch and resale condos have roughly the same proportion of gains to losses, but the higher profits from resale (see above) would put the edge in their favour.
Judging by quantum
| Type of Tnx | Gain | Loss |
| New Sale to Resale | $161,364 | -$140,750 |
| New Sale to Sub Sale | $186,166 | -$91,453 |
| Resale to Resale | $225,959 | -$114,453 |
| Sub Sale to Resale | $91,785 | -$39,686 |
| Sub Sale to Sub Sale | $154,000 | NA |
Just by sheer quantum, those who bought resale condos tend to see higher gains ($225,959), compared to those who bought at new launches ($161,364). This would run contrary to the theory that, if you get early-bird discounts, you have the highest potential ceiling for appreciation.
Property Investment InsightsIs The First-Mover Advantage For New Launch Condos Real? Here’re 4 Case Studies To See If It’s True
by Ryan J. OngWhile losses are not common in any transaction, note that losses from those who bought new launches ($140,750) are on average higher than losses from those who bought resale ($114,453).
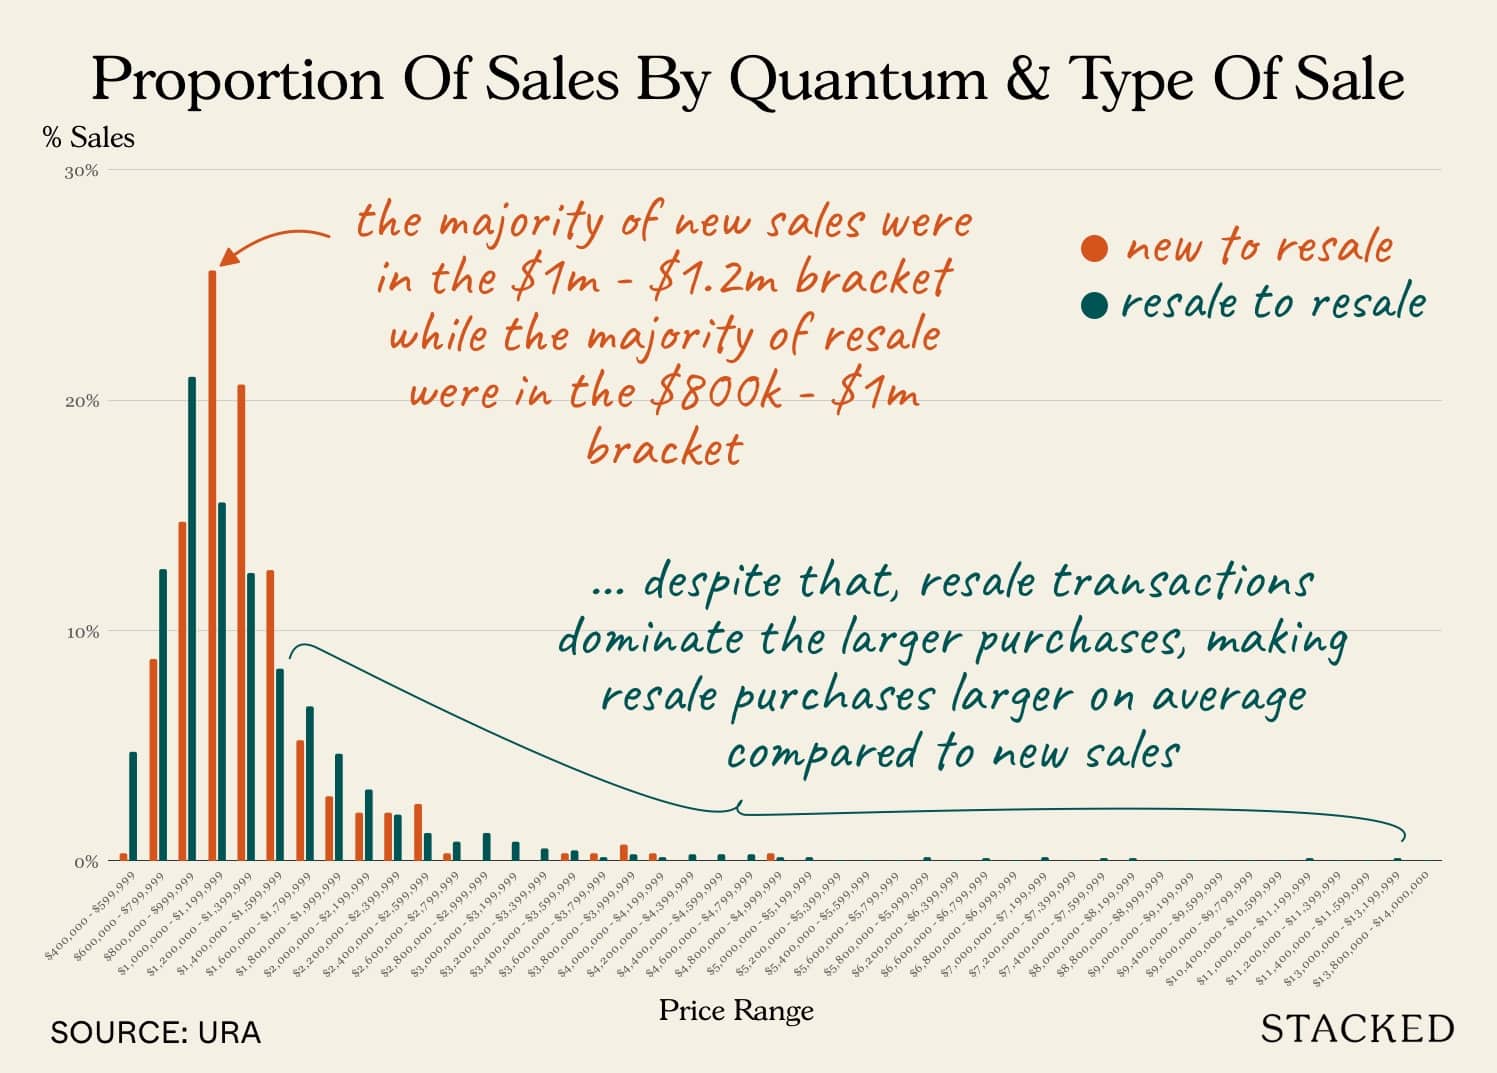
What can explain this? Taking a deeper look at the purchases made between new sales and resale properties, it’s quite clear that the resale market saw a larger number of high-quantum purchases. Naturally, this results in the average being skewed towards a larger number. In this case, if there is a higher number of multi-million dollar resale purchases compared to new launches, then naturally the average gains would also be greater – quantum-wise.
Here’s the distribution of sales between new-to-resale and resale-to-resale transactions by price range:
Breakdown by District
| District | Annualised Returns (New To Resale) | Average Returns | Volume | Annualised Returns (New to Subsale) | Average Returns | Volume | Annualised Returns (Resale to Resale) | Average Returns | Volume |
| 1 | -1.9% | -$147,983 | 3 | 1.5% | $142,011 | 14 | |||
| 2 | -1.0% | -$82,010 | 2 | 0.4% | $8,250 | 4 | 3.0% | $73,924 | 16 |
| 3 | 2.5% | $192,325 | 31 | 4.5% | $236,773 | 68 | 0.8% | $125,090 | 41 |
| 4 | 2.4% | $238,948 | 44 | ||||||
| 5 | 3.1% | $160,260 | 66 | 5.0% | $217,682 | 91 | 4.5% | $198,559 | 56 |
| 7 | -12.2% | -$1,003,580 | 1 | -2.1% | -$70,000 | 1 | 2.1% | $135,000 | 5 |
| 8 | -2.0% | -$108,600 | 1 | 4.7% | $265,200 | 1 | 3.1% | $150,970 | 34 |
| 9 | -0.8% | -$47,022 | 5 | 1.7% | $186,731 | 13 | 9.0% | $268,358 | 77 |
| 10 | -0.2% | -$8,226 | 5 | 3.1% | $1,022,000 | 3 | 3.7% | $517,695 | 113 |
| 11 | 3.3% | $244,025 | 68 | ||||||
| 12 | -0.4% | -$8,499 | 6 | 2.5% | $159,511 | 20 | 3.2% | $156,663 | 89 |
| 13 | 4.5% | $448,848 | 5 | 4.0% | $180,530 | 56 | 2.2% | $110,550 | 28 |
| 14 | 2.3% | $134,119 | 32 | 3.9% | $179,230 | 43 | 3.1% | $115,463 | 107 |
| 15 | 2.1% | $183,739 | 5 | 2.6% | $183,938 | 27 | 4.3% | $232,200 | 197 |
| 16 | 3.3% | $184,388 | 9 | 2.6% | $128,000 | 2 | 3.5% | $183,944 | 92 |
| 17 | 2.9% | $80,000 | 2 | 4.0% | $129,078 | 64 | |||
| 18 | 3.5% | $153,837 | 40 | 4.0% | $146,712 | 37 | 3.5% | $130,620 | 99 |
| 19 | 1.5% | $81,906 | 33 | 3.5% | $113,683 | 120 | 3.3% | $140,472 | 220 |
| 20 | 2.8% | $122,072 | 3 | 4.3% | $255,204 | 18 | 3.7% | $187,940 | 42 |
| 21 | 2.1% | $112,900 | 2 | 5.5% | $262,789 | 73 | |||
| 22 | 1.8% | $90,667 | 3 | 2.8% | $128,933 | 18 | |||
| 23 | 0.8% | $27,000 | 4 | 1.0% | -$19,000 | 2 | 3.7% | $148,808 | 91 |
| 25 | 1.8% | $54,772 | 18 | ||||||
| 26 | 1.3% | $48,451 | 3 | 5.0% | $191,839 | 16 | |||
| 27 | 3.0% | $138,337 | 28 | 3.6% | $184,404 | 11 | 3.8% | $133,549 | 54 |
| 28 | 3.8% | $144,124 | 52 | 3.9% | $147,325 | 28 |
One of the notable details is that within the Core Central Region (CCR), comprising districts 1,2,6,9,10, and 11, available transactions show that resale-to-resale is the clear winner. In almost every CCR district on the list (except 6 and 11 which had no transactions), those who bought during the new launch saw losses.
If we leave out Districts 7 and 8 (as there was only one transaction in each district), District 9 (Cairnhill, Orchard, Killiney) was the worst performer for those who bought at launch; on average they would have lost 0.8 per cent.
Interestingly though, District 9 was one of the best performers for resale-to-resale transactions, seeing an average gain of nine per cent.
Overall though, we wouldn’t read too much into the data here considering the low volume, especially for new sales in certain districts.
Will these trends continue?
As with everything, it’s hard to say for sure.
To be fair, we are only looking over a period of 5 years, and we haven’t accounted for all those who could be sitting on paper gains or losses from a new launch or resale right now.
Moreover, while we’ve looked at the economic effects through the actual gains and losses, statistical significance was not considered. Thus, it’s not accurate to say single out whether a new launch or resale was the better purchase in the past 5 years. It would also be incredibly difficult to do so since profitability are affected by a lot of other factors, not just whether it was sold by a developer or on the resale market.
Developers have also been operating on ever-thinner margins, and this may contribute to rising prices and shrinking discounts. This comes on the back of increasing land prices and construction costs.
Consider that 2017/18 was the height of the last en-bloc fever, which saw land prices pushed to record highs. After that, there were two rounds of cooling measures, in 2018 and 2021, which raised Additional Buyers Stamp Duty (ABSD) for developers. On top of that, there were unexpected logistical issues arising from Covid-19.
We’ve covered this in some detail in this earlier article.
We should also consider that, with new launch prices averaging $2,000 psf, there are no guarantee future HDB upgraders can afford the price tag; not unless the current HDB resale market can maintain its frenzied pace (unlikely, given changes like the new 15-month wait for right-sizers).
Follow us on Stacked to get updates as the situation changes; and also check out our in-depth reviews of new and resale properties alike.
At Stacked, we like to look beyond the headlines and surface-level numbers, and focus on how things play out in the real world.
If you’d like to discuss how this applies to your own circumstances, you can reach out for a one-to-one consultation here.
And if you simply have a question or want to share a thought, feel free to write to us at stories@stackedhomes.com — we read every message.
Frequently asked questions
Are resale condos more profitable than new launches in Singapore?
Do buyers tend to make money from buying new launches and selling later?
Which type of property transaction has the highest average profit in Singapore?
How do profits from buying early at new launches compare to buying resale properties?
Will the trend of property profits continue in Singapore?
Ryan J. Ong
A seasoned content strategist with over 17 years in the real estate and financial journalism sectors, Ryan has built a reputation for transforming complex industry jargon into accessible knowledge. With a track record of writing and editing for leading financial platforms and publications, Ryan's expertise has been recognised across various media outlets. His role as a former content editor for 99.co and a co-host for CNA 938's Open House programme underscores his commitment to providing valuable insights into the property market.Need help with a property decision?
Speak to our team →Read next from Property Investment Insights

Property Investment Insights River Modern Starts From $1.548M For A Two-Bedder — How Its Pricing Compares In River Valley

Property Investment Insights This Singapore Condo Has Bigger Units Near The MRT — But Timing Decided Who Made Money

Property Investment Insights We Compared Lease Decay Across HDB Towns — The Differences Are Significant

Property Investment Insights This Singapore Condo Skipped 1-Bedders And Focused On Space — Here’s What Happened 8 Years Later
Latest Posts

Singapore Property News Why Some Singaporean Parents Are Considering Selling Their Flats — For Their Children’s Sake

New Launch Condo Reviews River Modern Condo Review: A River-facing New Launch with Direct Access to Great World MRT Station
On The Market Here Are The Cheapest 5-Room HDB Flats Near An MRT You Can Still Buy From $550K





4 Comments
In your analysis of ‘profit’, did you consider the stamp duties of 3-4%? The cost of selling via an agent of 2%? And also the cost of equity for resale having the cash on a risk free basis of at least 2.5% with cpf (higher in recent times)?
My estimate of breakeven for new deals is approx 8% or so after 3yrs. So if it’s 9% profit at sub sale you should b barely breakeven. Resale would have to take into account cost of leverage.
hi whats new sale to new sale?