How Does An Upcoming MRT Line/Station Impact Housing Prices? A Case Study On The Downtown Line
September 5, 2020
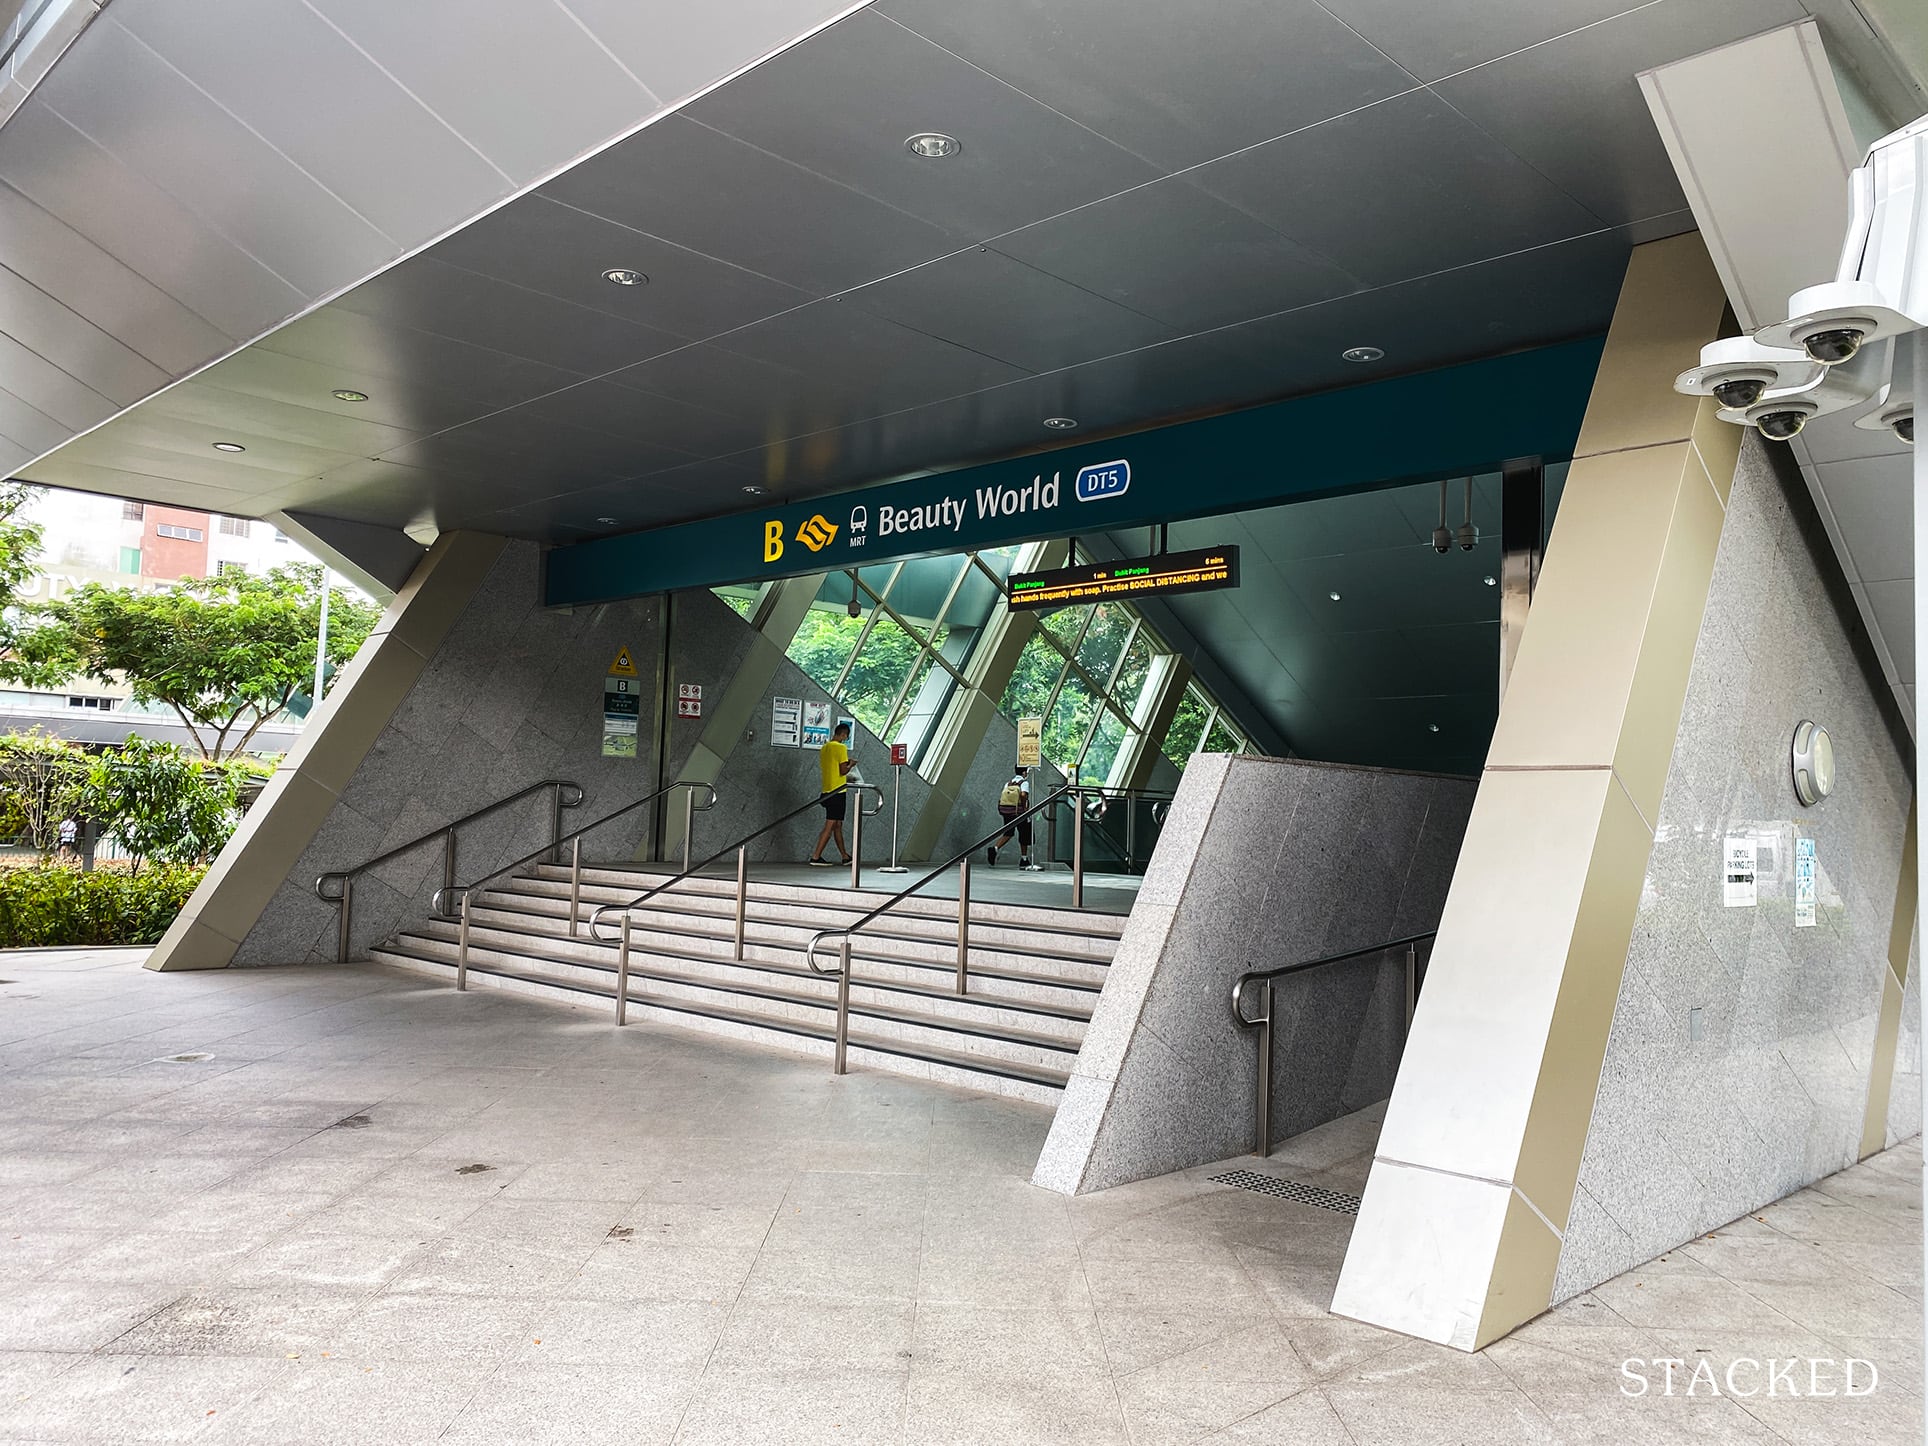
With an average of over 3.5million passengers daily, the Singaporean MRT has to be one of, if not the most utilised amenity in Singapore since its inauguration back in November 1987.
It’s also a no brainer that almost every investor/homeowner wants a development that’s within good proximity of an MRT station.
Maximised convenience (even for the well-heeled), solid rental attributes, quality surrounding amenities… the list goes on.
It’s also one reason why the rise of new MRT lines/stations are so closely followed in the Real Estate scene.
Have you ever wondered what actually happens to an existing development’s value when a new MRT station/line is either announced/built in the vicinity?
Today’s piece aims to break that down for us – with the focus on the Downtown Line MRT stations specifically.
Methodology
We’ve compiled a list of ‘before-and-after’ pricing scenarios based on affected developments within immediate proximity of the Downtown Line (which has since been fully built and functional).
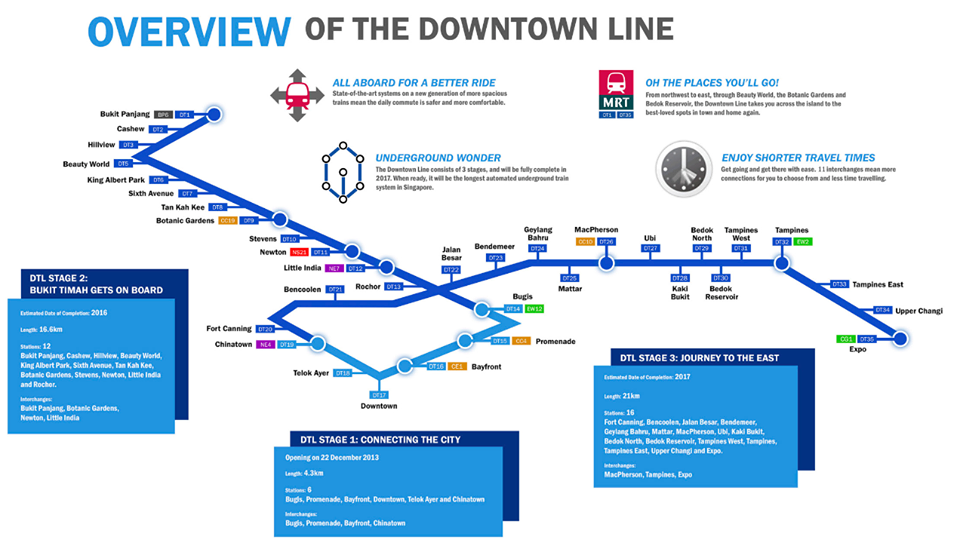
These scenarios are meant to give us a clearer picture of the impact that the various stages of the MRT implementation process has on appreciation figures of above-mentioned developments. They are:
1.) Before/After New MRT Line Announcement, and
2.) Before/After Fully Functional Line Operation (Stage 1 + 2)
We’ve also taken the remaining housing price averages in Singapore (during similar periods) to serve as a uniformed constant against the ‘impacted developments’.
(Don’t worry if it seems a little complicated at this point. I’ll explain more as we go along.)
Just one final thing before we begin.
To reduce any misconceptions, I would like to emphasise that the announcements/completions of new MRT stations in a development’s immediate area (although significant) isn’t the only factor that affects its appreciation rates.
The same goes for all of Singapore’s remaining private developments which have been included in the above-mentioned ‘constant’. There will also be stand-alone factors that impact the prices of every individual development.
In other words, it’s important to take the following figures with a pinch of salt.
Yes, housing price-trends are undeniably impacted by a myriad of factors. And while there may be repetitive big-ticket issues involved in these pricing changes (ie. announcement of new MRT lines), our housing journey predictions/actions should never be based off a singular metric as that.
Pricing Differences – Announcement of Downtown Line MRT Stations (Before & After)
So what happened when the Government announced the Downtown Line?
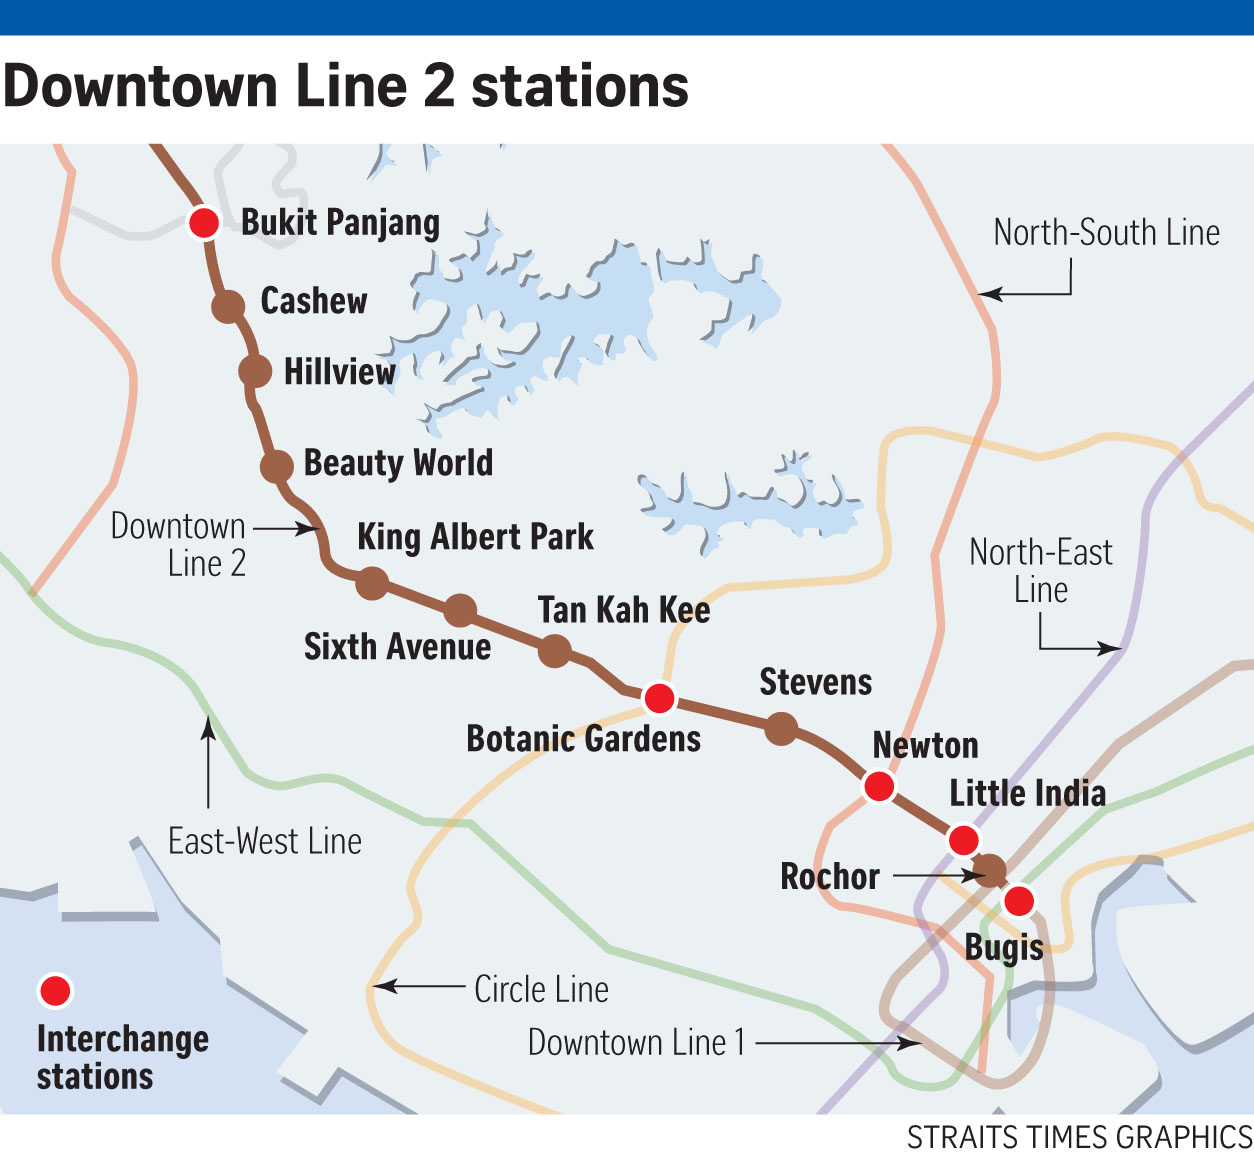
Here are the 1 year before/after price movements of condos (within immediate proximity of the ‘new’ stations) upon announcement of the Downtown Line back on 27 April 2007.
| Condos within immediate proximity of: | Average Unit Price Transactions – Before Announcement (27 April 2006 – 26 April 2007) | Average Unit Price Transactions – After Announcement (27 April 2007 – 27 April 2008) | Gains |
| Bugis | $662 psf | $888 psf | 34% |
| Downtown | $1,740 psf | $2,059 psf | 18% |
| Telok Ayer | $1,217 psf | $1,900 psf | 56% |
| Chinatown | $665 psf | $1,194 psf | 80% |
| Bukit Panjang | $403 psf | $545 psf | 35% |
| Cashew | $451 psf | $653 psf | 45% |
| Hillview | $469 psf | $646 psf | 38% |
| Beauty World | $329 psf | $515 psf | 56% |
| King Albert Park | $783 psf | $1,290 psf | 65% |
| Sixth Avenue | $681 psf | $1,050 psf | 54% |
| Tan Kah Kee | $971 psf | $1,345 psf | 39% |
| Botanic Gardens | $775 psf | $1,199 psf | 55% |
| Stevens | $874 psf | $1,226 psf | 40% |
| Newton | $1,331 psf | $1,934 psf | 45% |
| Little India | $878 psf | $1,288 psf | 47% |
| Rochor | $679 psf | $943 psf | 39% |
*Note: Stations have been arranged chronologically*
Safe to say, every single development within immediate proximity of these stations witnessed positive appreciation figures.
Interestingly enough however, the average private housing price also rose during this time from $811 psf between 27 April 2006 – 26 April 2007 to $932 psf between 27 April 2007 – 27 April 2008. A marked 29% increase.
Now if we were to then compare the gains of the above-mentioned ‘impacted’ developments to the constant’s gains of 29%, this would be the ‘extra appreciation gains’ you would be looking at.
| Condos within immediate proximity of: | Increased Gains (after 29% average housing gains in Singapore is subtracted) |
| Bugis | 5% |
| Downtown | -11% |
| Telok Ayer | 27% |
| Chinatown | 41% |
| Bukit Panjang | 6% |
| Cashew | 16% |
| Hillview | 9% |
| Beauty World | 27% |
| King Albert Park | 36% |
| Sixth Avenue | 25% |
| Tan Kah Kee | 10% |
| Botanic Gardens | 26% |
| Stevens | 11% |
| Newton | 16% |
| Little India | 18% |
| Rochor | 10% |
| Average Increased Gains: | 18% |
See that outlier that comes from the string of condos situated by the Downtown MRT station?
Let’s break it down.
While the condos in the area did observe an 18% average housing price increase post-announcements, they seem to have fallen short of the national average of 29%.
To dig further, we’ve listed the condos involved in this data cluster:
| Condos Near Downtown Station | Average Unit Price Transactions – Before Announcement (27 April 2006 – 26 April 2007) | Average Unit Price Transactions – After Announcement (27 April 2007 – 27 April 2008) |
| The Sail @ Marina Bay | $1,472 psf | $2,000 psf |
| Marina Bay Residences | $1,890 ps | $2,323 psf |
| One Shenton | $1,887 psf | $1,976 psf |
Looking at the prime prices of these luxury condos from the get-go, it’s really no surprise that we didn’t see massive price movements here – especially since the area is already so central/well connected with the presence of Raffles Place MRT just a stone’s throw away.
As for identifying a trend on which stations did better, it seemed like key areas that saw lesser MRT-related accessibility previously (ie. King Albert Park/Beauty World) tended to do better.
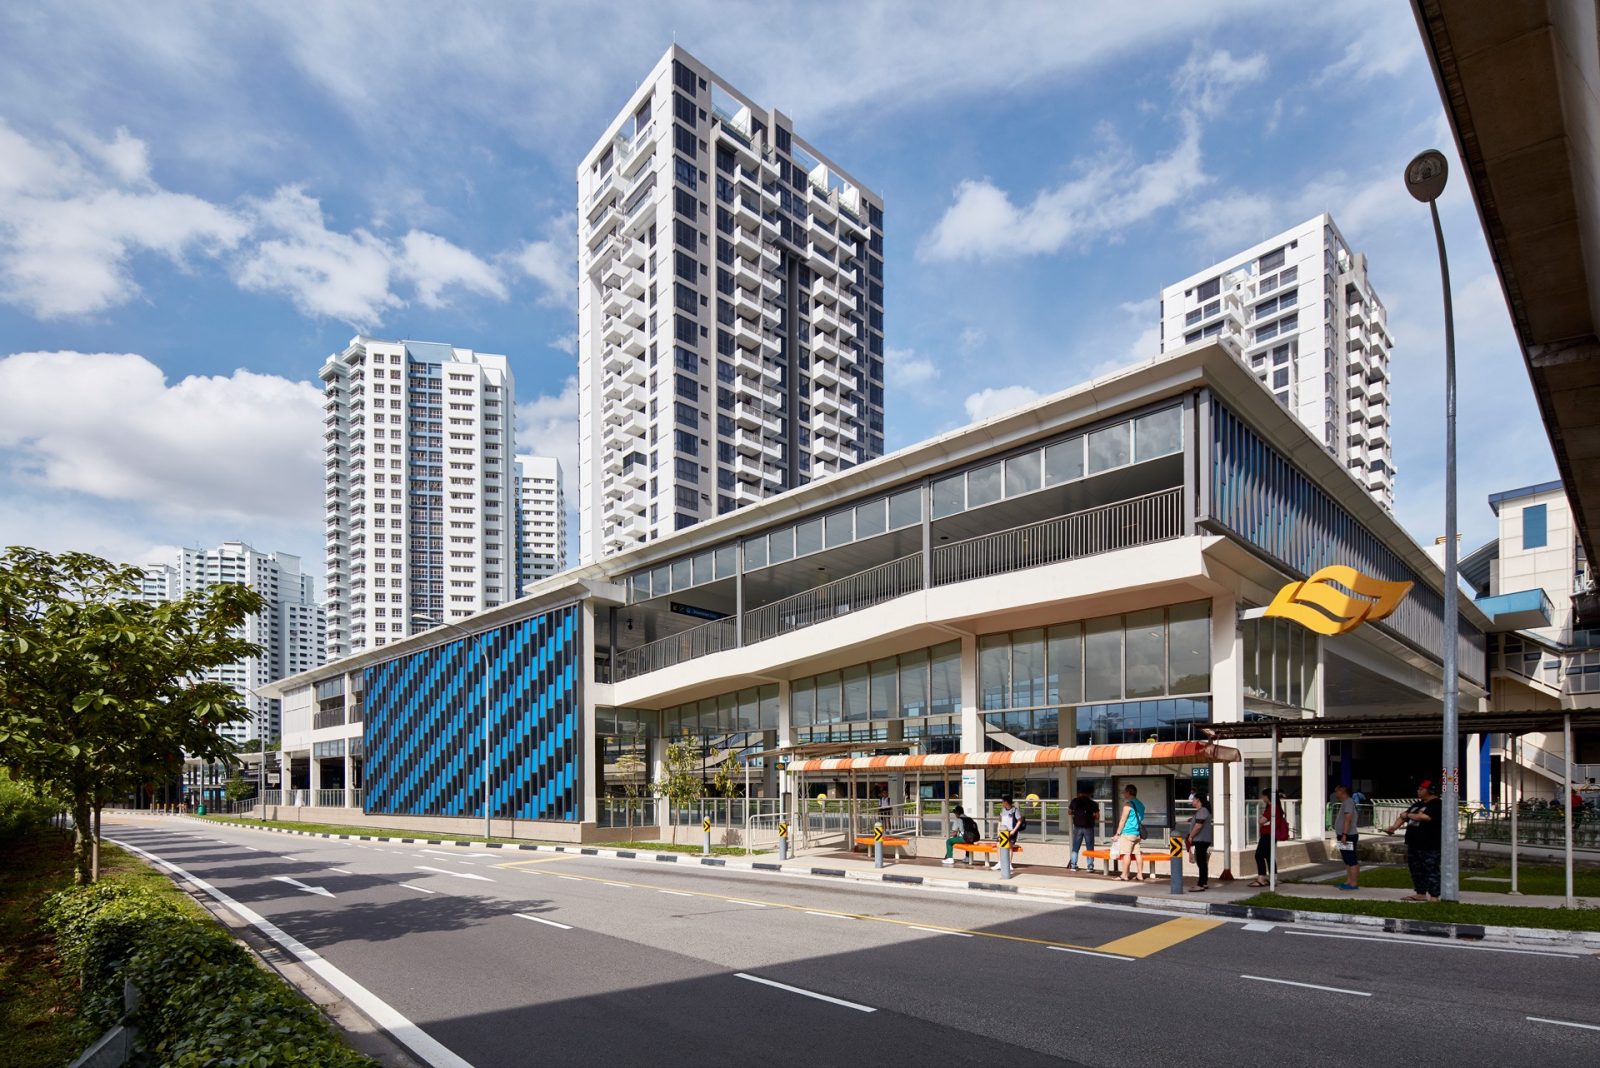
Older developments also seemed to appreciate quite significantly as we can see from the developments surrounding Chinatown Station:
| Condos Near Chinatown Station | TOP | Average Unit Price Transactions – Before Announcement (27 April 2006 – 26 April 2008) | Average Unit Price Transactions – After Announcement (27 April 2007 – 27 April 2008) |
| People’s Park Complex | 1968 | $339 psf | $626 psf |
| People’s Park Centre | 1976 | $293 psf | $543 psf |
| Emerald Garden | 1998 | $1,080 psf | $1,451 psf |
It’s clear that these developments have some mileage on them, and in turn, relatively low psf-values to begin with.
The installation of the line in the area could have thus brought an increased amount of attention to the previously depressed prices we saw here in People’s Park Complex and Centre.
Now if you further factor in the high en bloc potentials of these developments at that time, it really seems like the MRT implementation was just the spark that this stretch of drywood needed to come ablaze.
(Let’s also not forget that older developments tend to have bigger unit spaces, so any increased psf values would often mean a hefty overall quantum increase for units here.)
Pricing Differences – Completion of Downtown Line MRT Stations (Before & After)
Alright, let’s now have a look at the impact that the completion/’start-of-operation’ of the Downtown Line had on unit prices of developments within immediate proximity.
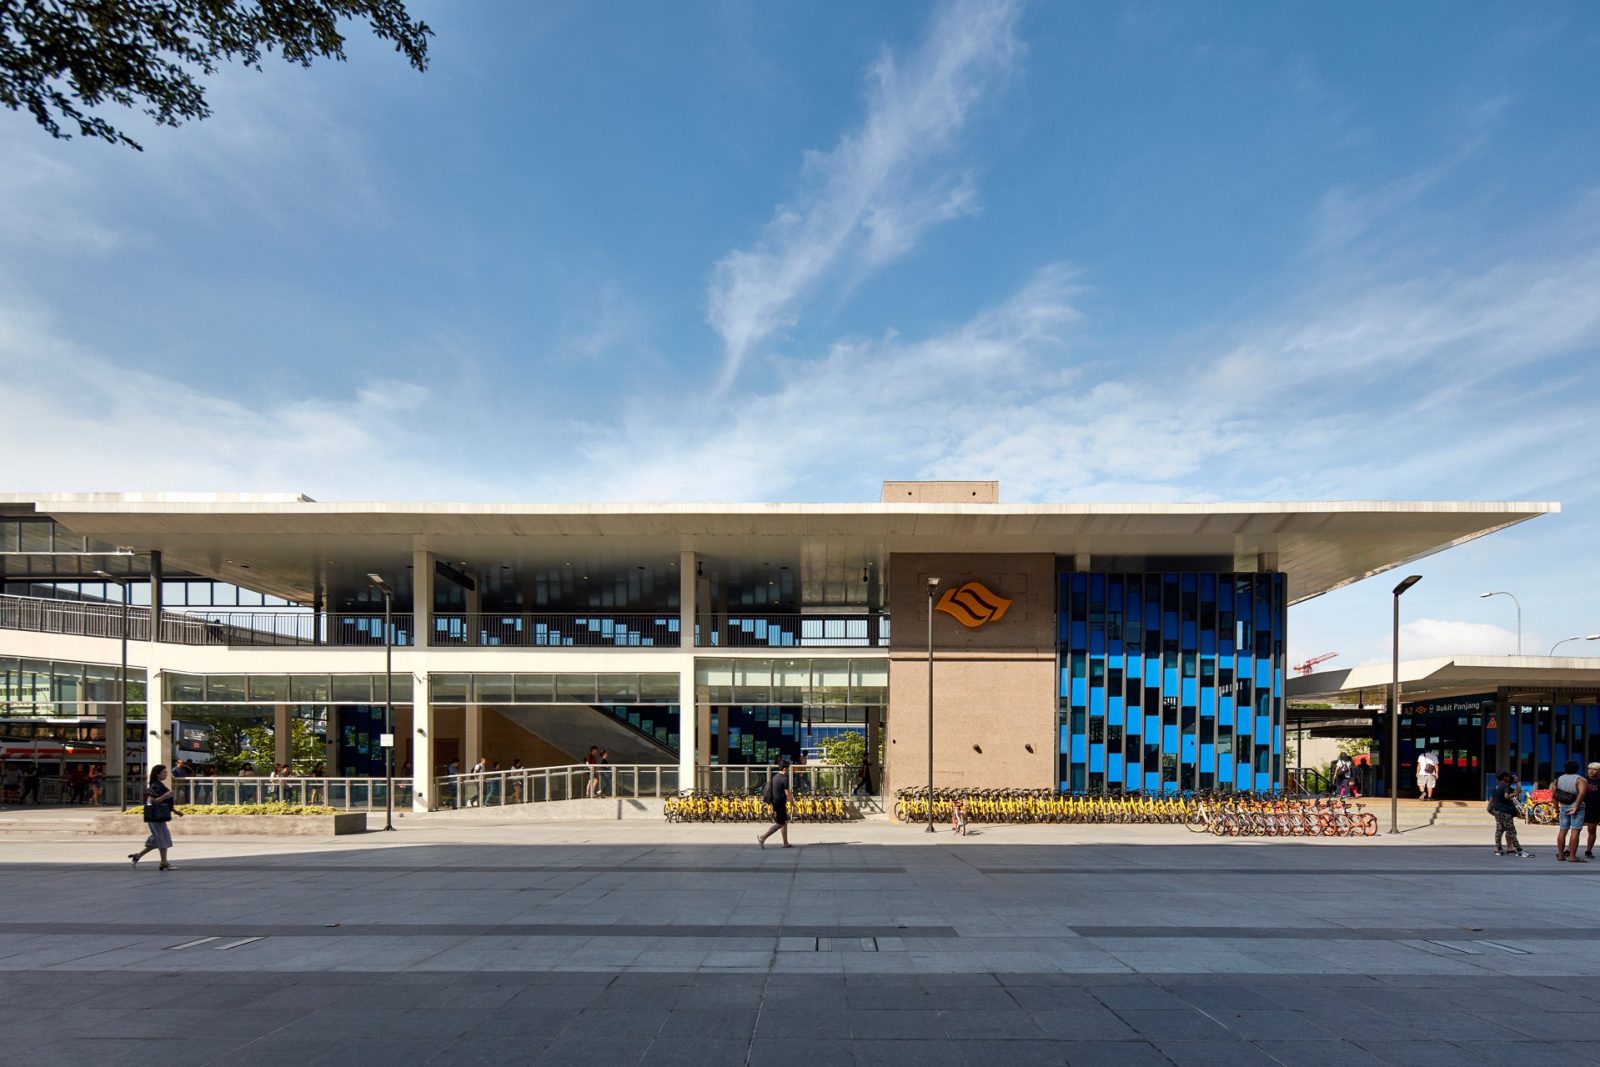
Stage 1 (Service Commenced 2013)
| Condos within immediate proximity of: | Average Unit Price Transactions – Before Commencement (22 December 2012 – 21 December 2013) | Average Unit Price Transactions – After Commencement (22 December 2012 – 22 December 2013) | Gains |
| Bugis | $1,414psf | $1,290psf | -9% |
| Promenade | N.A | N.A | N.A |
| Bayfront | N.A | N.A | N.A |
| Downtown | $2,412psf | $2,233psf | -7% |
| Telok Ayer | $2,370psf | $2,067psf | -13% |
| Chinatown | $1,320psf | 1,324psf | ~0% |
More from Stacked
Singapore’s First W Hotel–Branded Condo Launches From $3,230 PSF in Marina Bay: Here’s What You Need To Know
Branded residences have long occupied a rarefied corner of real estate - one where lifestyle often outweighs yield, and where…
*Note: Bayfront & Promenade MRT stations do not have any surrounding condos hence they have been omitted from the list*
Unlike the previous announcement-related section, appreciation figures here are definitely on the downtrend.
That said, we should also bear in mind that this was the period where 2013 cooling measures were implemented, naturally stagnating housing-price growth.
Property Market CommentarySingapore Cooling Measures – History of cooling measures since 2009
by Stanley GohWhen bringing in the constant (ie. price growth of all other condos in Singapore), we see that the average private housing price also fell during this time from $1,351psf between 22 December 2012 – 21 December 2013 to $1,311psf between 22 December 2012 – 22 December 2013. A 3% decrease overall.
When compared against the national average, this was how the above-mentioned developments fared:
| Condos within immediate proximity of: | Gains (after -3% average housing gains in Singapore is subtracted) |
| Bugis | -6% |
| Downtown | -4% |
| Telok Ayer | -10% |
| Chinatown | 3% |
| Average Gains: | -4.25% |
Again, it seems like they fell behind the national average.
Could it be that an overhype had already been priced in, and in the face of cooling measures, these developments no longer seemed as attractive to prospective buyers when the stations eventually came to be?
Possibly.
Another tangent would be that owners here were 1.) Incredibly comfortable with the added convenience that the stations provided and 2.) Looking to fetch a much higher price for units here.
Given mismatch of pricing expectations between buyers and sellers, it is possible that units didn’t move as much, with whatever sales we observe in the tables here, a possible result of fire sales.
Of course, all these factors are merely speculation, but more concretely, we shouldn’t forget that the entire Downtown Line also had limited accessibility at this point given that spanned a mere 6 stations – and that the completion of future stages were still in the works.
Based on that, let’s see what Stage 2 has installed for us.
Stage 2 (Service Commenced 2015)
| Condos within immediate proximity of: | Average Unit Price Transactions – Before Commencement (27 December 2014 – 26 December 2015) | Average Unit Price Transactions – After Commencement (27 December 2015 – 27 December 2016) | Gains |
| Bukit Panjang | $1,179psf | $1,138psf | -3% |
| Cashew | $917psf | $938psf | 2% |
| Hillview | $1,192psf | $1,223psf | 3% |
| Beauty World | $899psf | $1,004psf | 12% |
| King Albert Park | $1,373psf | $1,345psf | -2% |
| Sixth Avenue | $1,347psf | $1,247psf | -7% |
| Tan Kah Kee | $1,495psf | $1,335psf | -11% |
| Botanic Gardens | $1,780psf | $1,778psf | ~0% |
| Stevens | $2,098psf | $1,941psf | -7% |
| Newton | $2,047psf | $1,735psf | -15% |
| Little India | $1,870psf | $1,936psf | 4% |
| Rochor | $1,258psf | $1,009psf | -20% |
Once again, the capital gains here are weighing on the negative spectrum.
On one end, we do observe developments around areas like Beauty World and Little India MRT doing relatively well, while on the other, we see appreciation rates for other developments around areas like Rochor and Newton MRT tanking.
As for the national average at that time, we observed that the average private housing price actually rose during this time from $1,256 psf between 27 December 2014 – 26 December 2015 to $1,348 psf between 27 December 2015 – 27 December 2016. A 7% increase overall.
After factoring in the national average, this was how the above-mentioned developments fared:
| Condos within immediate proximity of: | Gains (after 7% average housing gains in Singapore is subtracted) |
| Bukit Panjang | -10% |
| Cashew | -5% |
| Hillview | -4% |
| Beauty World | 5% |
| King Albert Park | -9% |
| Sixth Avenue | -14% |
| Tan Kah Kee | -18% |
| Botanic Gardens | -7% |
| Stevens | -14% |
| Newton | -21% |
| Little India | -3% |
| Rochor | -27% |
| Average Gains: | -10.6% |
In essence, you can see that these developments also did badly with the exception of the developments around the Beauty World MRT station. Not much difference from Stage 1 if we come to think of it.
So all that said, what can we learn from the tables we’ve seen today?
Key Takeaways
As always, it’s important to reaffirm that price changes are not relative purely to singular metrics (ie. rise of new MRT station in the vicinity).
That said, here are a few things that we can take away based on today’s study.
- Firstly, prices on proximitied developments increase much more following a new MRT Line/Station announcement as opposed to when the new MRT Line/Station is completely functional (ie. already built).
- Secondly, luxury, central developments that already have accessibility and exclusivity factored into their prices do not see much potential for upside when a new MRT Line/Station is built in the vicinity.
- Thirdly, developments in key areas (ie. Beauty World, King Albert Park, Sixth Avenue) tended to have the highest capital gain increase following MRT implementation announcements.
- Finally, if we choose to exclude the issue of poorer market sentiment during the period, it does seem like proximitied developments tend to fetch lower prices following the full function of the MRT lines as opposed to before it.
Now one thing we could also have done here was to bring in specific demographics of developments when comparing them as constants to all the ‘MRT-adjacent’ condos we addressed in this study (as opposed to generalizing capital gains for all the other developments in Singapore into a singular figure) – mainly to give us better price-comparative figures.
We should also note that this study is done on a singular Downtown Line implementation. To understand deeper implications/trends, we should also include studies for other MRT Line implementations over the years.
*Results are also often time-sensitive and strongly coincide with the property market index/economy of that period.
Will there be more MRT Lines in the near future?
The impact of a new MRT Line of surrounding developments isn’t something most of us would argue with.
That said, would we be able to capitalize on any potential capital gains-related opportunities like that in the coming years given that there are over 130 stations across 6 MRT Lines (including the upcoming TEL) already present in Singapore today?
Earlier this year, Transport Minister Khaw Boon Wan stated that “government spending on new MRT Lines will peak during the next two decades.”
To date, announced projects include the Thomson-East Coast Line, Jurong Region Line, Circle Line Extension and the Cross Island Line.
As for any ‘new’ unannounced lines however, many have contributed their thoughts that there will be at least 2 new lines beyond 2030.
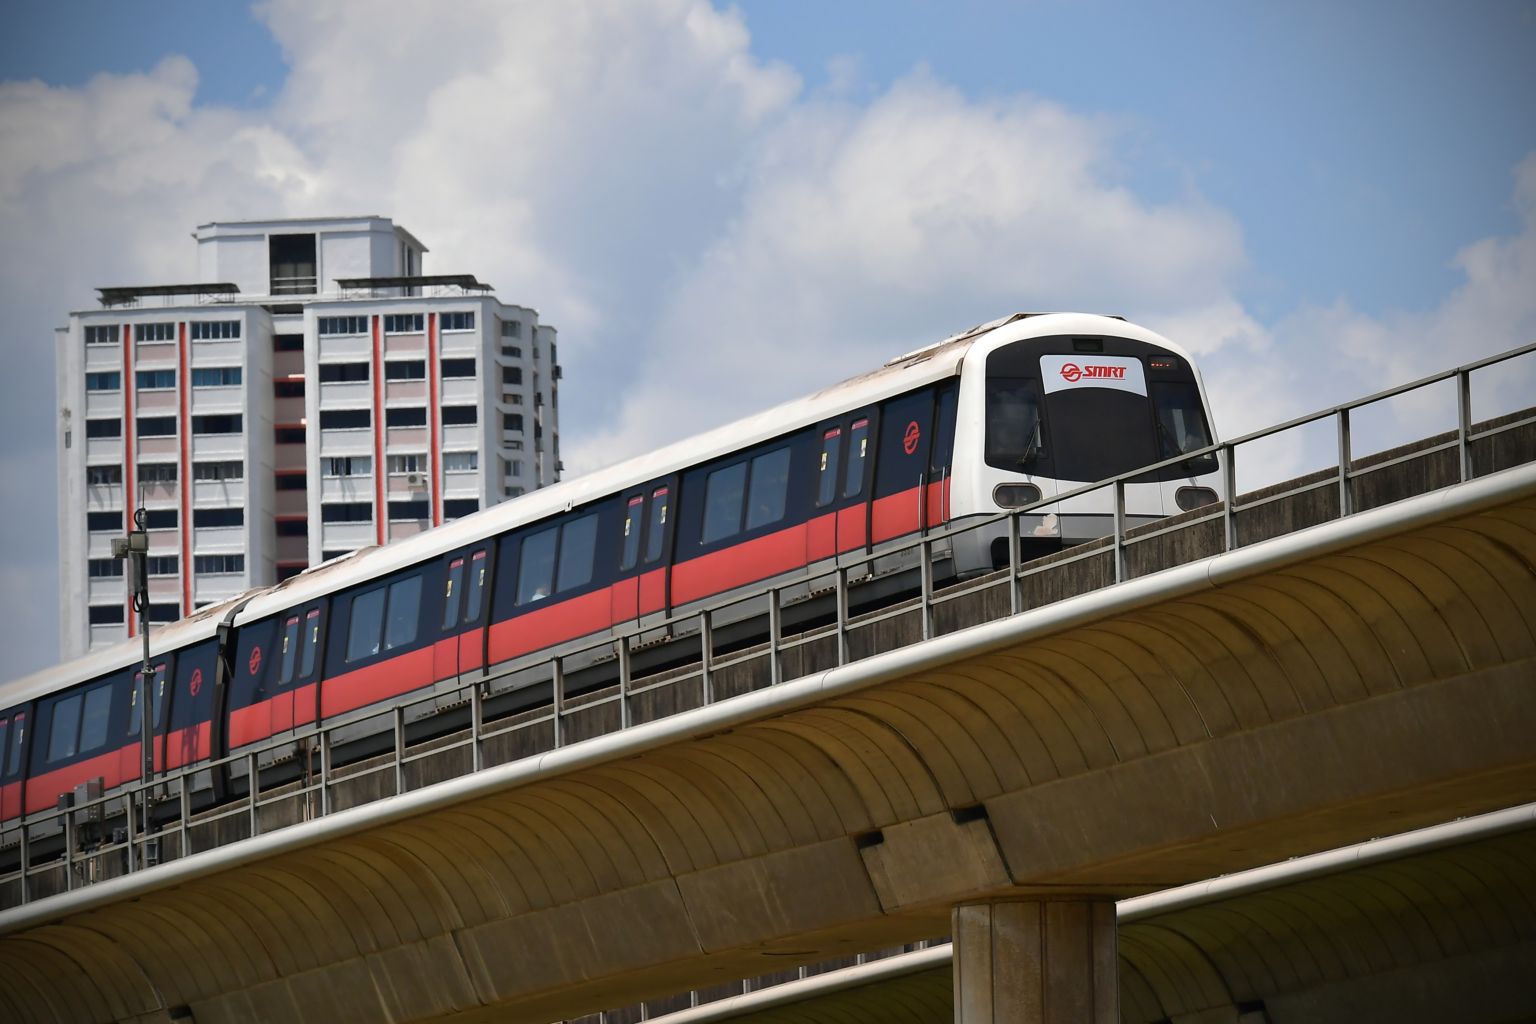
This, in accordance with the 2040 Land Transport Master Plan that confirms the studies of a new line running parallel to the current North-South MRT Line.
What’s Your Course of Action?
So yes, there is hope of more MRT Lines popping up in the future here in Singapore.
And based on past trends and experiences, there is little doubt that these announcements will contribute to gains in capital appreciation for surrounding developments affected by these implementations.
But is it really worth researching in and waiting for these scenarios? It really depends.
While this might be a guaranteed triumph card for investors, there’s no denying that it’s going to take some time before we see these announcements arrive. What’s more, we’ve already seen the willingness the government has to step in with property measures – and the impacts that these measures can have on housing market prices.
We also have almost no clue what the near to mid-term future might hold for all of us and the economy/housing market (Co-vid has been a prime example of this).
In my opinion, it’s a great trend worth noting down, doing some solid research in and leaving it for the near future. It also always helps to lay our eggs in multiple baskets by looking for other nearer-term high appreciation potential opportunities (provided capital gains are the top of your priority list and currently have the funds for a new place).
If you’d like to learn about other high ‘appreciation-potential’ tips for your next home investment, feel free to leave a comment below and I’ll get back to you as soon as I can.
As always, thanks for reading. I’ll catch you in the next one!
At Stacked, we like to look beyond the headlines and surface-level numbers, and focus on how things play out in the real world.
If you’d like to discuss how this applies to your own circumstances, you can reach out for a one-to-one consultation here.
And if you simply have a question or want to share a thought, feel free to write to us at stories@stackedhomes.com — we read every message.
Frequently asked questions
How does the announcement of a new MRT line affect nearby property prices?
Do property prices rise more before or after a new MRT station is fully operational?
Are luxury or central developments less affected by new MRT lines?
Which areas tend to benefit most from new MRT stations in terms of property appreciation?
What happens to property prices when a new MRT line is fully operational?
Can the impact of new MRT lines on property prices be predicted accurately?
Reuben Dhanaraj
Reuben is a digital nomad gone rogue. An avid traveler, photographer and public speaker, he now resides in Singapore where he has since found a new passion in generating creative and enriching content for Stacked. Outside of work, you’ll find him either relaxing in nature or retreated to his cozy man-cave in quiet contemplation.Need help with a property decision?
Speak to our team →Read next from Property Investment Insights

Property Investment Insights We Compared Lease Decay Across HDB Towns — The Differences Are Significant

Property Investment Insights This Singapore Condo Skipped 1-Bedders And Focused On Space — Here’s What Happened 8 Years Later
Property Investment Insights Why Buyers in the Same Condo Ended Up With Very Different Results

Property Investment Insights What Happens When a “Well-Priced” Condo Hits the Resale Market
Latest Posts

Property Market Commentary We Review 7 Of The June 2026 BTO Launch Sites – Which Is The Best Option For You?

Singapore Property News The Most Expensive Resale Flat Just Sold for $1.7M in Queenstown — Is There No Limit to What Buyers Will Pay?

On The Market Here Are The Cheapest 4-Room HDB Flats Near An MRT You Can Still Buy From $450K






2 Comments
You compare prices for 2007/2008 and 2012/2013. How about in between have prices being steadily going up the next 4 years from 2008 to 2012 (alpha)