“So How Much Does It Cost To Build A HDB?” 7 Intriguing Real Estate Data That We Want To Know In Singapore
March 4, 2023

Long-time readers of Stacked will know that we love data, and the chance to observe quantifiable trends. Unfortunately, the information isn’t perfect – and in some cases, the data that was once published has now become untraceable. In this list, we compile the statistics that (if we could get a hold of them) that would paint an important and different perspective of Singapore’s housing scene. Even knowing what’s missing, however, can say a lot about the property market:
Table Of Contents
- 1. A return of Cash Over Valuation (COV) data
- 2. Number of single-income to dual-income homeowners
- 3. Statistics on the number of negative cash sales
- 4. What percentage of flat owners are Permanent Residents?
- 5. The cost of building HDB flats, from the 1960s to the present
- 6. Data on walk-up apartments
- 7. Number of Toto winners who have moved their winnings into property
Many readers write in because they're unsure what to do next, and don't know who to trust.
If this sounds familiar, we offer structured 1-to-1 consultations where we walk through your finances, goals, and market options objectively.
No obligation. Just clarity.
Learn more here.
1. A return of Cash Over Valuation (COV) data
This is probably too much to hope for, but it’s really needed in a year when resale flat prices are through the roof. Just look at the price movement from January 2020 to January 2023!
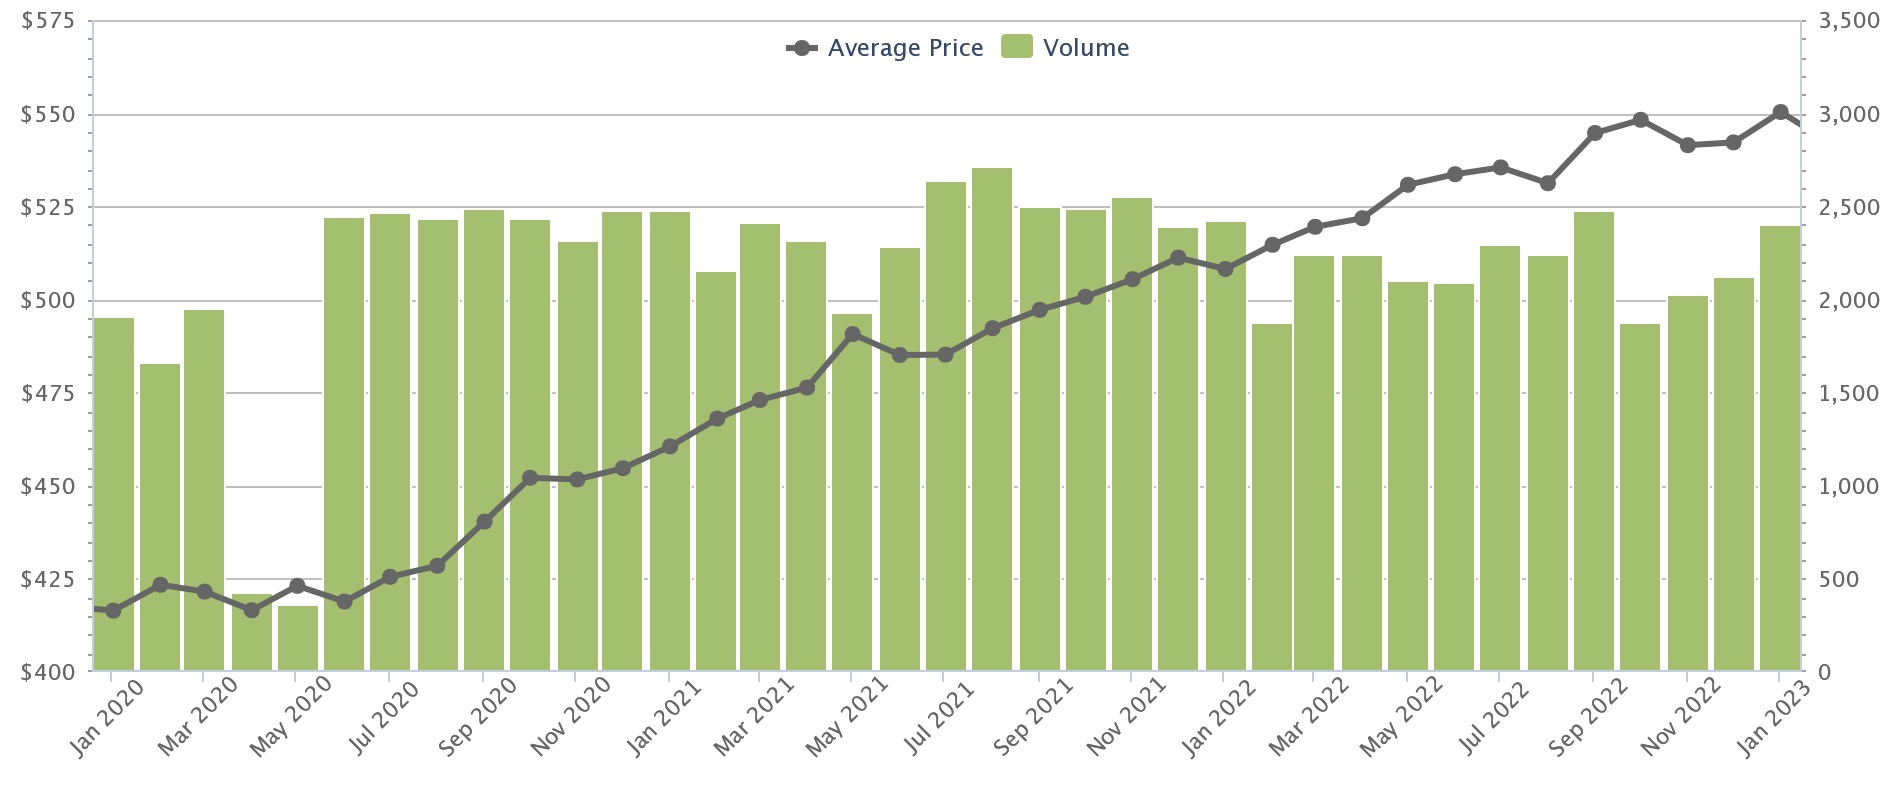
Prior to 2013, HDB would publish COV data (which was why we started a crowdsourced list). But this was stopped, to remove the expectation that all flats would be sold above valuation. Coupled with the introduction of the Mortgage Servicing Ratio (MSR), this was enough to reduce COV to near zero for around the next seven years.
Post Covid, however, it’s clear that the lack of COV data (and the MSR) is no longer sufficient to restrain prices.
Besides this, it’s important for flat buyers to have a good sense of how much cash to prepare. COV isn’t covered by the home loan, nor can it be paid by CPF – so it would relieve some buyers to at least have a ballpark figure. Right now, most buyers are dependent on the word of their realtors (which they don’t have the data to verify).
2. Number of single-income to dual-income homeowners
We’re sure this data used to be available sometime in the past, but we are unable to retrieve it now or identify when exactly it stopped being available (we also don’t know if it’s still being tracked today).
This data would be important for two reasons:
First, if we can identify when dual-income homeowners became the norm, there may be some correlation to Singapore’s falling fertility rate. It’s plausible that in the past when only one parent needed to work, factors such as childcare and the ability to spend time with children were much improved.
Second, it adds some dimension to the debate on home affordability. While current data shows that median income has (broadly speaking) kept pace with home prices, we’ve so far ignored the shift to dual-income households.
If it was possible in, say, the 1980s to 1990s for a single parent to comfortably pay the mortgage, then affordability may not be as high as we imagine: because in recent years, more families have needed two working spouses to pay for the property.
(Note: we’re not claiming this is actually the case, and this is just speculation; but our point is that, if we had the data, we could see if the theory holds).
3. Statistics on the number of negative cash sales
Negative cash sales occur when, after refunding their CPF, buyers find they have no cash left in hand from the sale proceeds. We have an article that covers this phenomenon in greater detail.
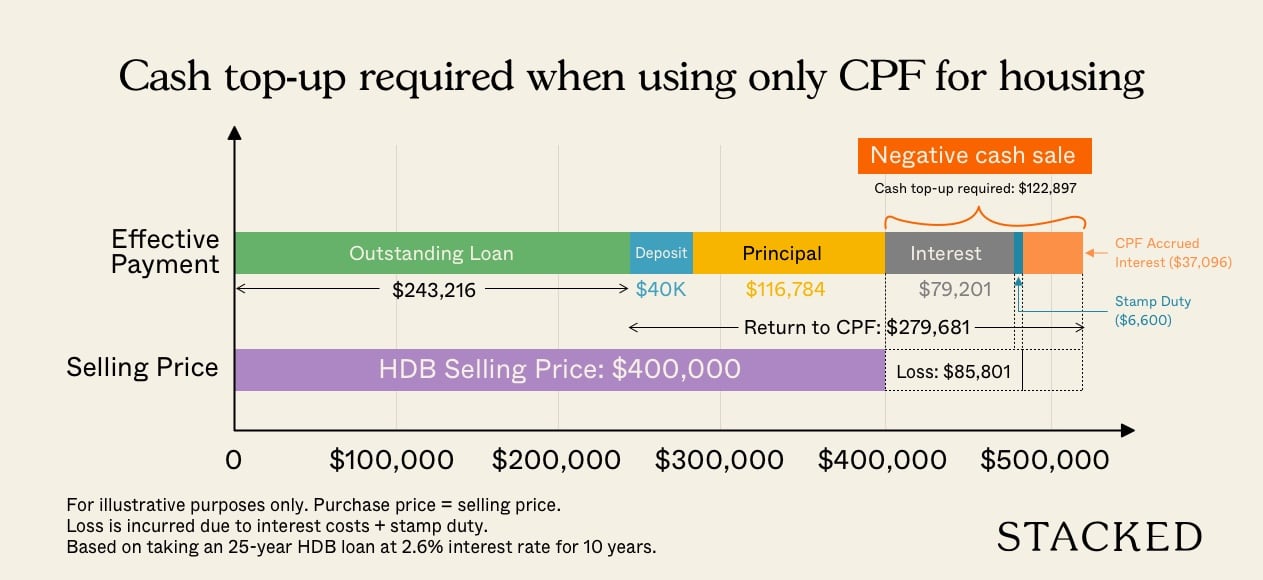
It would be useful to see data on when negative cash sales tend to happen, as right now most of the market works on assumptions. It’s hypothesised, for instance, that negative cash sales will be less common in boom markets, as the sale prices are going up. However, this ignores other factors such as how much of their CPF the typical buyer uses.
We could also identify if negative cash sales are more or less likely based on the age of a resale flat, or if certain flat types are more likely to result in a negative cash sale. This information would be useful for the long-term planning of flat buyers, especially those who aspire to upgrade.
More from Stacked
I’m 32 With A Budget Of $950k: Which Of These 2-Bedroom Condos In Tampines Is Best As A Rental Investment?
Dear stacked homes,
4. What percentage of flat owners are Permanent Residents?
This is politically sensitive, so we doubt it will ever happen – but our interest isn’t in debates over whether locals are being secretly replaced.
There are useful elements that could arise from this data. For example, families that consist of just PRs cannot buy BTO flats – they can only buy resale flats if they meet the requirements (e.g., they must have PR status and have lived in Singapore for at least three years, and so forth).
This is important because, regardless of how many BTO flats we build, we cannot alleviate demand for resale flats amongst this demographic. They have to buy resale – and this would mean rising numbers of purely PR families could put upward pressure on the prices of flats.
5. The cost of building HDB flats, from the 1960s to the present
Another politically charged issue, so we doubt we’ll ever see this. However, it would be fascinating to see how much more – or less – efficient the HDB construction process has become, based on costs.
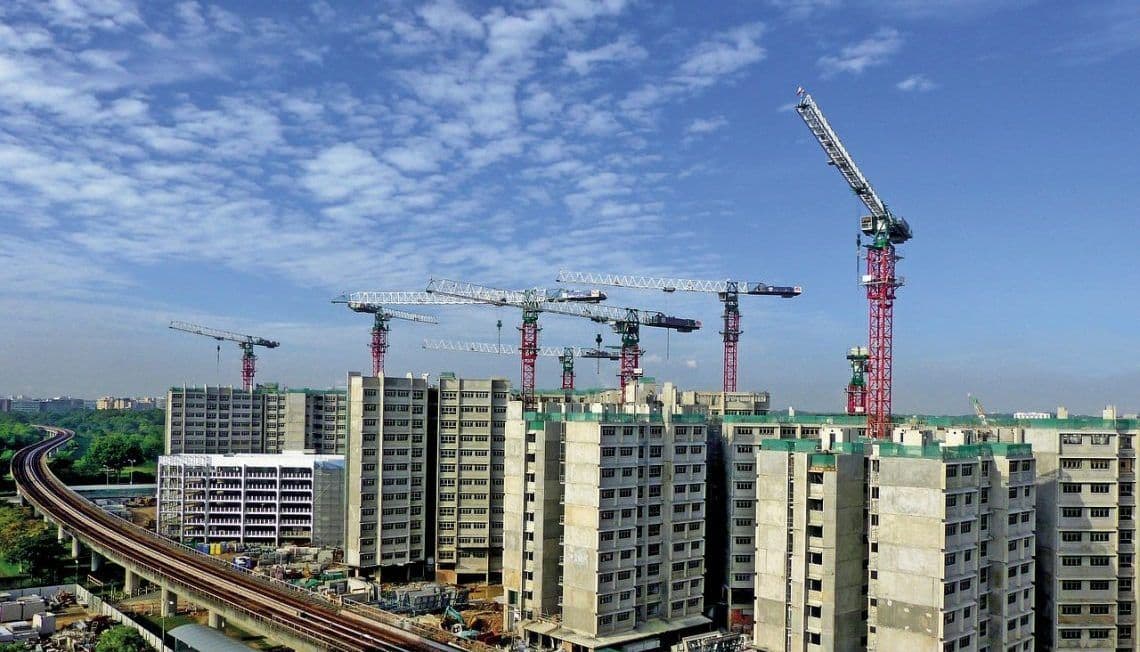
It would also put to rest the debates and speculation about whether or not HDB makes any profit (we doubt that as land cost seems to be the main bugbear, but knowing the other figures can put other rumours to rest). We could also compare any margins to what private developers currently make, as proof that sale profits are not HDB’s main motivation.
Most interesting of all, the data could help us to speculate on prices of upcoming BTO projects, based on the cost to HDB; especially in Prime Location Housing (PLH) zones.
6. Data on walk-up apartments
There’s not much to say here, other than walk-up apartments are popular, and old, but poorly documented. Transactions are few, floor plans tend to be non-existent, and sometimes we don’t even know the developer’s name.
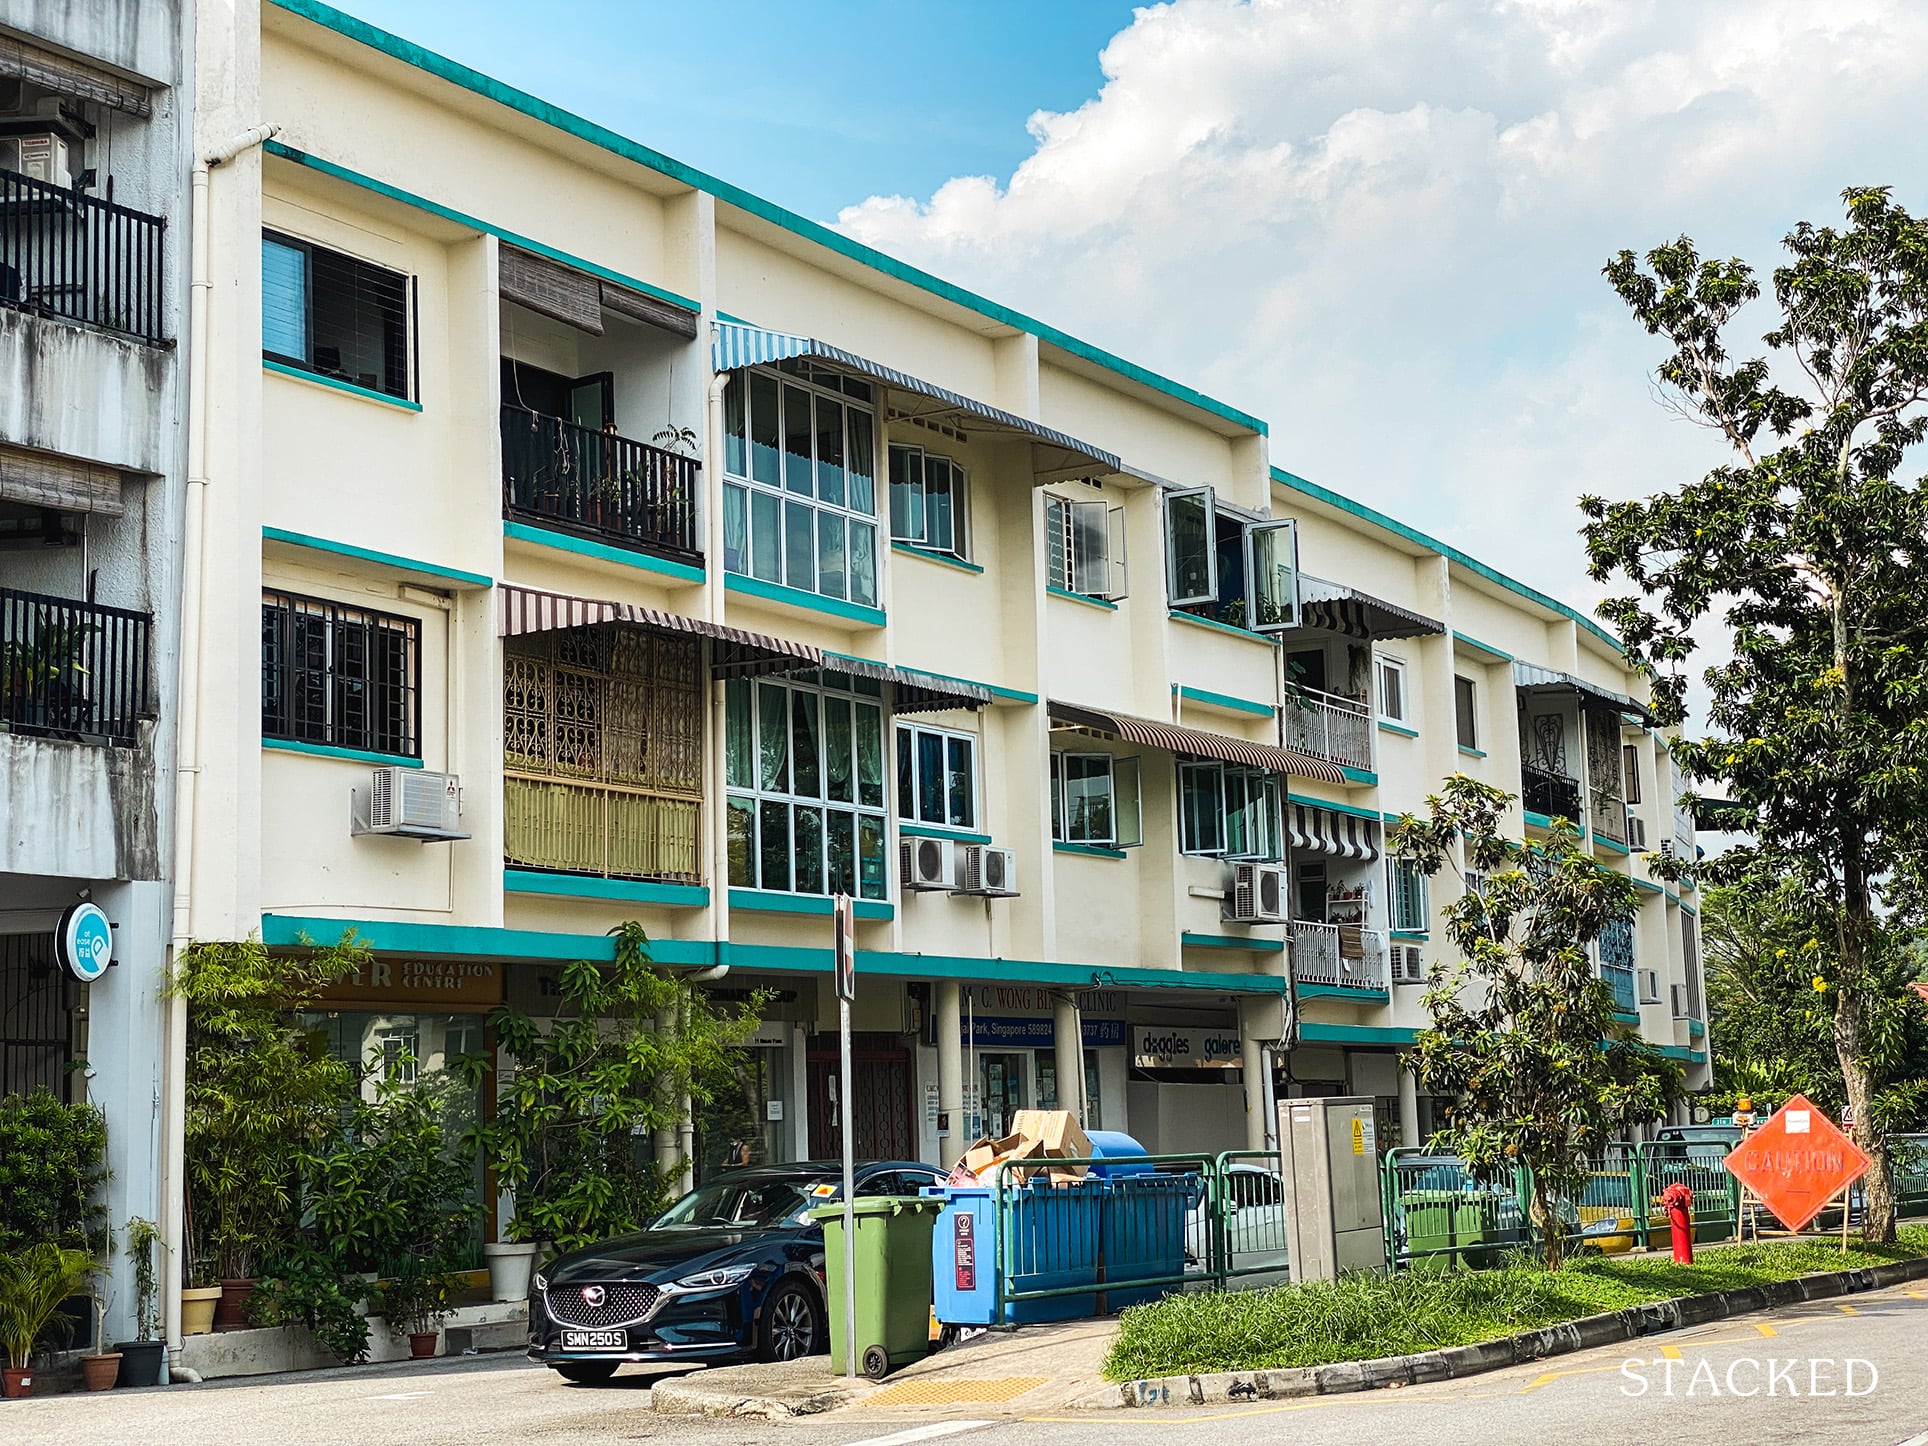
While we receive many queries about walk-up apartments – from price to maintenance to overall appreciation – we’re generally unable to answer these; and you’ll find even larger property firms often don’t have the answers.
We’d welcome a serious data-gathering effort on these old but popular properties, but the effort may sadly cost more than it’s worth.
7. Number of Toto winners who have moved their winnings into property
Now, this is probably a bit of a cheeky one, but after doing the piece on what I would do with a $12 million Toto windfall, it would be fascinating to find out the percentage of Toto winners each week who have ended up using most of the cash on a property.

Singaporeans are a pragmatic bunch, and my personal speculation is that most would have ended up investing in a safe asset (and since the private property has always been an aspiration for many anyway).
While this data isn’t going to be useful in any sense, it would just be interesting to know just how safe Singaporeans are with their lottery winnings (unlike what you might see in the US, for example).
If you could be given any kind of data on the Singapore property market, what would you be most interested in seeing? Comment below and let us know – if you’re lucky, we may even have what you’re looking for. In the meantime, follow us on Stacked for news and updates, and the latest happenings in Singapore’s real estate scene.
At Stacked, we like to look beyond the headlines and surface-level numbers, and focus on how things play out in the real world.
If you’d like to discuss how this applies to your own circumstances, you can reach out for a one-to-one consultation here.
And if you simply have a question or want to share a thought, feel free to write to us at stories@stackedhomes.com — we read every message.
Frequently asked questions
What is Cash Over Valuation (COV) and why is it important for flat buyers?
Why is data on the number of single-income versus dual-income homeowners significant?
How could statistics on negative cash sales inform property buyers?
Why would knowing the percentage of Permanent Residents (PRs) owning flats matter?
What insights could be gained from knowing the cost of building HDB flats over time?
What challenges exist in gathering data on walk-up apartments?
Ryan J. Ong
A seasoned content strategist with over 17 years in the real estate and financial journalism sectors, Ryan has built a reputation for transforming complex industry jargon into accessible knowledge. With a track record of writing and editing for leading financial platforms and publications, Ryan's expertise has been recognised across various media outlets. His role as a former content editor for 99.co and a co-host for CNA 938's Open House programme underscores his commitment to providing valuable insights into the property market.Need help with a property decision?
Speak to our team →Read next from Property Market Commentary

Property Market Commentary How I’d Invest $12 Million On Property If I Won The 2026 Toto Hongbao Draw

Property Market Commentary We Review 7 Of The June 2026 BTO Launch Sites – Which Is The Best Option For You?

Property Market Commentary Why Some Old HDB Flats Hold Value Longer Than Others

Property Market Commentary We Analysed HDB Price Growth — Here’s When Lease Decay Actually Hits (By Estate)
Latest Posts

Singapore Property News Why Some Singaporean Parents Are Considering Selling Their Flats — For Their Children’s Sake

Pro River Modern Starts From $1.548M For A Two-Bedder — How Its Pricing Compares In River Valley

New Launch Condo Reviews River Modern Condo Review: A River-facing New Launch with Direct Access to Great World MRT Station












1 Comments
Thank you for the article and a good read. Just thought that I should also mention that other than making estimates, buyer agents might also be able to have fairly accurate COV data sometimes, as there is a database that agents may opt to share and jointly contribute to.