It’s been nearly a year since we last wrote our article on the 13 condos with the most unprofitable transactions.
How time flies.
I’ve previously gone into further detail with why Stellar RV and The Tennery performed the way they did, and this time, I decided to change things up a little to set my sights on the East instead.
There were 3 that Ryan highlighted in the above article, Urban Vista, Parc Bleu, and The Sound.
In today’s piece, I’ll be starting with Urban Vista.
Table Of Contents
Urban Vista Background Information
Here’s some background information to know:
Location: Tanah Merah Kechil Link (District 16)
Developer: Bayfront Realty Pte. Ltd.
Lease: 99-years from 2012
Completion: 2016
Number of units: 582 units
Profitable transactions: 19
Unprofitable transactions: 61
The average profit so far has been $34,936, while the average loss is -$78,918.
Like The Tennery (actually, Urban Vista is worse), the majority of its profitable transactions are only profitable from a gross perspective.
If you were to account for agent and lawyer fees, about half of the transactions here would actually be loss-making.
As of today, the average price is around $1,382 psf.
This is a drop from its average launch price of about $1,500 in March/April 2013.
And if you were to compare the average prices of the area during the same time period, it was the highest-priced new launch over March/April 2013 in District 16.
But curiously unlike The Tennery and Stellar RV, the pricing at Urban Vista was actually rather reasonable if you were to compare it to its immediate neighbours.
First, let’s see how much Urban Vista was going for during its launch.
| Urban Vista (launched March 2013) | |
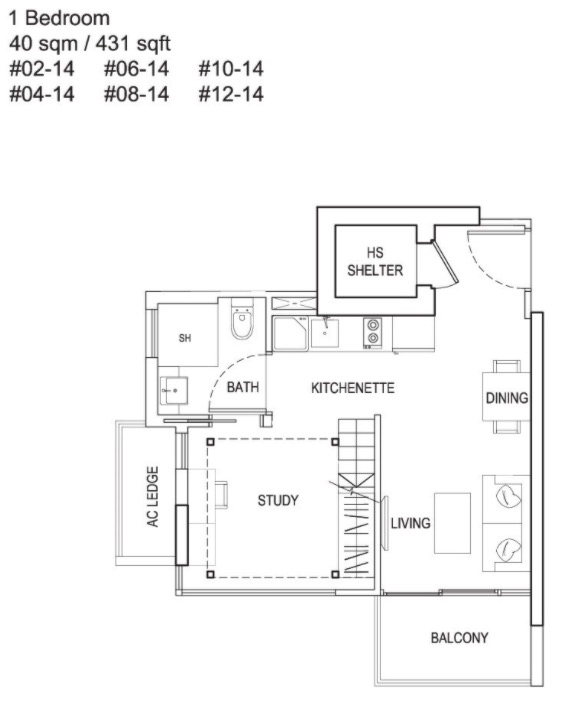
| 1 bedder | Starts from $588k (431 sqft) |
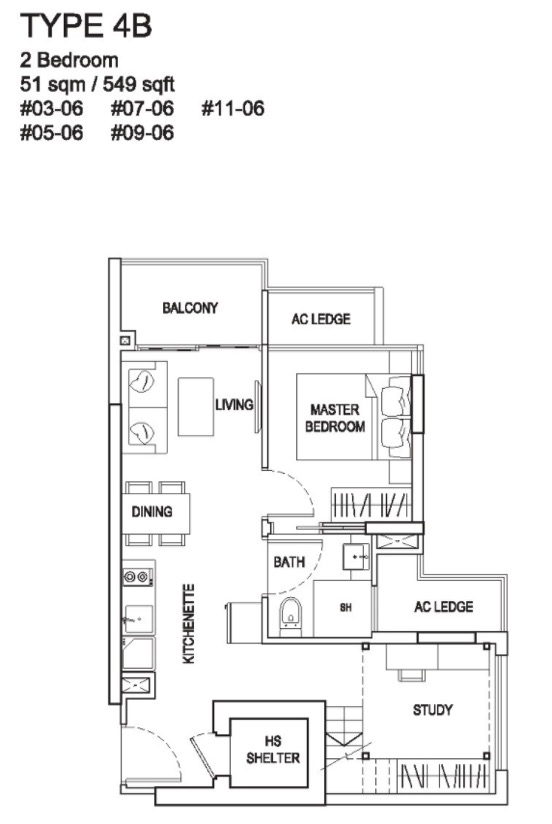
| 2 bedder | Starts from $768k (549 sqft, 2 bed 1 bath) Starts from $1.032m (689 sqft, 2bed 2 bath Dual-Key) |
| 3 bedder | Starts from $1.108m (786 sqft) |
It actually sold a big bulk of its 582 units in the first two months of its launch in 2013, moving 347 units which represent nearly 60% – at an average of $1,494 psf.
Now let’s look at the new launch comparisons nearby at the time of launch.
eCO @ Bedok South was launched back in September 2012, with a similar unit mix of smaller 1 and 2 bedroom units.
At the same period, Urban Vista was launched, eCO had already sold 586 units out of its 748 units, so the actual units left to compare with is quite small.
Comparing units of the same size, the average psf that Urban Vista was selling at was $1,471 versus $1,399 – a marginal increase of around 5%.
Here’s what it looked like comparing the subsequent years:
| eCO | URBAN VISTA | ||
| Year | Average psf | Average psf | Psf Comparison |
| 24 Mar – End 2013 | $1,405.34 | $1,486.65 | 5.79% |
| 2014 | $1,339.55 | $1,202.55 | -10.23% |
| 2015 | $1,281.00 | $1,452.00 | 13.35% |
| 2016 | $924.13 | – | – |
| 2017 | $1,273.67 | $1,432.00 | 12.43% |
| 2018 | $1,367.93 | $1,433.58 | 4.80% |
| 2019 | $1,353.10 | $1,405.89 | 3.90% |
| 2020 | $1,256.27 | $1,281.82 | 2.03% |
| 2021 | $1,321.14 | $1,374.03 | 4.00% |
| 2022 | $1,317.33 | $1,283.33 | -2.58% |
Prices at Urban Vista actually fell in 2014 as the developer probably looked to clear the remaining units at a lower psf.
While 2015 looked to have the biggest premium in prices, this was due to eCO also clearing their remaining units at a lower psf, and only one registered a new sale in 2015 at Urban Vista, at $1,452 psf for a 689 sq ft unit – which isn’t really an equitable comparison.
In short, the price premium over the years for Urban Vista as compared to its new launch competitor isn’t really overpriced.
Let’s look at another to compare, The Glades.
It was launched later in the year in September 2013, with a total of 726 units.
| THE GLADES | URBAN VISTA | ||
| Year | Average psf | Average psf | Psf Comparison |
| 24 Mar – End 2013 | $1,476.14 | $1,486.65 | 0.71% |
| 2014 | $1,457.28 | $1,202.55 | -17.48% |
| 2015 | $1,427.02 | $1,452.00 | 1.75% |
| 2016 | $1,409.22 | – | – |
| 2017 | $1,449.91 | $1,432.00 | -1.24% |
| 2018 | $1,421.86 | $1,433.58 | 0.82% |
| 2019 | $1,481.25 | $1,405.89 | -5.09% |
| 2020 | $1,433.15 | $1,281.82 | -10.56% |
| 2021 | $1,463.43 | $1,374.03 | -6.11% |
| 2022 | $1,359.00 | $1,283.33 | -5.57% |
Likewise, the prices were actually pretty reasonable, with just a slight premium recorded for The Glades as it is marginally newer as well.
So unlike The Tennery, Urban Vista was actually priced competitively with its two new launch neighbours.
Now how about its resale competition?
During its launch, it had 4 resale condos in its immediate vicinity, Casa Merah, East Meadows, Optima @ Tanah Merah, and The Tanamera.
Here’s how they matched up:
| CASA MERAH | EAST MEADOWS | OPTIMA @ TANAH MERAH | THE TANAMERA | |||||
| Year | Average psf | PSF Comparison | Average psf | PSF Comparison | Average psf | PSF Comparison | Average psf | PSF Comparison |
| 24 Mar – End 2013 | $1,204.57 | 23.42% | $997.10 | 49.10% | $1,160.00 | 28.16% | $905.83 | 64.12% |
| 2014 | $1,126.31 | 6.77% | $964.25 | 24.71% | $1,119.80 | 7.39% | $889.50 | 35.19% |
| 2015 | $1,096.55 | 32.42% | $928.11 | 56.45% | $1,264.57 | 14.82% | $887.00 | 63.70% |
| 2016 | $1,033.65 | – | $908.91 | – | $1,064.80 | – | $841.67 | – |
| 2017 | $1,029.79 | 39.06% | $880.23 | 62.69% | $1,175.92 | 21.78% | $850.92 | 68.29% |
| 2018 | $1,140.32 | 25.72% | $944.96 | 51.71% | $1,191.88 | 20.28% | $909.00 | 57.71% |
| 2019 | $1,101.00 | 27.69% | $923.83 | 52.18% | $1,167.38 | 20.43% | $901.67 | 55.92% |
| 2020 | $1,088.93 | 17.71% | $928.71 | 38.02% | $1,160.70 | 10.43% | $875.00 | 46.49% |
| 2021 | $1,150.89 | 19.39% | $990.87 | 38.67% | $1,241.46 | 10.68% | $922.60 | 48.93% |
| 2022 | $1,166.67 | 10.00% | $978.50 | 31.15% | – | – | – | – |
During the same period in 2013, the premium that Urban Vista was asking over its resale competitors was significant for the older developments East Meadows (2001) and The Tanamera (1994). This was at an increase of 49% and 64% respectively, which is high no doubt.
But because Urban Vista was trading at a PSF level that was relatively comparable to its new launch competitors eCO and The Glades, it’s hard to conclude that pricing was a big contributing issue to its subsequent resale performance.
The price premium was less for its neighbours that were closer in age. For Casa Merah (2009) and Optima @ Tanah Merah (2012), this was at a premium of 23% and 28% respectively.
Since we can’t pinpoint anything conclusively from the comparisons above, let’s dig a little deeper into the quantum prices of its 1 bedroom units as compared to its new launch competitors.
Given that a big proportion of the losses at Urban Vista are the smaller units, I had to separate that data out from the rest.
It was tough work as each development had many different sizes for its 1 bedroom units, and compiling the average prices took some time.
Here’s how it looked in 2013:
| Project | Quantum | Difference |
| Urban Vista | $784,054.18 | – |
| eCO | $901,314.44 | 15.0% |
| The Glades | $750,142.80 | -4.30% |
While eCO’s average quantum was higher (it was more than 80% sold at that point), Urban Vista was overall slightly higher than The Glades which launched in Q3 of 2013.
Not much really in it, is there?
As such, despite the higher price overall, it’s just not high enough to point out its pricing as a real cause for concern.
Now that we’ve got the pricing out of the way, let’s take a look at some of the reasons why Urban Vista has performed the way it has so far.
1. Compact unit size
More from Stacked
Springleaf Residence Launches From $878K — Is This 941-Unit Mega Development Worth It?
If Springleaf Prata is the first thing that comes to mind when you think of Springleaf, you’re not completely wrong.…
In some instances, having compact unit sizes works.
This would typically be in the central regions where sizes are expected to be smaller, and quantum can be lowered to attract investors.
While there could be a case to be made for investor-led units for rental in this part of the East as it’s near the airport, perhaps this area where it’s closer to Bedok is still more commonly seen for family own-stay than anything else.
And so if we were to look from that context, the sizes here are possibly not as ideal.
For example, the 3 bedder units here that most families would look for come in at only 786 – 850 sq ft (Non-PES unit). For context, these are usually the sizes of larger 2 bedroom units in today’s new launches. As a matter of fact, for compact 3 bedroom units, you’d usually expect a size of around 900 sq ft.
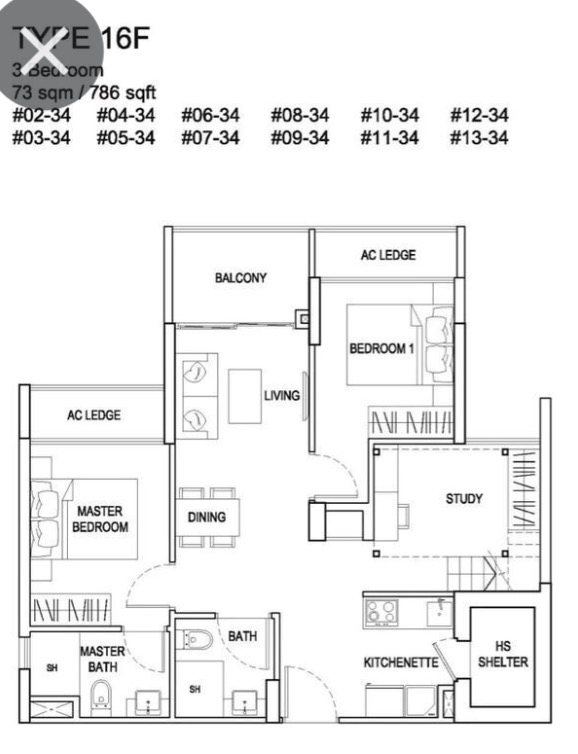
3 bedroom 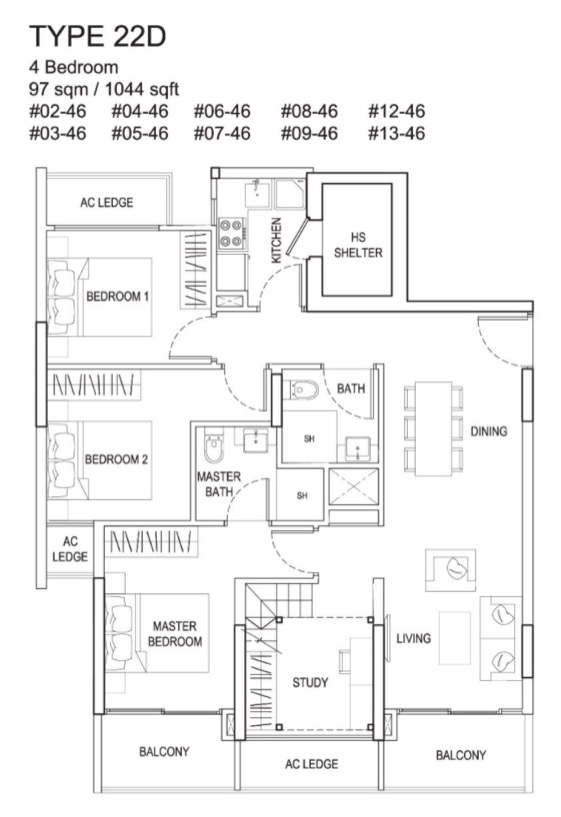
4 bedroom
Likewise, the 4 bedders here are at only 1,044 sq ft which is typically similar in size to a 3 bedroom premium in today’s new launch context. Worst of all, it comes with 3 AC ledges, a home shelter, and 2 balconies. When space is already at a premium, these can make the space look even smaller than it is.
This leads me to my next point.
2. Less ideal SOHO units
During that era, SOHO/LOFT unit types were a popular offering for new launch units (just like The Tennery). There’s no question that it is aesthetically pleasing, but it suffers from a few issues.
One, if it’s only a little above 3 metres in height, it’s really more of a high ceiling that looks good than it is a truly usable space. So it’s a neither here nor there type of scenario that doesn’t serve much purpose in an already small unit. If you can stand up straight on the platform, it’d probably become a white elephant in no time at all.
If you want the advantage of a loft unit, it should be minimally 4 metres and up such that a mezzanine would come in handy. And unless you are freakishly tall, this should suffice for most Singaporeans.
Two, it’s usually more trouble than it’s worth. Whether you have to climb up to a bed, or to get to additional storage, most people realise after a while that it can be a nuisance day to day. So while it may have looked really alluring in the show flat (high ceilings and all), the reality is that most buyers have become wary of it.
3. Timing issue
It’s probably been well documented by now that 2013 was one of the peaks of the property cycle.
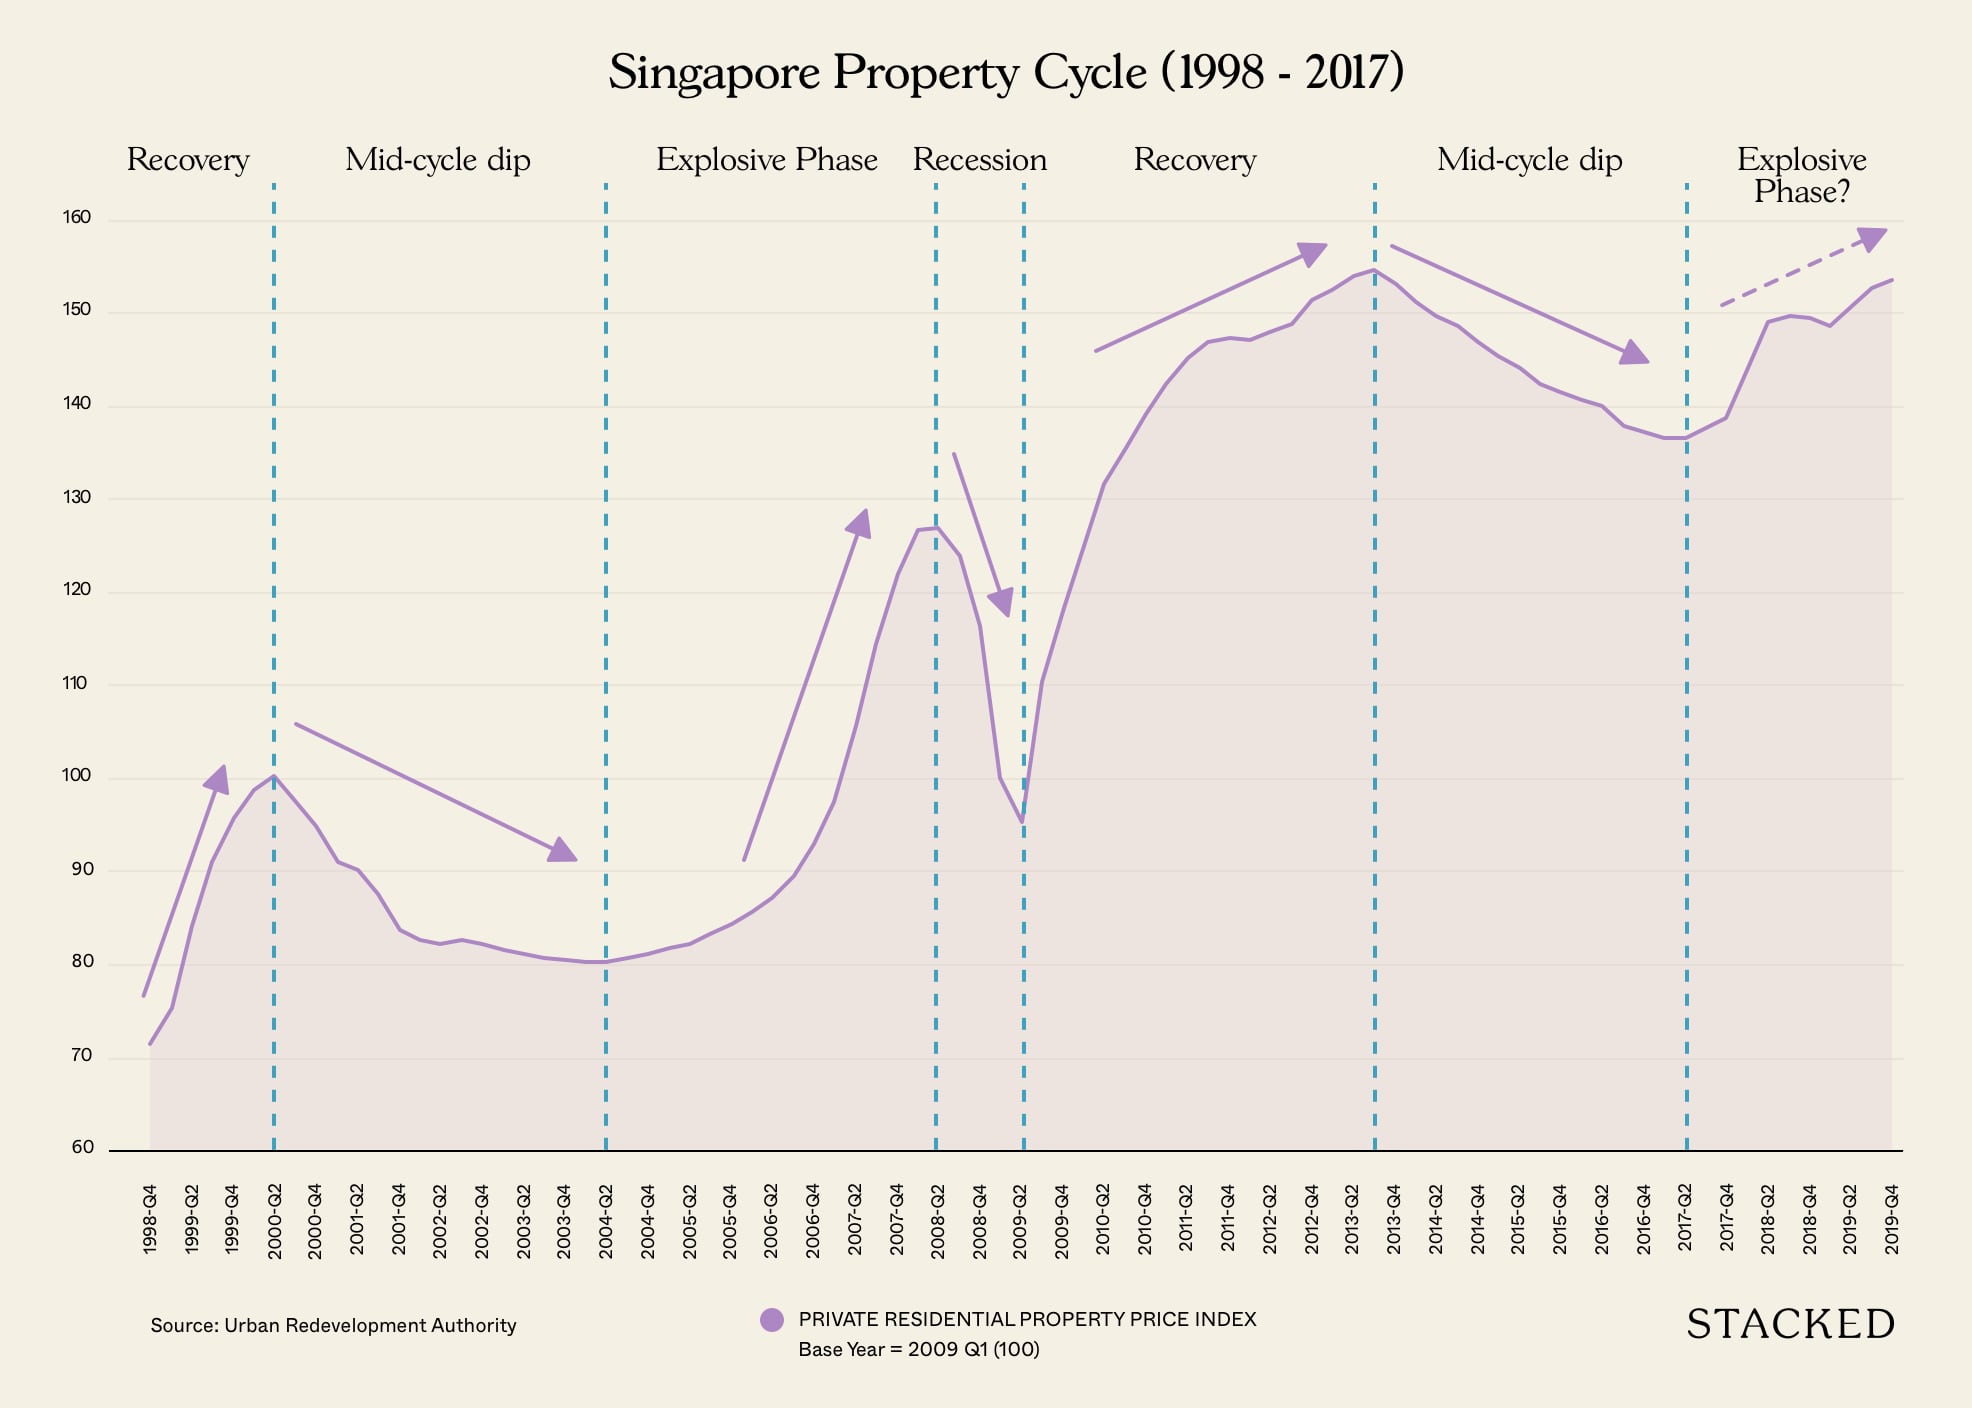
While that doesn’t necessarily mean that everyone who buys at a peak will lose money, it’s always more about choosing the right property than it is about timing the market.
There’s not much more to say here, so let’s move on to the next point.
4. Liveability and realities
One of the major plus points of Urban Vista is its convenient location right next to Tanah Merah MRT station.
But what is a strength, can also be deemed as a weakness.
In 2014 it was announced that there would be a major upgrade to the Tanah Merah MRT station, with works slated to start in 2016 (just before Urban Vista was completed).
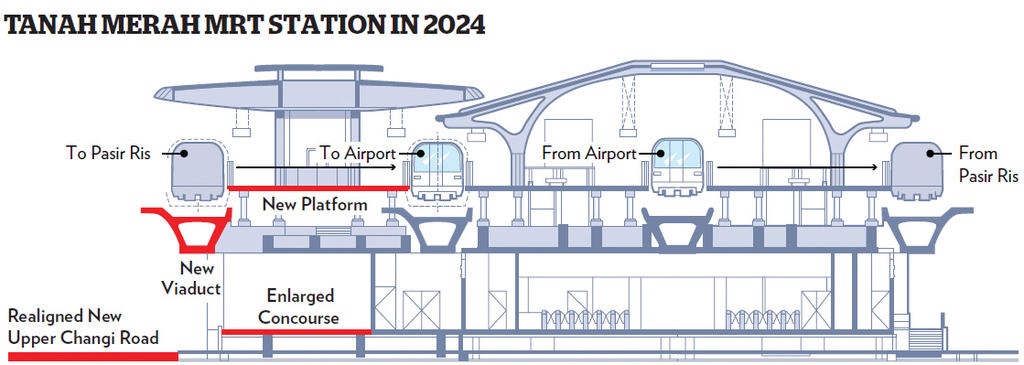
Commuters heading towards Changi Airport and Expo MRT stations can enjoy faster travel come 2024, with the addition of a new platform at Tanah Merah MRT station.
There was a ton of work planned, here’s an excerpt I took from TODAY:
The platform will allow for the construction of an additional train track, so that trains moving in various directions from the station will have dedicated tracks, reducing the waiting times that have long frustrated commuters who travel along that stretch.
I’ve also heard of multiple complaints that the noise from the MRT is particularly bad considering how close it is.
Plus given New Upper Changi Road is a pretty long stretch without much interference from traffic lights, there is a tendency for motorists to speed here, contributing to the road noise.
The combination of these factors has led to reports of potential tenants and buyers being scared off by the commotions going on the outside.
To be fair, it’s not as if these will be going on forever, as the works are planned to be completed in 2024. So there will be some respite and a future upside.
That said, it’s not just the issues on the outside, but problems on the inside as well.
A search on Google reviews reveals problems with the management at Urban Vista.
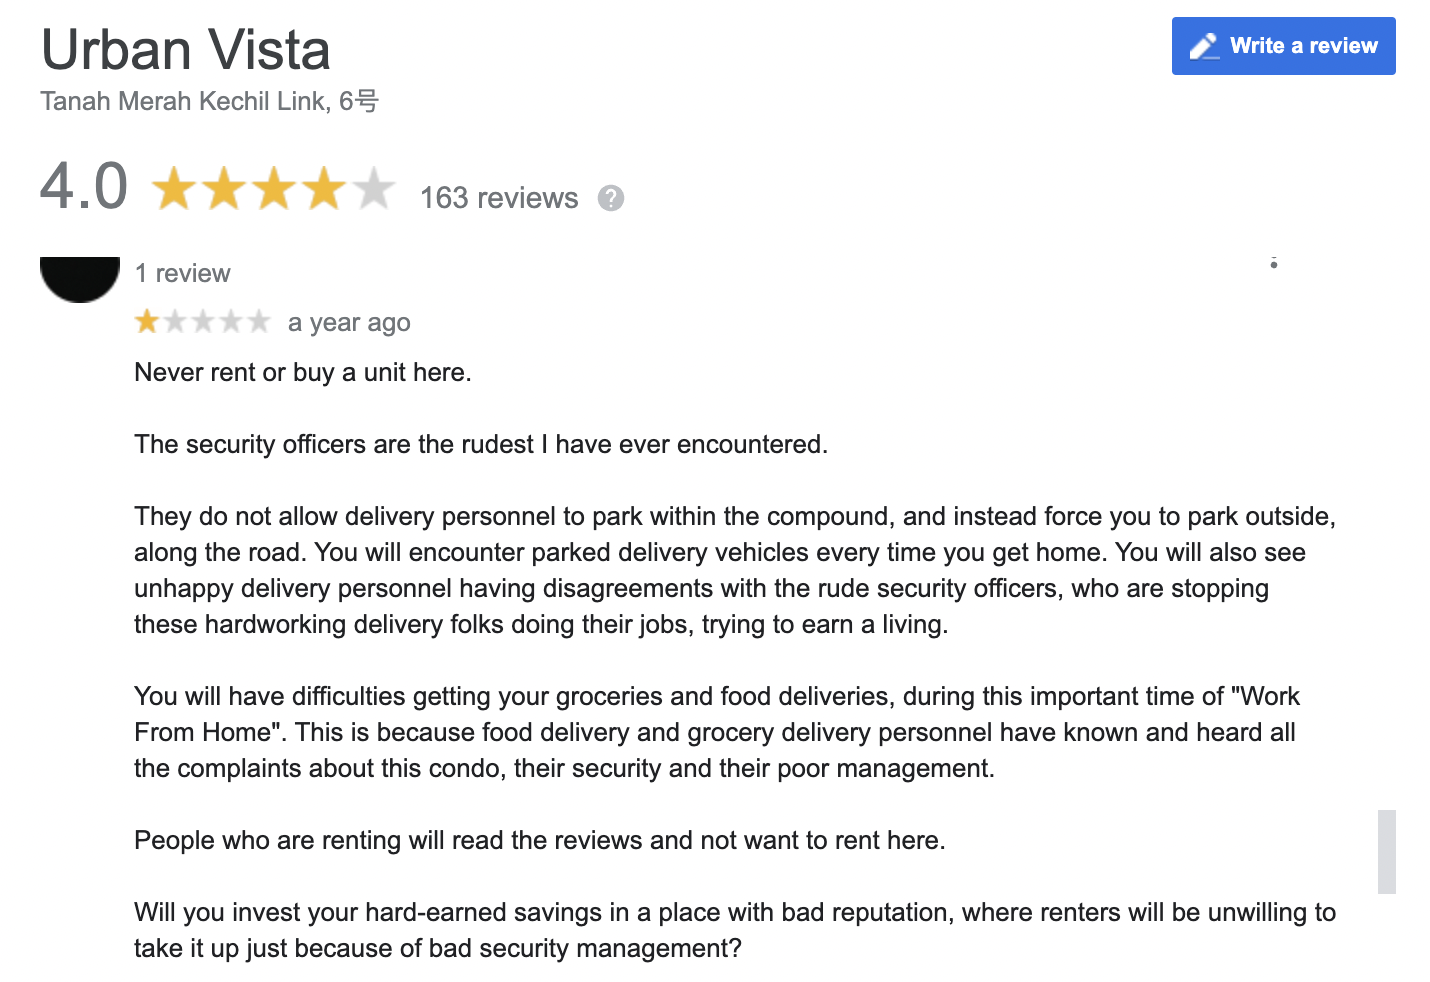
From unfair clamping of visitor cars to not allowing delivery personnel to park within the estate. Especially since deliveries are such a big part of many people’s lifestyles today, this inconvenience has resulted in arguments with delivery drivers and the security guards at Urban Vista.
Apparently, according to recent reviews, the management has changed and the situation is better now. But that surely would have a negative effect on potential buyers and tenants visiting Urban Vista in those couple of years.
5. Rental play
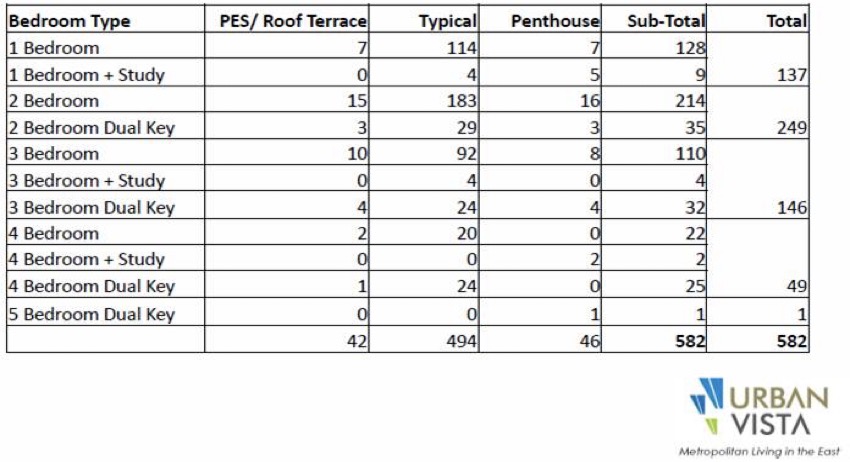
As I mentioned earlier, the unit mix at Urban Vista shows that it is geared more towards a rental project than it is for family living.
66% of its units are 1 and 2 bedroom units, they are compact, and the presence of dual key units points further conclusively in that direction.
Generally, projects that are positioned towards rental will have lesser staying power as investors who have made their money from rent are more inclined to let go of the property at a loss if they have identified better opportunities elsewhere.
Rental rates and yields, in general, haven’t been fantastic to speak of either:
Rental returns for 1 bedder
| Project | 1 bedroom size | 2013 Quantum | 2016 | 2017 | 2018 | 2019 | 2020 | 2021 |
| Urban Vista | 431 sqft | $663,656 | $1,815 | $1,793 | $1,758 | $1,784 | $1,784 | $1,827 |
| ECO | 549 sqft | $769,921 | – | $1,943 | $1,993 | $1,987 | $1,998 | $2,114 |
| Optima @ Tanah merah | 484 sqft | $790,000 | $2,527 | $2,246 | $2,246 | $2,265 | $2,236 | $2,246 |
6. The addition of Grandeur Park Residences
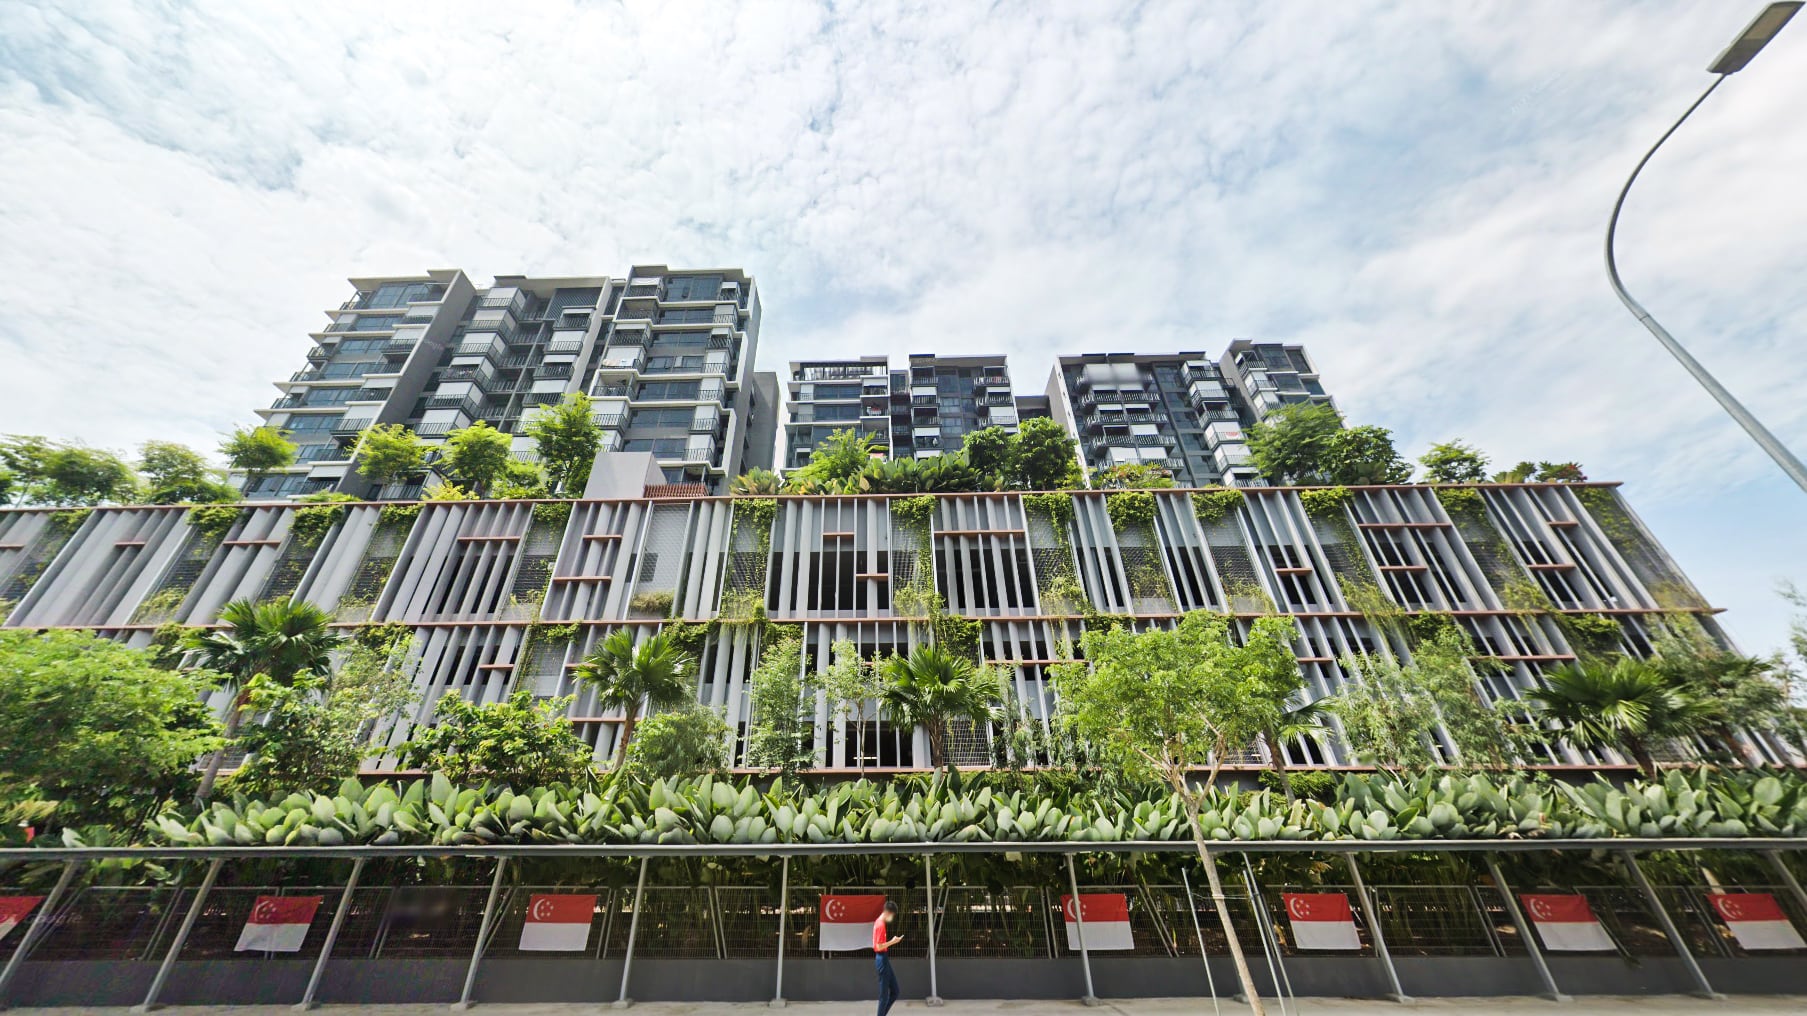
Grandeur Park Residences is the latest entrant to this part of town.
It’s a 99-year leasehold that is directly opposite of Urban Vista.
It was launched in 2017, with a total of 720 units and was just recently completed in 2021.
So far, it’s had a stellar run in the resale market, with 55 profitable transactions so far, and 0 unprofitable ones.
Just off a cursory glance, there’s a number of factors that puts it in a better position over Urban Vista:
- Directly opposite Bedok View Secondary School (plus facing the open field and not school blocks).
- It has a tennis court.
- Road facing units are set further back away from the road as compared to Urban Vista.
- The other side faces the landed enclave (and part of eCO).
- It faces a open forested area on the other side.
But here’s the best part, Grandeur Park Residences had an average PSF sale of $1,389 in their first year of launch in 2017.
| Year | Urban Vista | Grandeur Park Residences | PSF Comparison |
| 2017 | $1,432.00 | $1,389.31 | 3.07% |
| 2018 | $1,433.58 | $1,544.98 | -7.21% |
| 2019 | $1,405.89 | $1,535.00 | -8.41% |
| 2020 | $1,281.82 | $1,513.78 | -15.32% |
| 2021 | $1,374.03 | $1,588.49 | -13.50% |
| 2022 | $1,283.33 | $1,651.50 | -22.29% |
As compared to Urban Vista (which was at that time already 4 years older) which had a very slightly higher PSF price of $1,432.
Admittedly there was only one transaction in 2017 for Urban Vista so it may not be a very fair comparison, but it’s worth noting that Grandeur Park Residences at that time was very well priced against its opposite neighbour – the prices were better than what Urban Vista was priced at in 2013.
Final Words
All that said, there are still things to look up to as a whole in this area.
Once the expansion of the MRT platform is done in 2024, the traffic noise should ease and connectivity to the area would improve.
You do have a lot of malls just a short train ride away, and fingers crossed that travel will return with a bang to Singapore by then (a revitalised Changi is good news for this area).
There is also the mixed-use site next to Urban Vista that drew 15 bids, with the eventual winner MCC Land landing the plot at $248.99 million or a land rate of about $930 per square foot per plot ratio (psf ppr).
This will add more commercial space of about 21,528 sq ft and about 265 residential units.
While you will sadly have to deal with prolonged construction noise again, there is at least further upside to the area.
For more on issues affecting property investment, or in-depth reviews of new and resale properties, follow us on Stacked. If you’re pondering the future gains of your property purchase, do reach out to us for a proper consultation.
Sean
Sean has a writing experience of 3 years and is currently with Stacked Homes focused on general property research, helping to pen articles focused on condos. In his free time, he enjoys photography and coffee tasting.Read next from Property Investment Insights
Property Investment Insights District 15 Resale vs New Launch Condos – Analysing Price Gaps for Larger Family Units
Property Investment Insights Are Singapore’s Suburban Condos Still Affordable? The Surprising Truth
Property Investment Insights New Launch vs Resale One and Two Bedders in D15: Here’s Where The Price Gaps Are The Biggest
Property Investment Insights Analysing 10 Years of District 12 Boutique Condo Transactions: Insights Into What Drives Profitability
Latest Posts
Singapore Property News How A Waterfront Development With 4,000 Homes Is Going To Reshape Singapore’s Property Market
On The Market 5 Rare HDB Flats Above 1,700 Sq Ft You Can Buy Right Now – From $850K
On The Market Rare 16,000 Sq ft Freehold Plot In D15 Hits The Market For $39M
Editor's Pick I Transformed My Two-Bedroom Unit Into A Dual-Key Layout – Here’s Why I Would Not Do It Again

Property Market Commentary Why More Families Are Choosing Two-Bedders Over Bigger Properties in 2025

Property Market Commentary What The URA Master Plan Reveals About Marina Bay’s Future (And How It Could Impact Property Values)
Editor's Pick We Toured An ‘Exclusive’ Freehold Landed Enclave In Singapore That Feels Close To Nature – And Even Has A Canal Running Through It
Singapore Property News Where Condo Prices Rose Fastest (and Slowest) in Singapore’s Outside Central Regions

Editor's Pick I Left Singapore for New York and Ended Up Launching a $450M Manhattan Project. Here’s What I Learned About Buying Property Here
On The Market 5 Cheapest Freehold 3-Bedroom Condo Units In Singapore You Can Buy This Week – Including Quiet Spot in Floraville
Editor's Pick Rare Detached Freehold Home On Singapore’s ‘Millionaire’s Row’ Up For Sale At $14m

Editor's Pick The 5 Most Common Property Questions Everyone Asks In Singapore – But No One Can Answer
Editor's Pick A 5-Room HDB In Boon Keng Just Sold For A Record $1.5m – Here’s How Much The Owners Could Have Made
Property Market Commentary 6 Upcoming New Condo Launches To Keep On Your Radar For The Rest Of 2025
Editor's Pick We Toured A Little Known Landed Enclave Where The Last Sale Fetched Under $3 Million
