10 Pandemic Property Losses That Turned Into Huge Profits Later (One Could’ve Made $2.5 Million More)
January 4, 2025
Covid was an unprecedented time, and the news was dominated by naysayers and pessimists. Beyond just pessimism, of course, there were real crises in certain market segments, which saw some people scrambling for funds. The combination of the two led to some properties sold quite far below their potential value during the epidemic.
While we admit this is easy to point out in hindsight, here are some notable warning cases for future reference:
Many readers write in because they're unsure what to do next, and don't know who to trust.
If this sounds familiar, we offer structured 1-to-1 consultations where we walk through your finances, goals, and market options objectively.
No obligation. Just clarity.
Learn more here.
How did we derive the following?
The following are properties sold during 2020, which was the height of the pandemic. First, we filtered these down to properties which sold at a gain of under $10,000 (because after you deduct costs like interest repayments, stamp duties, etc. the net profit is almost certain to be negative).
Next, we looked at prices that the same units sold for in the post-Covid environment (‘23 to ‘24), and looked at the price difference compared to what they sold for during Covid.
The results were more than a little surprising, and demonstrate the risk of urgent sales:
Losses from selling during Covid
| Project Name | Address | Size | Price bought before Covid | Pre-Covid Bought Date | Price sold during Peak Covid | Covid Sale Date | Price sold Post Covid | Sold Date After Covid | Amount Lost Out |
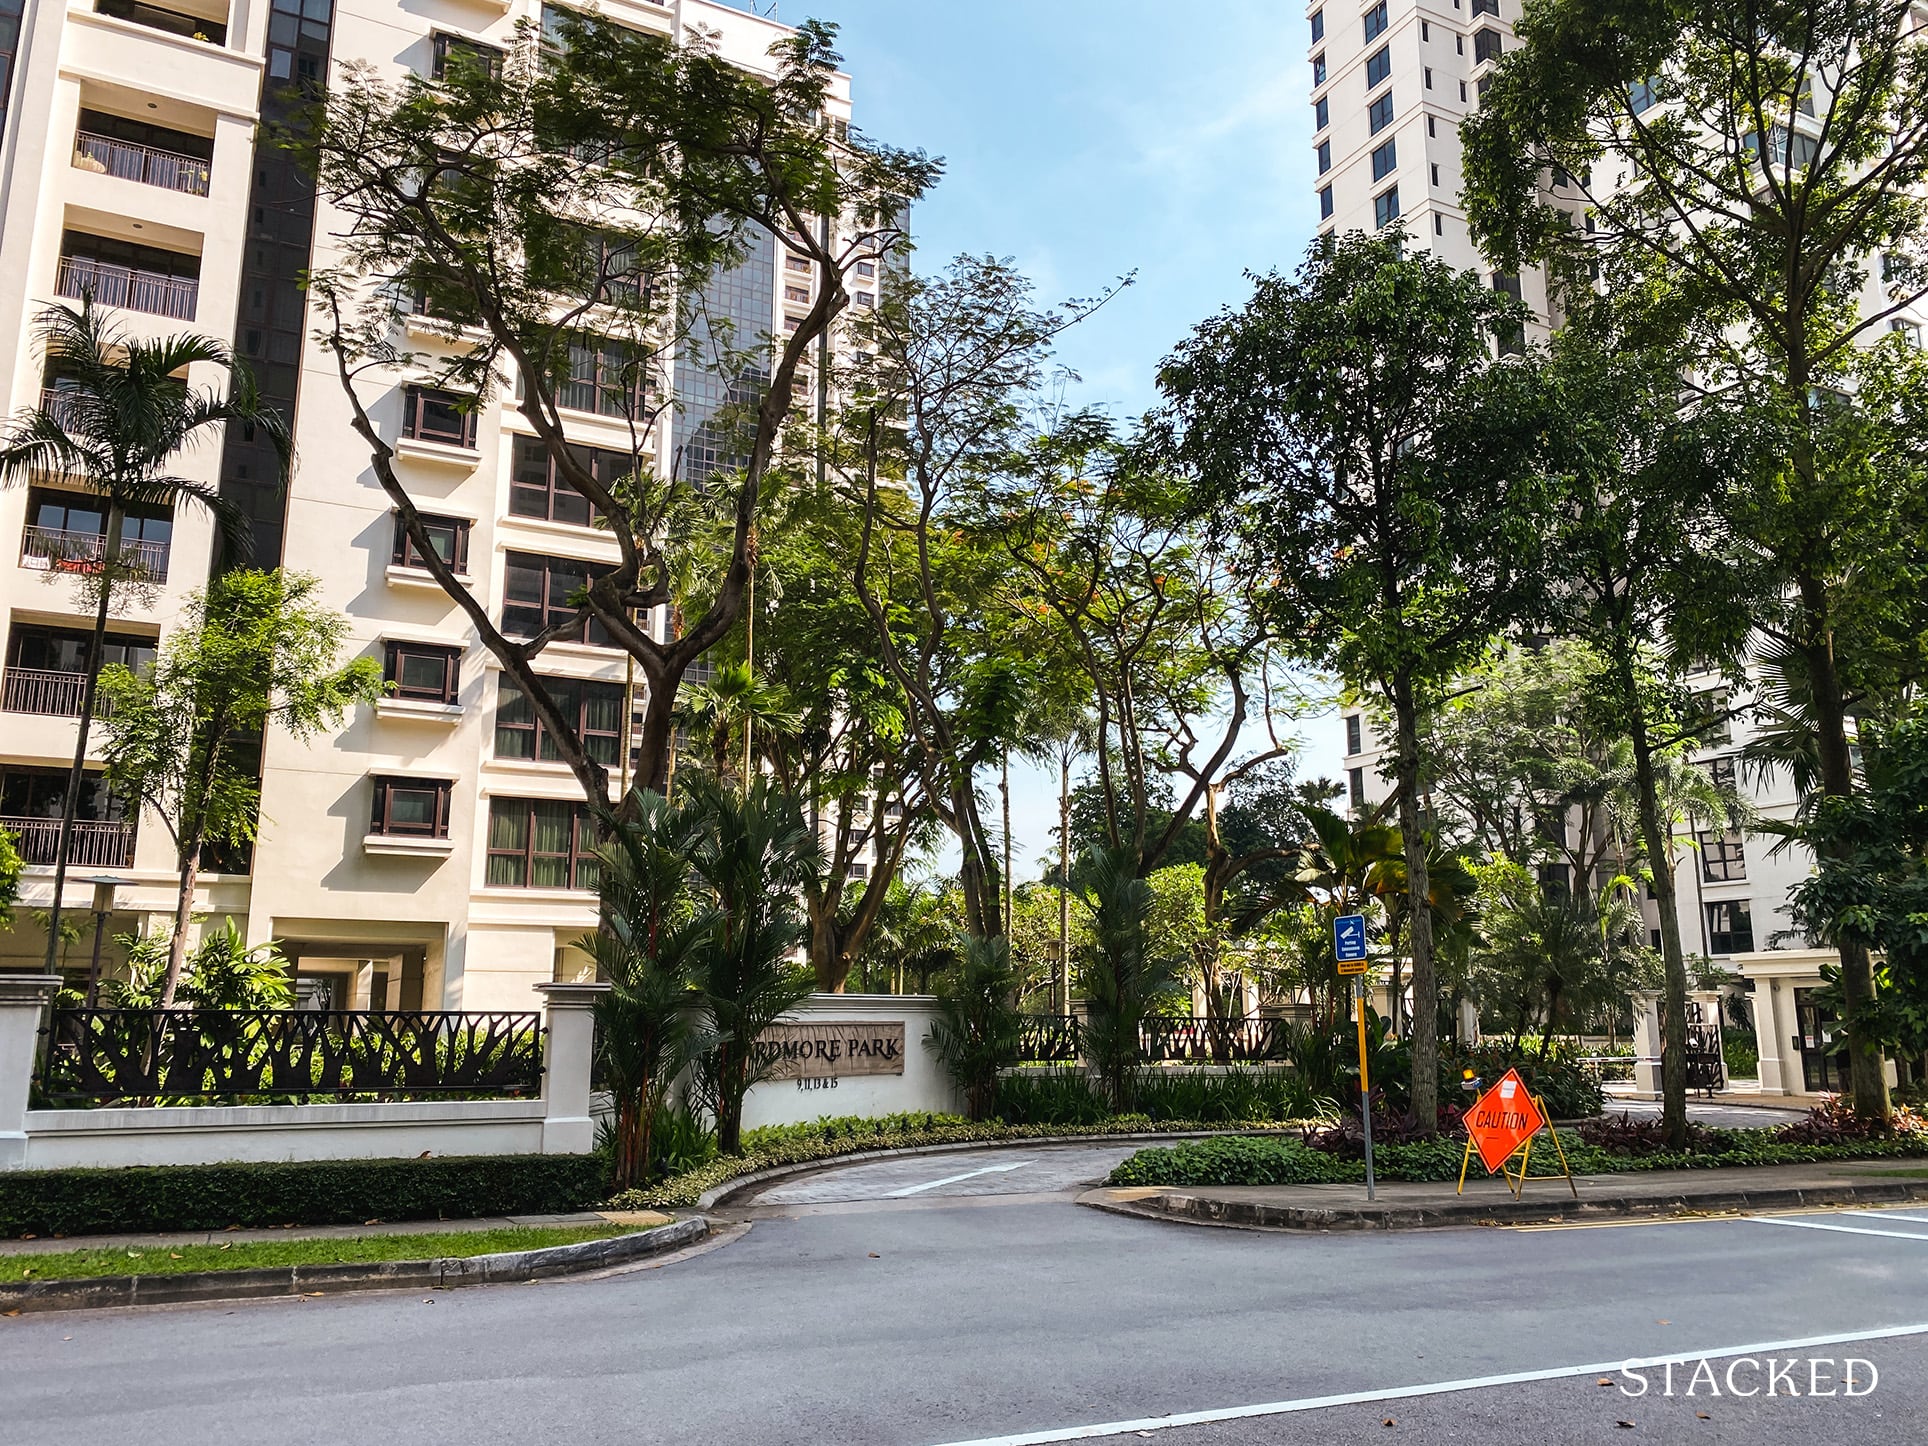
| ARDMORE PARK | 15 ARDMORE PARK #22-XX | 2,885 | $9,350,000 | 12/8/10 | $9,200,000 | 8/1/20 | $11,850,000 | 29/05/2024 | $2,650,000 |
| SUNNY PALMS | 65 LORONG G TELOK KURAU #04-XX | 2,971 | $2,150,000 | 27/5/11 | $1,800,000 | 17/7/20 | $3,088,888 | 30/07/2023 | $1,288,888 |
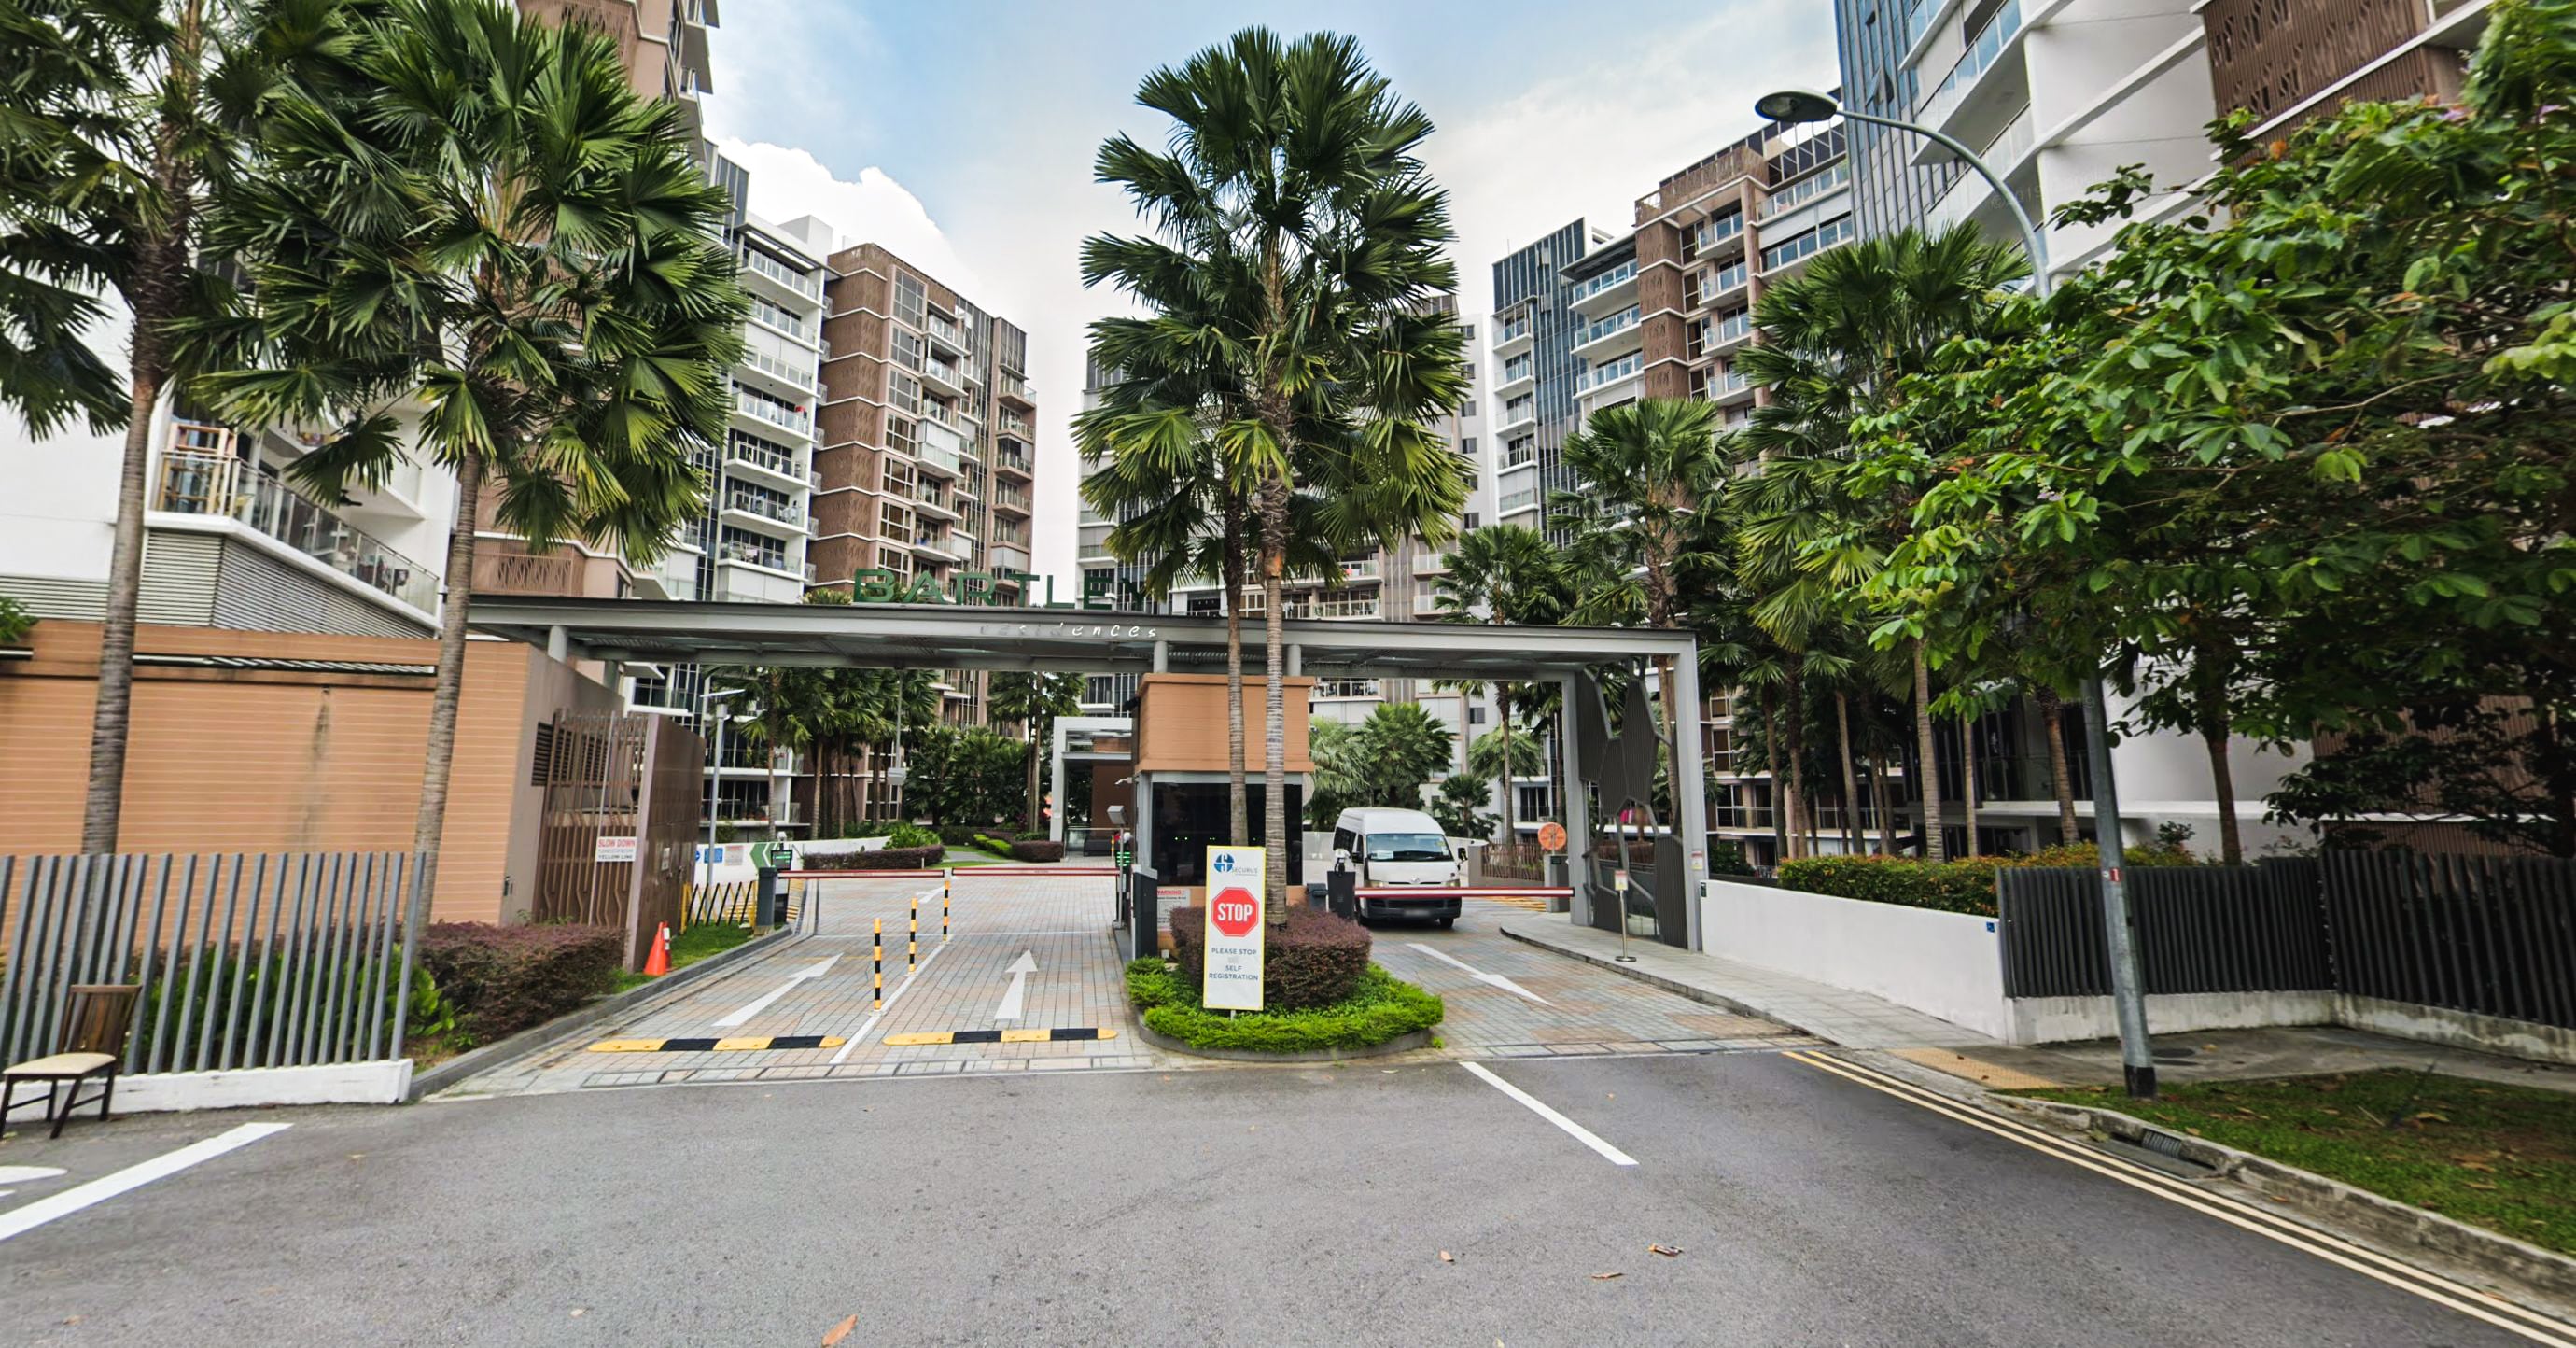
| BARTLEY RESIDENCES | 5A LORONG HOW SUN #07-XX | 1,346 | $1,677,000 | 3/9/12 | $1,680,000 | 12/3/20 | $2,580,000 | 03/10/2023 | $900,000 |
| PALM ISLES | 36 FLORA DRIVE #03-XX | 3,800 | $2,606,552 | 16/4/12 | $2,050,000 | 23/9/20 | $2,920,000 | 01/08/2023 | $870,000 |
| KATONG REGENCY | 17 TANJONG KATONG ROAD #07-XX | 1,711 | $2,300,840 | 17/5/12 | $2,300,000 | 10/3/20 | $3,168,000 | 27/09/2024 | $868,000 |
| EUPHONY GARDENS | 1 JALAN MATA AYER #04-XX | 2,196 | $1,100,000 | 21/8/17 | $1,100,000 | 22/12/20 | $1,938,000 | 24/01/2024 | $838,000 |
| DUCHESS CREST | 56 DUCHESS AVENUE #01-XX | 1,884 | $2,500,000 | 26/6/12 | $2,388,000 | 1/9/20 | $3,170,000 | 26/09/2023 | $782,000 |
| SEVENTY SAINT PATRICK’S | 78 ST. PATRICK’S ROAD #04-XX | 1,184 | $1,957,000 | 29/10/14 | $1,950,000 | 18/8/20 | $2,730,000 | 13/04/2023 | $780,000 |
| JARDIN | 966 DUNEARN ROAD #03-XX | 1,819 | $3,760,820 | 19/3/12 | $2,800,000 | 25/6/20 | $3,550,000 | 21/07/2022 | $750,000 |
| SILVERSEA | 46 MARINE PARADE ROAD #06-XX | 1,485 | $2,575,000 | 9/7/14 | $2,450,000 | 5/11/20 | $3,200,000 | 18/01/2024 | $750,000 |
The biggest loss from here was a 2,885 sq. ft. unit at Ardmore Park, which was bought at $9.35 million, but sold for just $9.2 million during the pandemic. As of May 2024, that same unit sold for $11.85 million, so the owner who sold during Covid lost out on $2.65 million, on top of the original loss.
The second million-dollar loss was at Sunny Palms, where a 2,971 sq. ft. unit was bought at $2.15 million, and sold at $1.8 million during Covid. In July 2023, this same unit sold for $3,088,888. The Covid-period seller lost out on $1,288,888, on top of the original loss.
Some notable lessons from the incident:
1. The post-Covid rebound was not especially specific to any region
Ardmore Park may set the wrong tone, being at the top of the list and also an Orchard area property. If you observe the rest of the list, you’ll see the highest losses (from the post-Covid rebound) weren’t just restricted to the CCR, RCR, or OCR.
The second highest loss (Sunny Palms) was in District 15, which is in the OCR (whilst District 15 has some high-end properties, these are in the Meyer Road area, quite far from Sunny Palms). Bartley Residences and Palm Isles are in Districts 19 and 17 respectively, out in the OCR.
More from Stacked
This New River Valley Condo Starts At $1.2M: And It’s Cheaper Than Some City-Fringe Launches
With multiple CCR new launches queued up around River Valley, buyers are spoilt for choice, but also faced with new…
At the same time, we do see some prime region properties like Reflections at Keppel Bay and The Sail @ Marina Bay further down on the list. So given the wide mix of units, no particular region was more or less susceptible to the effects.
2. The rebound was generally higher for bigger units
Where there was a pattern was in the unit sizes. You’ll notice the losses generally shrink with the unit sizes, as you go down the list (with some exceptions, like The Coast @ Sentosa Cove).
The top 10 losers ranged from 1,711 to 3,800 sq. ft., whilst the bottom 10 ranged from 366 to 926 sq. ft.; and the majority are one-bedders which are 500 sq. ft. or smaller.
From this, we can surmise that the post-Covid rebound was more muted for smaller one or two-bedder units, versus family-sized units of 1,000+ sq. ft. for more. This was likely due to the increased demand for bigger units post Covid-19, where we can even see this change in demand move towards new launches (bigger units now cost more than smaller ones on a per square foot basis).
3. Agents credit the phenomenon to Covid restrictions
When we brought up the fact that losses were due to urgency (e.g., owners having to sell fast due to other losses), some realtors disagreed. One executive who works for a property portal, and who used to be an agent himself, told us the following anonymously:
“Even before and after Covid – all year round, every year in Singapore – there are also urgent sales. But these types of sales can still be profitable. So why weren’t they profitable during Covid? The reason Covid was different was due to viewing restrictions.
Especially for resale units, our hands were tied. There was no viewing allowed, and later the viewings were restricted. Also, you must consider people were scared to buy resale, because during Covid there was a lot of delay and difficulty for renovations, and the price for renovations also shot up.
Even if the buyer didn’t have urgency, even if they were okay to wait one whole year after Covid, it was still harder to get good offers.”
The same person says that in future, a repeat incident is less likely. This is because the industry has learned from the incident, and there’s growing use and acceptance of virtual tours and video listings; something that was slower to catch on prior to the pandemic.
So quite possibly what we saw here won’t happen again.
The property market is all about patience, and holding power
As we’ve seen from the Covid incident, a lot of your potential gains boil down to holding power. If other circumstances force you to sell your property, there’s no guarantee you’ll be doing it at a good time.
It’s also a good lesson in how counterintuitive the property market can be. All the predictions of property bubbles, a collapsing economy, a long recovery period for real estate, etc. seemed perfectly rational at the time; even though property prices did continue to trend upward.
This is one advantage that people pursuing rent have, over those more focused on gains: they’re more likely to just stay calm and continue collecting their rental income, as opposed to rushing to sell before “things get worse.”
At Stacked, we like to look beyond the headlines and surface-level numbers, and focus on how things play out in the real world.
If you’d like to discuss how this applies to your own circumstances, you can reach out for a one-to-one consultation here.
And if you simply have a question or want to share a thought, feel free to write to us at stories@stackedhomes.com — we read every message.
Frequently asked questions
What caused some properties to sell at a loss during the Covid pandemic but later sell for much more?
Did the Covid-19 pandemic affect property prices equally across different regions?
Are larger or smaller units more likely to see higher price rebounds after Covid?
Why were property sales during Covid often at a loss, and is this likely to happen again?
How important is holding power in the property market during uncertain times?
Ryan J. Ong
A seasoned content strategist with over 17 years in the real estate and financial journalism sectors, Ryan has built a reputation for transforming complex industry jargon into accessible knowledge. With a track record of writing and editing for leading financial platforms and publications, Ryan's expertise has been recognised across various media outlets. His role as a former content editor for 99.co and a co-host for CNA 938's Open House programme underscores his commitment to providing valuable insights into the property market.Need help with a property decision?
Speak to our team →Read next from Property Investment Insights
Property Investment Insights River Modern Starts From $1.548M For A Two-Bedder — How Its Pricing Compares In River Valley
Property Investment Insights This Singapore Condo Has Bigger Units Near The MRT — But Timing Decided Who Made Money

Property Investment Insights We Compared Lease Decay Across HDB Towns — The Differences Are Significant

Property Investment Insights This Singapore Condo Skipped 1-Bedders And Focused On Space — Here’s What Happened 8 Years Later
Latest Posts
Singapore Property News Why Some Singaporean Parents Are Considering Selling Their Flats — For Their Children’s Sake
New Launch Condo Reviews River Modern Condo Review: A River-facing New Launch with Direct Access to Great World MRT Station
On The Market Here Are The Cheapest 5-Room HDB Flats Near An MRT You Can Still Buy From $550K




0 Comments