Can Leasehold Condos Deliver Better Returns Than Freehold? A 10-Year Data Study Says Yes


A seasoned content strategist with over 17 years in the real estate and financial journalism sectors, Ryan has built a reputation for transforming complex industry jargon into accessible knowledge. With a track record of writing and editing for leading financial platforms and publications, Ryan's expertise has been recognised across various media outlets. His role as a former content editor for 99.co and a co-host for CNA 938's Open House programme underscores his commitment to providing valuable insights into the property market.
In this Stacked Pro breakdown:
- We compared 10 years of freehold and leasehold condo transactions across resale, sub-sale, and new launches
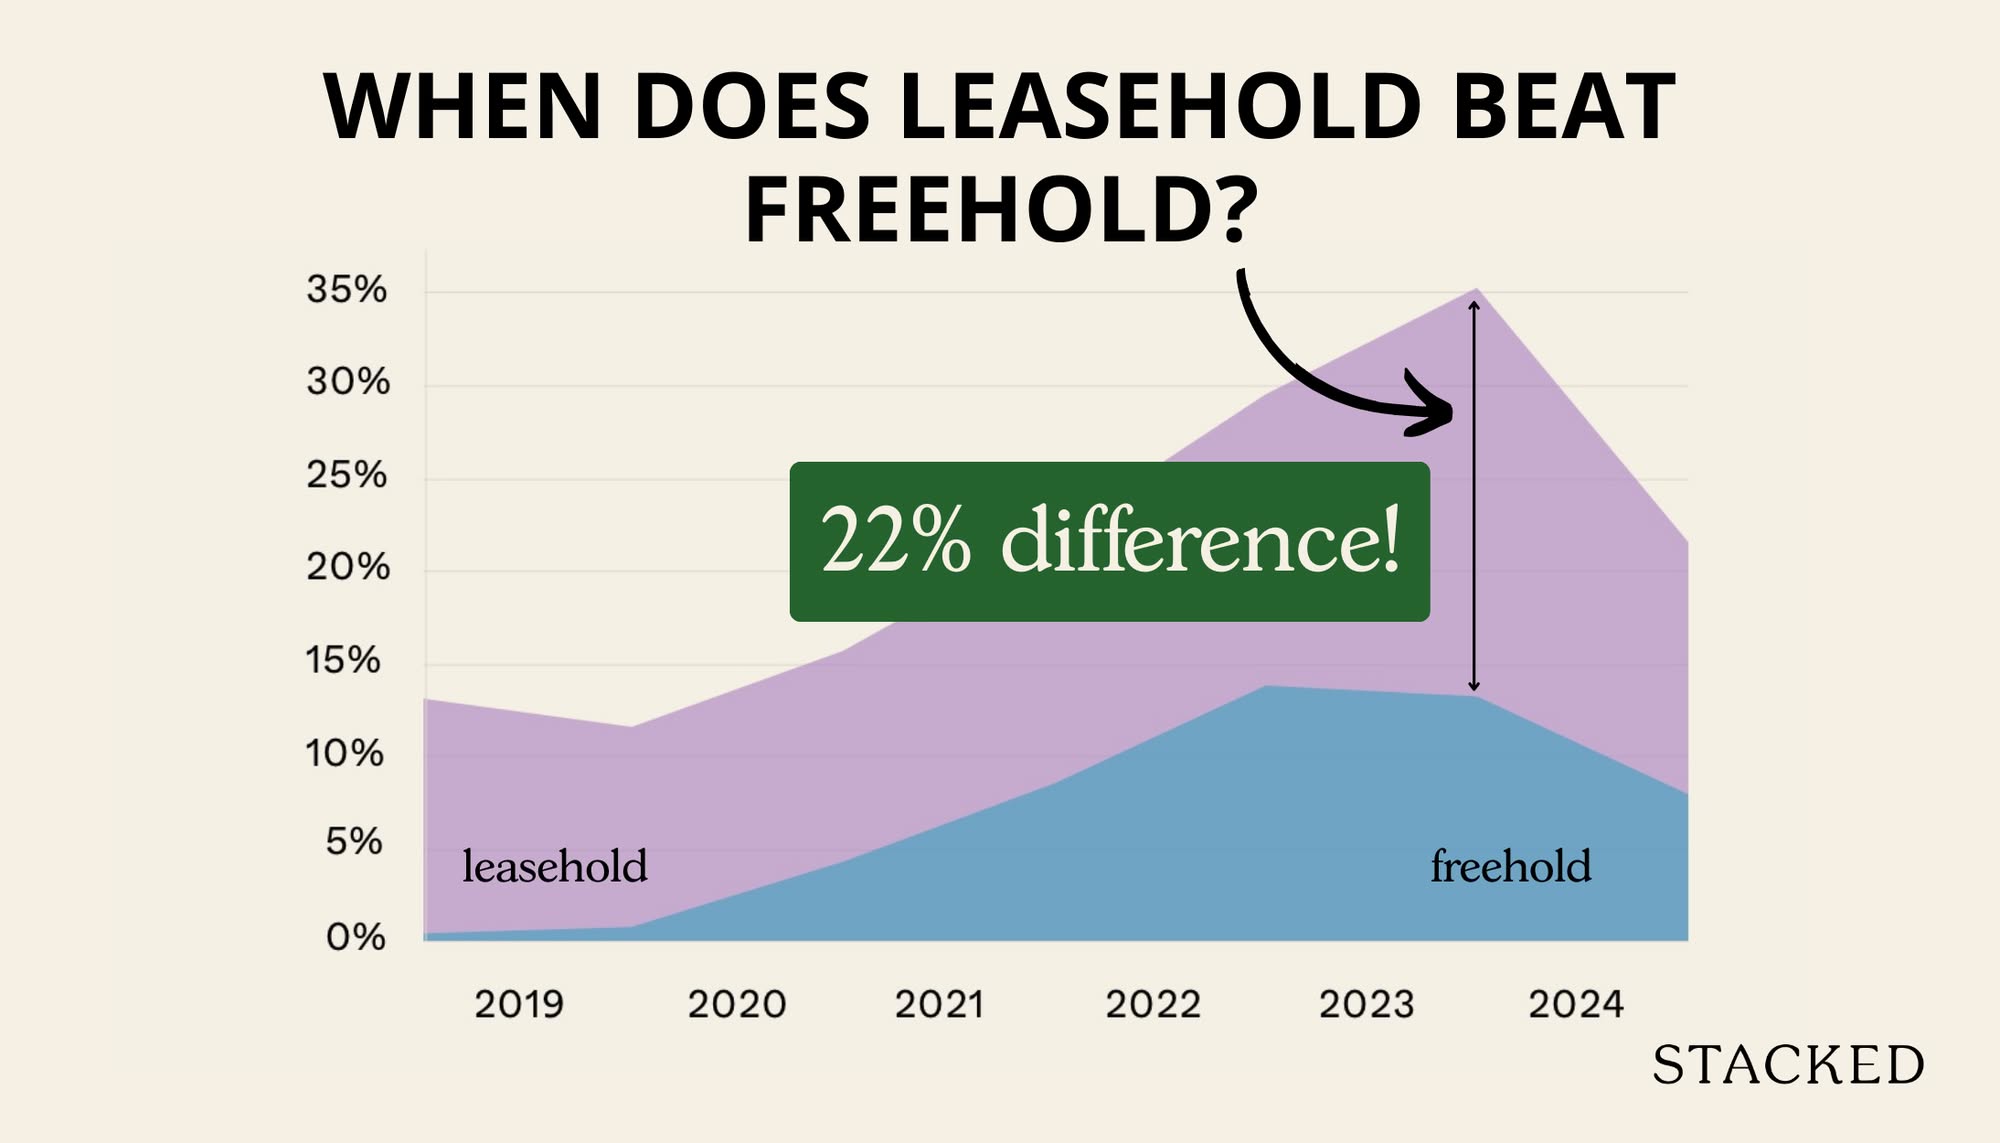
- In shorter time frames, one tenure outpaced the other by over 20%, revealing patterns most buyers overlook
- But stretch the timeline far enough, and a surprising reversal happens — with returns most buyers don’t expect
Already a subscriber? Log in here.
It’s been drilled into the Singaporean mindset that “freehold is better.” But this is an oversimplified saying that ignores a key fundamental factor: that of time.
99 years is a long time; and it can take many decades before the freehold premium starts to pay off. For those who sell a condo in a short time span, such as within the first decade, freehold status may even be a drawback. In the following study, we look at how long you should hold a freehold condo before it really starts to matter; and we try to pinpoint the age at which a leasehold condo still tends to outperform a freehold counterpart:
Comparing freehold and leasehold properties over the past 10 years
For the following, we compared the price growth of freehold versus leasehold condos from 2014 to 2024.
As is common practice in the property market, we regard 999-year lease projects as being effectively similar to freehold, for these comparisons. We also excluded condos built from 2015 as their inclusion in the dataset will distort prices since newer condos will likely be leasehold as the Government no longer sells freehold land.
Year | Freehold | Leasehold |
2014 | $1,366 | $1,037 |
2015 | $1,361 | $1,039 |
2016 | $1,377 | $1,041 |
2017 | $1,371 | $1,055 |
2018 | $1,450 | $1,095 |
2019 | $1,508 | $1,064 |
2020 | $1,451 | $1,042 |
2021 | $1,565 | $1,136 |
2022 | $1,684 | $1,256 |
2023 | $1,754 | $1,368 |
2024 | $1,803 | $1,426 |
Annualised | 2.81% | 3.24% |
Difference in $PSF | $437 | $389 |

Over the past decade, the $PSF gap between freehold and leasehold has widened marginally. In terms of annualised percentage growth, however, leasehold seems to have a slight upper hand. This is due to the freehold premium: a freehold property has a higher initial cost, often (but not always) around 15 to 20 per cent higher than a leasehold counterpart. This makes it easier for leasehold to outperform freehold, as there’s more room for appreciation.
Here’s a look at the freehold and leasehold $PSF by era. Since we’re only looking at data from 2014, we’ve excluded condos built from 2015 onwards. This avoids skewing the data unfavourably towards leasehold condos in the later years since most recent condos built are leasehold in tenure.
Freehold $PSF by built period:
Year | Period | |||
1980 – 1989 | 1990 – 1999 | 2000 – 2009 | 2010 – 2014 | |
2014 | $1,197 | $1,187 | $1,367 | $1,632 |
2015 | $1,173 | $1,135 | $1,342 | $1,638 |
2016 | $1,158 | $1,139 | $1,319 | $1,674 |
2017 | $1,203 | $1,160 | $1,340 | $1,598 |
2018 | $1,326 | $1,224 | $1,382 | $1,634 |
2019 | $1,346 | $1,312 | $1,443 | $1,746 |
2020 | $1,342 | $1,304 | $1,385 | $1,635 |
2021 | $1,469 | $1,386 | $1,521 | $1,707 |
2022 | $1,651 | $1,501 | $1,643 | $1,813 |
2023 | $1,729 | $1,603 | $1,750 | $1,852 |
2024 | $1,738 | $1,662 | $1,806 | $1,904 |
Annualised | 3.80% | 3.42% | 2.82% | 1.55% |
Leasehold $PSF by built period:
Year | Period | |||
1980 – 1989 | 1990 – 1999 | 2000 – 2009 | 2010 – 2014 | |
2014 | $931 | $918 | $1,018 | $1,388 |
2015 | $860 | $915 | $1,002 | $1,327 |
2016 | $787 | $881 | $996 | $1,285 |
2017 | $818 | $879 | $998 | $1,335 |
2018 | $992 | $904 | $1,037 | $1,273 |
2019 | $1,017 | $941 | $1,021 | $1,177 |
2020 | $964 | $916 | $1,006 | $1,155 |
2021 | $1,035 | $981 | $1,087 | $1,282 |
2022 | $1,127 | $1,083 | $1,195 | $1,416 |
2023 | $1,276 | $1,219 | $1,307 | $1,543 |
2024 | $1,229 | $1,260 | $1,382 | $1,586 |
Annualised | 2.82% | 3.22% | 3.10% | 1.34% |
Here’s a look at the change between years:
Freehold

Leasehold

The strongest gains for leasehold condos occurred in two instances: the first was the post-pandemic years of 2022 to 2023. In both years, gains were close to 10% or more. Freehold/999-year condos saw slightly lower gains.
The price spikes were likely due to the housing supply shortage. As leasehold properties were far more accessible price-wise, it’s unsurprising that they saw more rapid price growth.
For 2016, price growth reached 13.99 per cent for leasehold, as compared to 0.98 per cent for freehold. We will discuss this in further detail below.
When examining the price difference psf between leasehold and freehold condos, 2024 looks like we’ve come full circle: the gap in 2024 (20.47 per cent) is now nearly identical to the level seen in 2016 (19.15 per cent).
Key observations:
The first, and perhaps least surprising, observation is that freehold does pay off more as the projects age.


For example:
- In the 2010–2014 cohort, the difference in annualised growth is just 0.21 per cent.
- In the 2000–2009 cohort, leasehold outperformed by 0.28 per cent.
- The 1990-1999 cohort saw freehold outperforming by 0.21 per cent.
- And by the time we get to the 1980–1989 cohort, freehold outperformed by a more significant 0.98 per cent.
What’s interesting here is just how long it takes for freehold status to make a difference. 1980 to 1989 was a long time ago, and projects need to be very old before a real difference starts to show. From an earlier study, we saw that many condos don’t make it past the age of 30, so this should make you wonder if the freehold premium is worth paying if you are looking at a shorter-term hold.
Next, we’ll look at resale-to-resale transactions. What happens if you weren’t the first owner?
In this section, we looked at those who bought in 2014/15 only and sold in subsequent years. We only took into account those who sold in 2019 onwards, as this is past the SSD period (thus removing any distress sales from the data). This period is also when transaction volume was higher.
Here are the annualised returns of those who bought freehold in 2014/15 and sold in subsequent years:
Freehold/999-year
Year | 1980 – 1989 | 1990 – 1999 | 2000 – 2009 | 2010 – 2014 |
2019 | 21.8% | 17.5% | 12.7% | 5.1% |
2020 | 16.1% | 15.9% | 10.6% | 1.4% |
2021 | 22.9% | 24.4% | 16.1% | 8.9% |
2022 | 38.5% | 34.8% | 28.7% | 13.3% |
2023 | 57.4% | 46.5% | 33.4% | 17.6% |
2024 | 50.3% | 48.7% | 40.4% | 28.2% |
Average Annualised Returns | 29.4% | 29.6% | 21.3% | 11.9% |
Leasehold
Year | 1980 – 1989 | 1990 – 1999 | 2000 – 2009 | 2010 – 2014 |
2019 | 14.7% | 4.2% | 1.6% | -0.2% |
2020 | 4.6% | 4.2% | 1.4% | -3.5% |
2021 | 29.2% | 8.7% | 8.8% | 3.8% |
2022 | 35.0% | 19.6% | 18.4% | 10.2% |
2023 | 47.7% | 30.3% | 26.7% | 21.5% |
2024 | 29.5% | 37.6% | 34.2% | 22.9% |
Average Annualised Returns | 22.2% | 17.9% | 14.8% | 8.5% |
When we examine resale-to-resale transactions, there’s continued congruence with what we found earlier: generally, older properties see a greater difference in gains compared to newer ones. For example, freehold properties saw a 7.2 per cent annualised return compared to leasehold ones for those built in the 1980s. This is in contrast with the 3.4 per cent difference for those built in 2010-2014.
This pattern is most evident across the 1980s, 1990s, and 2000s cohorts, where freehold units consistently posted higher average resale gains. This is most pronounced in the 1990s cohort, where the gap between leasehold and freehold gains was at around 12 per cent.
We can also see that freehold can be volatile like leasehold, in their earlier years
By this, we refer to the newer freehold condos (2010–2019), which have been more volatile. These newer freehold properties saw a gain of just 5.4 per cent and 1.4 per cent in 2019 and 2020, the lowest in that year – a pattern that closely mirrors the poorer performance of 99-year leasehold condos from the same era.
This suggests that freehold status doesn’t guarantee good gains in the short term; in fact, they can sometimes be riskier in the near term, as they’re launched at higher prices.
We also need to acknowledge the role of the pandemic here though, which also resulted in some disruptions for newer condos just when the pandemic hit.
Also note that freehold properties, especially older ones, often outperform in absolute dollar terms.
Now let’s look at new-to-resale transactions.
In this section, we look at those who bought a new launch in 2014/15 and subsequently sold it from 2019 onwards. This allows us to avoid distortions from events like urgent sales. It also allows a fairer assessment, due to the similarity of holding periods.
Freehold new to resale returns:
Sold Year | Average of ROI | Average of Quantum | Volume |
2019 | 0.5% | -$26,971 | 29 |
2020 | 0.8% | $19,973 | 54 |
2021 | 4.3% | $75,794 | 128 |
2022 | 8.6% | $152,938 | 112 |
2023 | 13.9% | $344,277 | 99 |
2024 | 13.3% | $195,771 | 80 |
Average | 8.0% | $153,132 | 502 |
Leasehold new to resale returns:
Sold Year | Average of ROI | Average of Quantum | Volume |
2019 | 13.1% | $131,557 | 140 |
2020 | 11.6% | $106,200 | 319 |
2021 | 15.7% | $154,236 | 597 |
2022 | 22.1% | $217,353 | 501 |
2023 | 29.6% | $305,595 | 335 |
2024 | 35.3% | $372,170 | 371 |
Average | 21.6% | $218,170 | 2,263 |
When analysing new sales to resale transactions, we see that leasehold takes the lead.
Freehold condos saw a lower average return every single year compared to their leasehold equivalents. Overall, their average quantum gains also took the lead each year.
The verdict: It depends on your game plan
As we’ve seen, the common belief that “freehold is always better” often leads to missed short-term opportunities in Singapore’s property market.
While most buyers continue to chase freehold units for their perceived long-term security and en-bloc potential, our analysis shows that leasehold condos, particularly new launches, consistently deliver stronger short-term gains, sometimes outperforming by over 20%. This outperformance was especially clear during buoyant market cycles, when affordability drove demand.
This isn’t just theory – we’ve helped data-driven buyers identify profitable exit windows in leasehold projects, simply by focusing on entry price, market cycle, and holding period over tenure alone.
Want to discover what other counter-intuitive strategies are working in today’s market? Reach out to our consultancy team — we’re happy to share what we’re seeing on the ground. If you’d like to get in touch for a more in-depth consultation, you can do so here.
Ryan J
A seasoned content strategist with over 17 years in the real estate and financial journalism sectors, Ryan has built a reputation for transforming complex industry jargon into accessible knowledge. With a track record of writing and editing for leading financial platforms and publications, Ryan's expertise has been recognised across various media outlets. His role as a former content editor for 99.co and a co-host for CNA 938's Open House programme underscores his commitment to providing valuable insights into the property market.Read next from Property Investment Insights

Property Investment Insights How Different Condo Views Affect Returns In Singapore: A 25-Year Study Of Pebble Bay

Property Investment Insights How A Clement Canopy Condo Buyer Made $700K More Than Their Neighbours: A Data Breakdown On Timing

Property Investment Insights Watertown Condo’s 10-Year Case Study: When Holding Period And Exit Timing Mattered More Than Buying Early

Property Investment Insights Same Condo, Same Layout — But A $1M Profit Gap: A Data-Driven Study On Martin Modern
Latest Posts

Home Tours Inside A Minimalist’s Tiny Loft With A Stunning City View

On The Market 5 Most Affordable Newly MOP 4-Room HDB Flats From $585k

Property Market Commentary Distressed Property Sales Are Up In Singapore In 2025: But Don’t Expect Bargain Prices

Singapore Property News This $1.5M Bukit Timah Executive HDB Flat With 62-Years Lease Left Just Set A Record: Here’s Why

Editor's Pick Where To Find The Cheapest 2 Bedroom Resale Units In Central Singapore (From $1.2m)

Property Picks 19 Cheaper New Launch Condos Priced At $1.5m Or Less. Here’s Where To Look

Property Advice The Ultimate Work From Home Homebuyer Checklist (That Most People Still Overlook)

Editor's Pick These $4m Freehold Landed Homes In Joo Chiat Have A 1.4 Plot Ratio: What Buyers Should Know

Editor's Pick Now That GE2025 Is Over, Let’s Talk About The Housing Proposals That Didn’t Get Enough Scrutiny

Property Advice When ‘Bad’ Property Traits Can Be A Bargain For Homebuyers In Singapore

Property Picks Here’s Where You Can Find The Biggest Two-Bedder Condos Under $1.8 Million In 2025

Property Market Commentary Why Do Property Agents Always Recommend New Launch Condos? Is It Really About The Money?

On The Market 5 Affordable Condos With Unblocked Views Priced Under $1 Million

Singapore Property News GE2025: Who’s Got the Better Housing Plan? We Break Down PAP, WP, RDU, PSP And SDP Proposals

Editor's Pick Why No Property Developers Bid For Media Circle Parcel B (And What It Means For One-North)
