


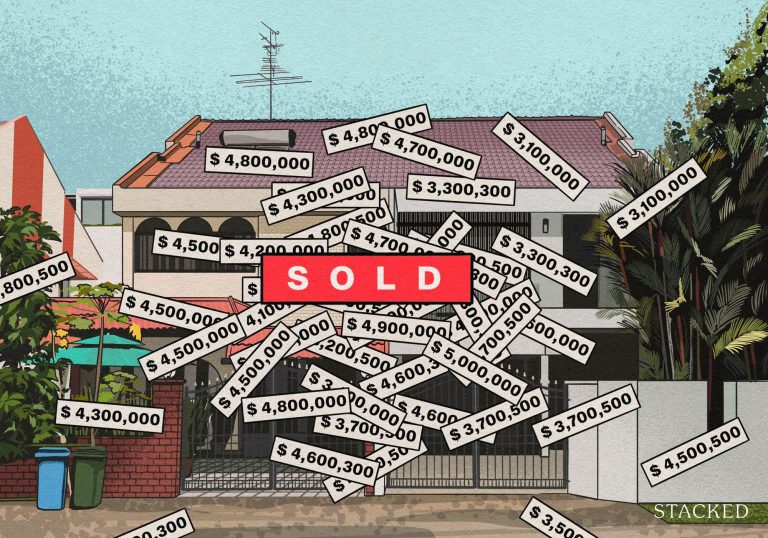


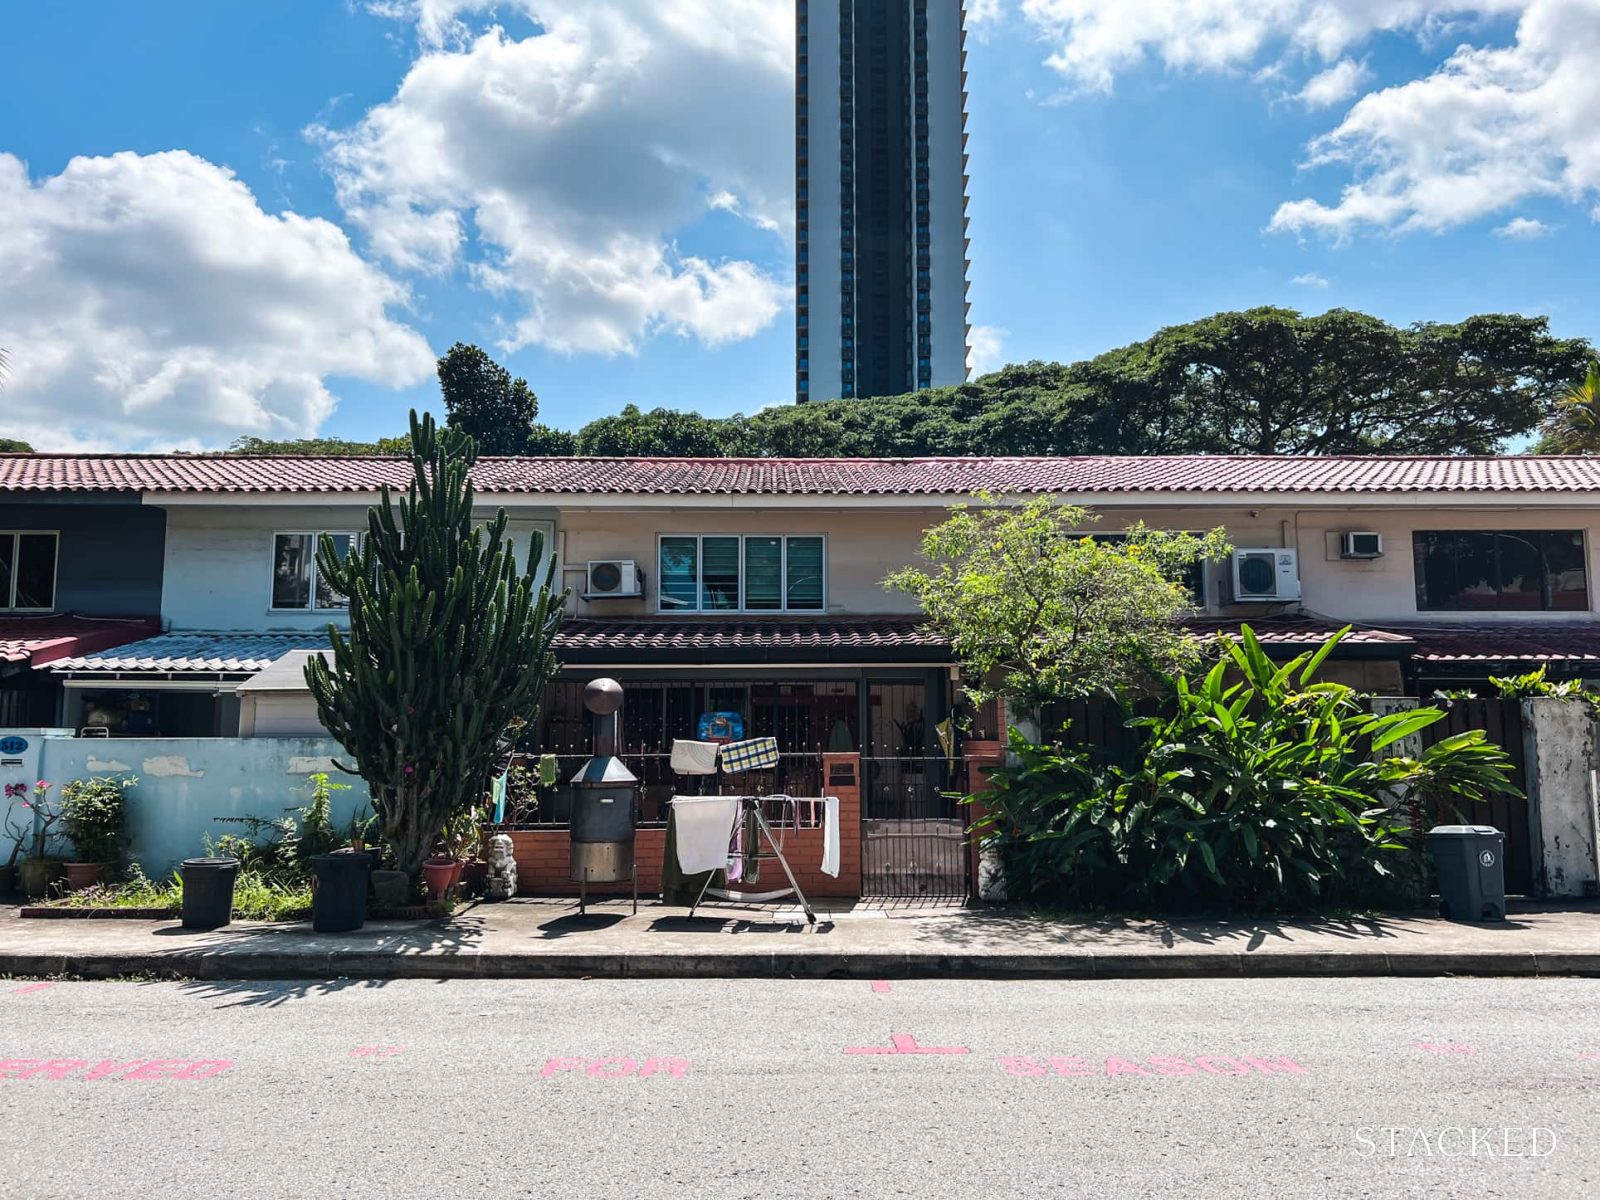
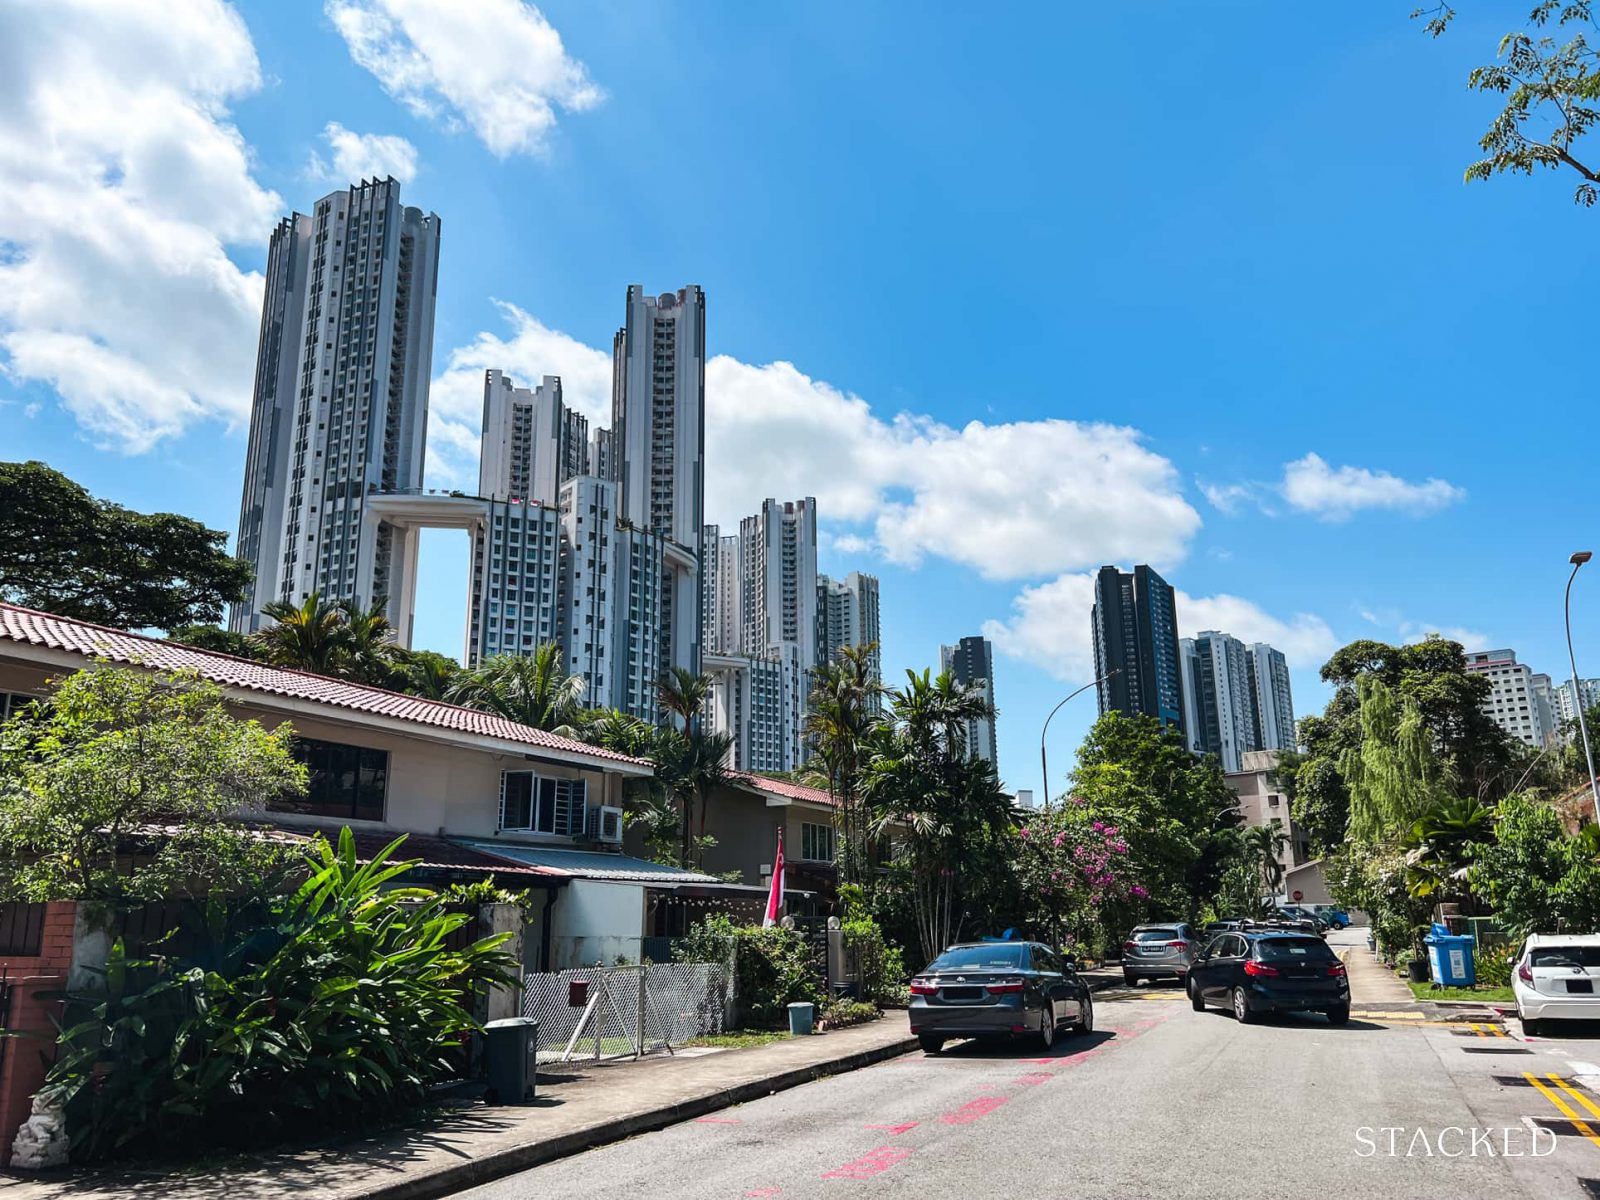
The most affordable landed homes in Singapore aren’t usually private properties; rather, these are HDB terraced units, many of which date back to the 1950s. Because they’re so rare, there’s always a lot of attention when one is sold – such as when one of these 52-year-old HDB landed houses at Whampoa sold for $1.568 million in July 2024. This technically makes it the most expensive 3-room “flat” ever sold, although we might say that’s not really a fair comparison. Nonetheless, this sparked some interest in whether these old landed houses actually have any resale value, and so we took a closer look:
(If you don’t know what HDB landed houses are, you can check out some of the details in this article).
Market commentary like this is only useful if you can translate it into what it means for your own purchase: your entry price, holding period and exit options.
That's where many buyers get stuck. General market insights rarely tell you whether a specific unit, at a specific price, is the right decision for your circumstances.
Over time, that's also why we decided to work with agents who shared the same data-driven and advisory-led approach behind our editorial, consultants who could help readers think through decisions more objectively, rather than simply push transactions.
Today, the team has worked with more than 2,000 clients across over $5B in property transactions.
HDB landed home transactions since 1990
We managed to find 41 blocks with landed-type transactions between 1990 and the present. This isn’t a big number, but it can’t be helped as these properties are quite rare, and transaction volume is bound to be low. We also weren’t able to get the particular home’s prices (similar to regular HDBs), but it does give you an idea of what prices are like.
| Year | JLN BAHAGIA | JLN MA’MOR | JLN TENTERAM | STIRLING RD |
| 1990 | $86,063 | $59,000 | $90,000 | $99,400 |
| 1991 | $90,409 | $70,000 | $60,000 | $100,800 |
| 1992 | $111,800 | $103,600 | $158,000 | |
| 1993 | $196,385 | $126,000 | $225,333 | |
| 1994 | $283,500 | $297,857 | $288,000 | $283,250 |
| 1995 | $398,500 | $372,143 | $398,700 | |
| 1996 | $498,350 | $445,769 | $430,000 | $498,286 |
| 1997 | $516,282 | $537,750 | $578,000 | $512,028 |
| 1998 | $459,150 | $463,000 | $474,125 | |
| 1999 | $426,677 | $452,989 | $430,000 | $460,000 |
| 2000 | $482,857 | $498,929 | $450,000 | $398,833 |
| 2001 | $476,000 | $468,333 | $469,000 | $426,000 |
| 2002 | $431,955 | $435,800 | $390,000 | $434,600 |
| 2003 | $420,250 | $397,667 | $390,000 | $410,200 |
| 2004 | $416,400 | $479,200 | $515,000 | $406,000 |
| 2005 | $444,429 | $368,333 | $368,000 | $394,800 |
| 2006 | $448,667 | $440,625 | $376,115 | |
| 2007 | $434,933 | $454,750 | $491,722 | |
| 2008 | $480,600 | $523,762 | $518,571 | |
| 2009 | $608,627 | $609,289 | $568,446 | |
| 2010 | $707,111 | $660,083 | $663,333 | $636,500 |
| 2011 | $759,875 | $768,000 | $769,400 | $740,296 |
| 2012 | $747,750 | $828,397 | $810,000 | $789,450 |
| 2013 | $730,000 | $933,222 | $818,250 | |
| 2014 | $800,750 | $880,750 | $704,000 | |
| 2015 | $837,948 | $842,667 | $794,333 | |
| 2016 | $764,722 | $843,750 | $915,000 | |
| 2017 | $771,000 | $806,481 | $844,630 | |
| 2018 | $878,000 | $810,333 | $645,000 | $873,000 |
| 2019 | $755,000 | $782,500 | $850,000 | |
| 2020 | $833,571 | $827,500 | $678,000 | $871,000 |
| 2021 | $973,320 | $907,500 | $965,000 | $864,000 |
| 2022 | $863,500 | $887,648 | $924,333 | |
| 2023 | $1,021,500 | $1,100,000 | $780,500 | |
| 2024 | $847,222 | $1,266,000 | ||
| Change (1990 – 2024) | 6.96% | 9.44% | 14.98% | 6.44% |
| Change (2014 – 2024) | 0.57% | 3.70% | No Data | 1.15% |
| Year | JLN BAHAGIA | JLN MA’MOR | JLN TENTERAM | STIRLING RD |
| 1990 | $74 | $41 | $89 | $90 |
| 1991 | $80 | $60 | $57 | $88 |
| 1992 | $83 | $69 | $122 | |
| 1993 | $128 | $113 | $189 | |
| 1994 | $247 | $222 | $185 | $279 |
| 1995 | $314 | $341 | $343 | |
| 1996 | $379 | $419 | $425 | $459 |
| 1997 | $400 | $353 | $303 | $477 |
| 1998 | $397 | $331 | $457 | |
| 1999 | $338 | $342 | $425 | $326 |
| 2000 | $429 | $351 | $431 | $396 |
| 2001 | $378 | $334 | $373 | $394 |
| 2002 | $352 | $384 | $385 | $349 |
| 2003 | $376 | $392 | $385 | $393 |
| 2004 | $347 | $298 | $216 | $342 |
| 2005 | $356 | $386 | $364 | $345 |
| 2006 | $309 | $352 | $364 | |
| 2007 | $380 | $395 | $423 | |
| 2008 | $507 | $400 | $503 | |
| 2009 | $507 | $450 | $513 | |
| 2010 | $544 | $607 | $567 | $617 |
| 2011 | $643 | $707 | $760 | $753 |
| 2012 | $822 | $703 | $801 | $818 |
| 2013 | $805 | $592 | $692 | |
| 2014 | $801 | $721 | $752 | |
| 2015 | $781 | $686 | $702 | |
| 2016 | $783 | $666 | $804 | |
| 2017 | $600 | $641 | $885 | |
| 2018 | $643 | $575 | $637 | $873 |
| 2019 | $702 | $806 | $908 | |
| 2020 | $726 | $725 | $670 | $774 |
| 2021 | $737 | $669 | $640 | $781 |
| 2022 | $915 | $867 | $742 | |
| 2023 | $784 | $955 | $783 | |
| 2024 | $762 | $590 | ||
| Change (1990 – 2024) | 7.11% | 8.14% | 12.31% | 6.78% |
| Change (2014 – 2024) | -0.51% | -1.98% | No Data | 0.45% |
Next, we compare these landed home figures to the performances of regular HDB flats:
| Year | 3 ROOM | 4 ROOM | 5 ROOM | EXECUTIVE |
| 1990 | $42,548 | $81,757 | $132,615 | $186,458 |
| 1991 | $44,390 | $81,761 | $138,103 | $191,167 |
| 1992 | $48,046 | $90,912 | $154,384 | $213,971 |
| 1993 | $70,767 | $134,360 | $227,253 | $296,455 |
| 1994 | $93,896 | $175,046 | $284,072 | $367,723 |
| 1995 | $120,862 | $216,575 | $341,553 | $443,288 |
| 1996 | $172,576 | $295,868 | $441,541 | $572,772 |
| 1997 | $194,325 | $304,947 | $442,182 | $567,156 |
| 1998 | $154,528 | $253,703 | $373,743 | $479,760 |
| 1999 | $145,733 | $243,871 | $355,042 | $447,643 |
| 2000 | $157,157 | $256,708 | $375,507 | $479,089 |
| 2001 | $144,927 | $233,871 | $340,184 | $445,524 |
| 2002 | $143,714 | $224,189 | $324,428 | $422,226 |
| 2003 | $159,283 | $230,091 | $322,054 | $408,603 |
| 2004 | $173,888 | $237,554 | $315,056 | $386,484 |
| 2005 | $170,063 | $234,454 | $303,456 | $361,812 |
| 2006 | $166,105 | $235,465 | $303,186 | $357,635 |
| 2007 | $180,589 | $254,522 | $327,557 | $384,763 |
| 2008 | $225,845 | $308,725 | $389,542 | $458,551 |
| 2009 | $248,522 | $331,749 | $403,023 | $471,082 |
| 2010 | $286,763 | $372,523 | $454,304 | $522,056 |
| 2011 | $324,178 | $422,694 | $501,826 | $577,826 |
| 2012 | $350,309 | $456,252 | $542,172 | $629,253 |
| 2013 | $361,126 | $479,144 | $568,800 | $661,300 |
| 2014 | $340,068 | $444,921 | $536,065 | $639,124 |
| 2015 | $323,645 | $433,574 | $515,018 | $620,677 |
| 2016 | $321,489 | $434,348 | $522,708 | $624,048 |
| 2017 | $316,668 | $437,120 | $532,277 | $627,211 |
| 2018 | $305,331 | $431,704 | $527,635 | $630,780 |
| 2019 | $298,230 | $429,749 | $526,812 | $617,561 |
| 2020 | $311,381 | $448,559 | $541,457 | $635,395 |
| 2021 | $351,378 | $505,022 | $603,990 | $705,559 |
| 2022 | $388,116 | $549,022 | $654,253 | $782,007 |
| 2023 | $411,272 | $584,035 | $685,338 | $829,310 |
| 2024 | $430,602 | $614,876 | $716,679 | $864,590 |
| Change (1990 – 2024) | 7.04% | 6.11% | 5.09% | 4.62% |
| Change (2014 – 2024) | 2.39% | 3.29% | 2.95% | 3.07% |
| Year | 3 ROOM | 4 ROOM | 5 ROOM | EXECUTIVE |
| 1990 | $58 | $80 | $100 | $116 |
| 1991 | $60 | $81 | $104 | $120 |
| 1992 | $65 | $90 | $116 | $134 |
| 1993 | $97 | $132 | $171 | $187 |
| 1994 | $128 | $170 | $214 | $232 |
| 1995 | $164 | $210 | $257 | $278 |
| 1996 | $234 | $284 | $332 | $359 |
| 1997 | $261 | $293 | $332 | $357 |
| 1998 | $209 | $243 | $279 | $301 |
| 1999 | $198 | $231 | $264 | $277 |
| 2000 | $213 | $242 | $279 | $298 |
| 2001 | $197 | $221 | $256 | $280 |
| 2002 | $195 | $212 | $245 | $266 |
| 2003 | $216 | $218 | $243 | $257 |
| 2004 | $238 | $227 | $240 | $244 |
| 2005 | $233 | $225 | $233 | $230 |
| 2006 | $228 | $227 | $235 | $227 |
| 2007 | $248 | $247 | $256 | $245 |
| 2008 | $310 | $299 | $306 | $293 |
| 2009 | $341 | $322 | $318 | $303 |
| 2010 | $394 | $361 | $356 | $335 |
| 2011 | $445 | $410 | $395 | $373 |
| 2012 | $482 | $443 | $426 | $409 |
| 2013 | $496 | $467 | $446 | $426 |
| 2014 | $465 | $434 | $421 | $412 |
| 2015 | $442 | $422 | $405 | $401 |
| 2016 | $439 | $423 | $411 | $402 |
| 2017 | $432 | $427 | $419 | $404 |
| 2018 | $417 | $422 | $416 | $406 |
| 2019 | $409 | $421 | $415 | $396 |
| 2020 | $427 | $443 | $430 | $407 |
| 2021 | $482 | $499 | $480 | $453 |
| 2022 | $532 | $541 | $519 | $499 |
| 2023 | $562 | $574 | $543 | $530 |
| 2024 | $589 | $606 | $568 | $553 |
| Change (1990 – 2024) | 7.07% | 6.13% | 5.25% | 4.69% |
| Change (2014 – 2024) | 2.41% | 3.39% | 3.05% | 2.97% |
We can see that, if we look strictly over the past 10 years (2014 to 2024), regular flats of all sizes outperformed – or at least matched – the performance of the terraced houses. This may be due to the effect of lease decay, as many of the terraced homes would have entered the last half of their lease between 2014 and the present. On the other hand, regular flats here contains data from younger HDBs.
New rules over CPF usage may also have contributed to this, and will continue to do so.
As of May 2019, the use of CPF monies for housing will be prorated, to the extent to which the remaining lease can cover the youngest buyer to the age of 95. Many HDB terraced houses have less than 50 years on the lease, so this rule is especially significant.
Over the next decade, it will come to the point where there’s limited financing and CPF for this niche group of properties; and the need to pay in cash will significantly limit any form of price appreciation.
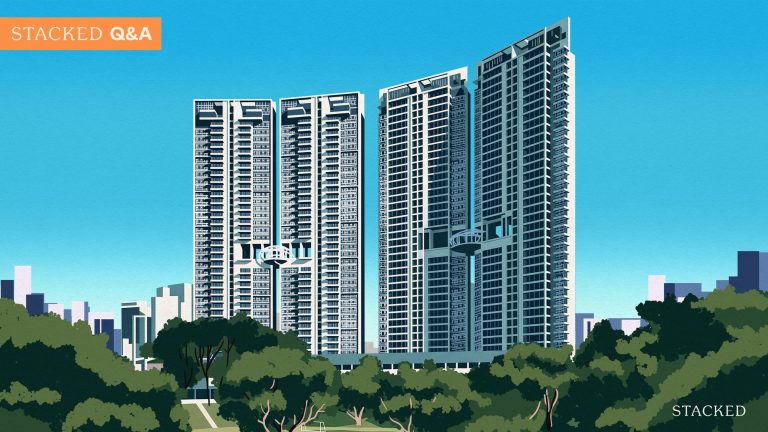
An interesting point of comparison is Executive HDB flats
Some executive flats can match the HDB terraced houses for spaciousness; and they might be a strong alternative.
If we look at the performance from 1990 through to the present, HDB landed has outperformed executive flats. It’s only in the past 10 years that executive flats have fared better, and this is again an issue of age: while executive flats can also be old, few come close to the age of ’50s-era terrace houses.
So if all you want is more room, it’s worth considering if you should just get an executive flat versus an HDB landed home.
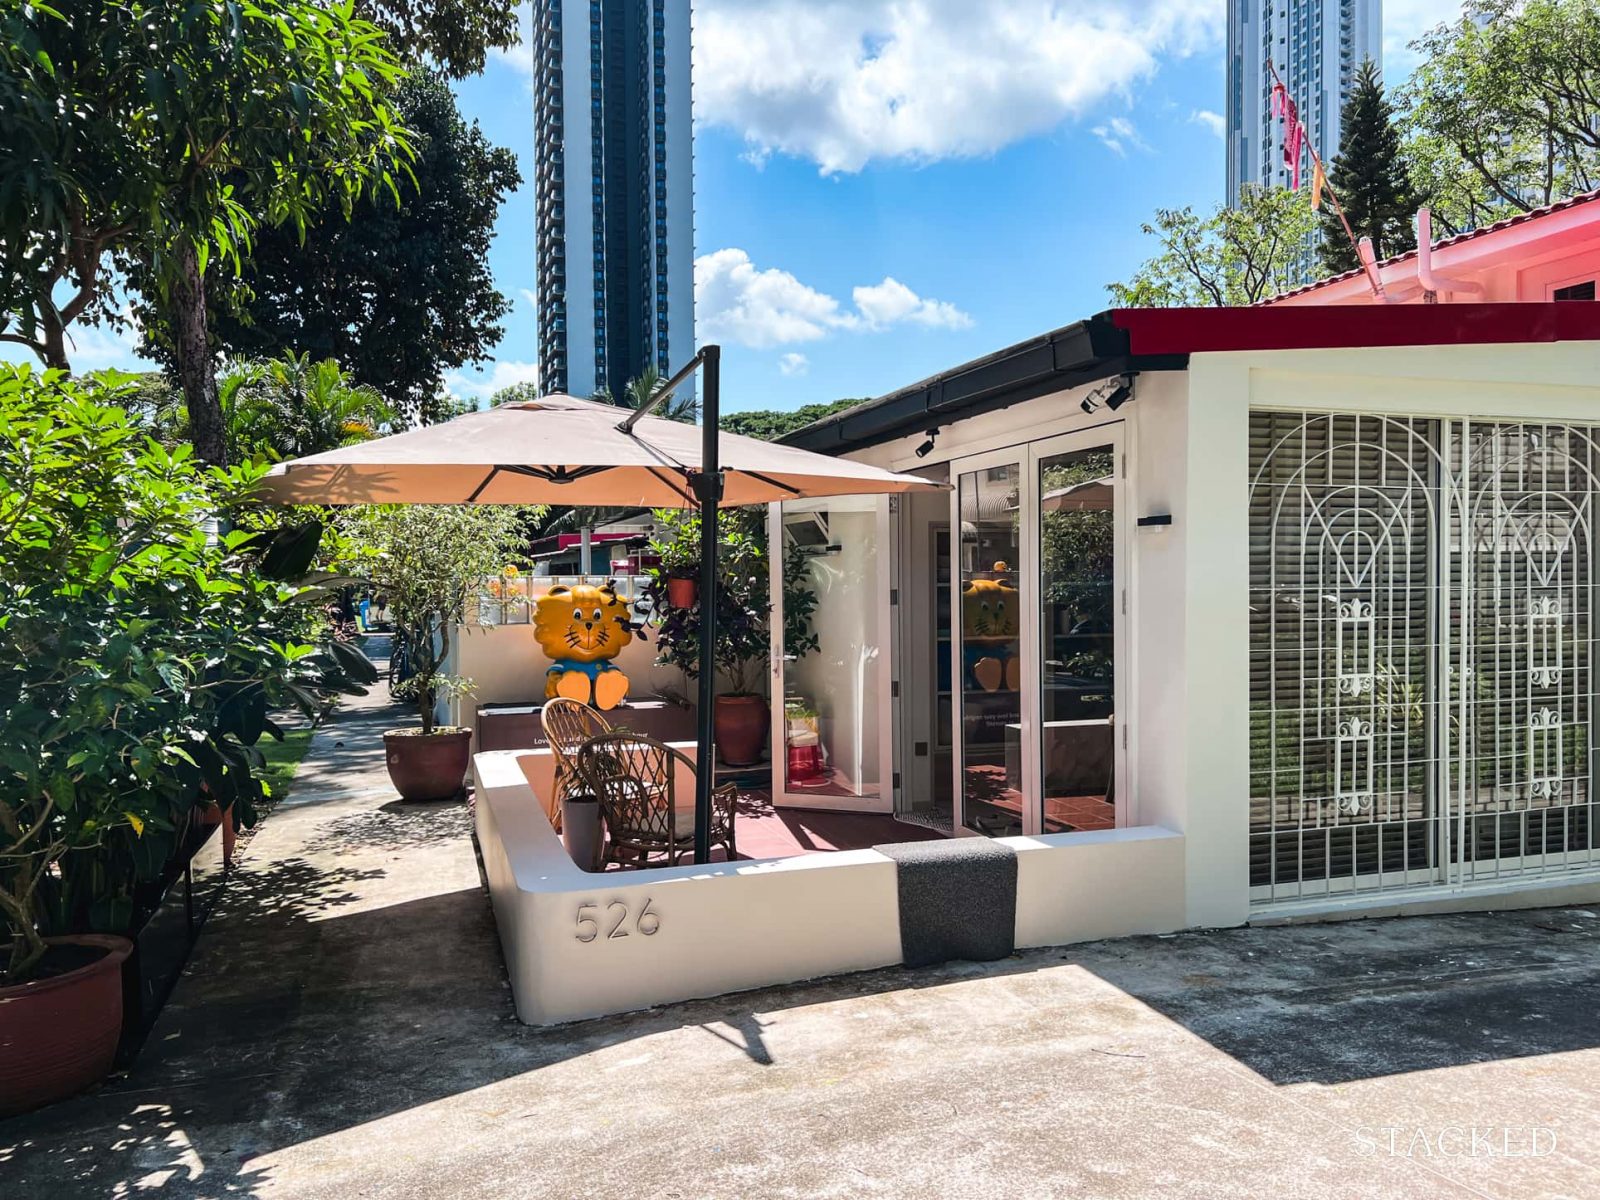
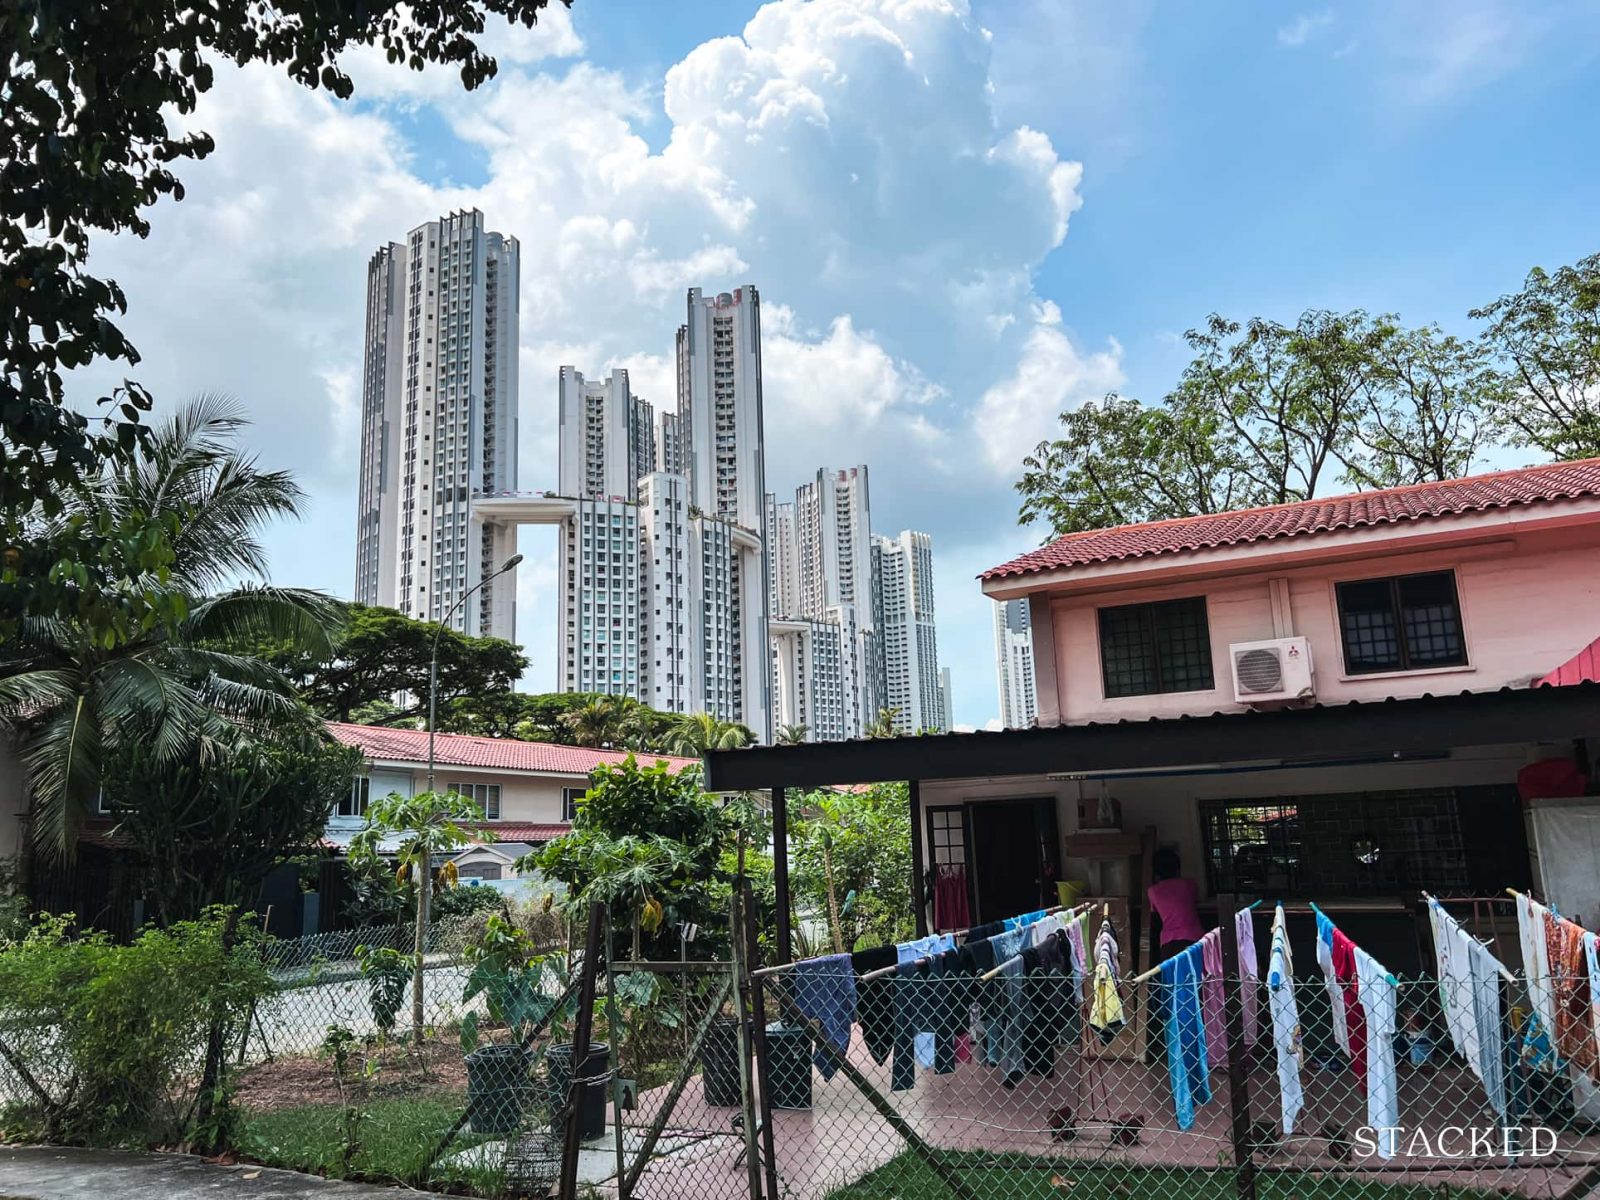
HDB landed homes fulfill a role outside of financial concerns
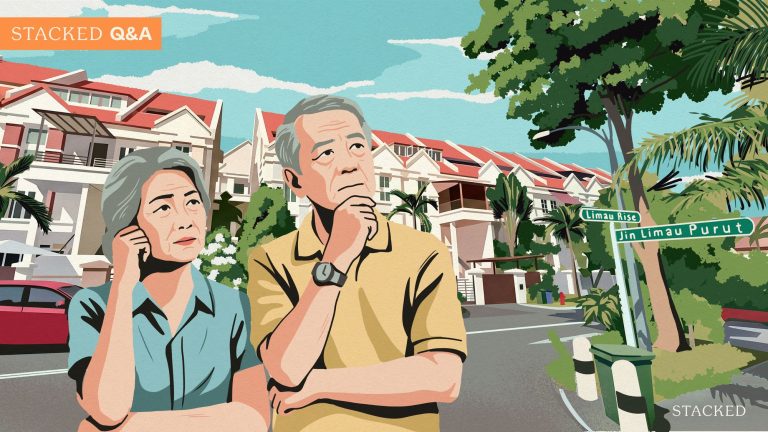
Speaking to some realtors, they noted that HDB landed homes are best purchased for those who aren’t too focused on resale gains (e.g., retirees who are certain it’s their last stop.)
If all you want is to do your own gardening, live in a less densely populated area, or own pets that will never fit in a flat, HDB landed may be a more sensible choice than buying a private landed home, which may be more than twice the price. But as of 2024, we may be looking at the last generation of HDB terraced house owners who can still expect some kind of gain; and it likely won’t be much if they hold for longer.
For more on the Singapore property market, be it HDB or private, follow us on Stacked. If you’d like an in-depth consultation on your property goals, feel free to reach out to us here.
Commentary like this is useful for understanding the broader market. The harder part is applying those ideas to a specific property, budget or decision you’re actually considering.
That’s often where a second opinion becomes valuable.
If you’d like to discuss how this applies to your own circumstances, you can reach out for a one-to-one consultation here.
And if you simply have a question or want to share a thought, feel free to write to us at stories@stackedhomes.com. We read every message.
0 Comments