


Supply and demand – it’s basic economics.

It’s the reason why Hermes can sell $10,000 Birkin bags (which may sound incredulous to some), and yet still garner a long waiting list along with a booming resale market.
Or why certain limited edition sneakers like Nike Air Jordans can enable some to rake in $30,000 a month in sales flipping these prized products.
It all boils down to simply having more demand than supply.
In the context of the housing market, it is because of supply and demand that contributes to the fluctuations in the property cycle.
When supply is unable to keep up with demand, prices will increase. It makes perfect sense – if more people have demand for homes, then they are willing to pay more for it (just like the above examples).
Of course, there is a limit to how much prices can actually increase by – demand will drop correspondingly as affordability decreases.
So why is knowing the supply and demand of real estate in Singapore important?
As an example, say you are looking for a 1 bedroom investment in the Kallang area.
You work out the gross rental yield to be slightly over 3% – it’s not too shabby at all, right?
But what if you have additional information that a mega new launch will be announced shortly, and that it will add a supply of 2,000 1 bedroom units to the area – would knowing that prior change your purchasing decision?
No doubt, everyone should be answering yes at this point.
It is painfully obvious – knowing the demand and supply is a crucial part in your property purchasing decision.
Now that we have established the why, let me show you 4 ways to find out the supply and demand of a location.
The challenge for many buyers today isn't access to information.
It's interpreting that information in a way that makes sense for their finances, goals, and stage of life.
Over time, that's also why we decided to work with agents who shared the same data-driven and advisory-led approach behind our editorial, consultants who could help readers think through decisions more objectively, rather than simply push transactions.
Today, the team has worked with more than 2,000 clients across over $5B in property transactions.
1.Supply and demand – price point
The most obvious way to find out the potential supply and demand of an area is to look at the number of units there are for the unit type you are looking at.
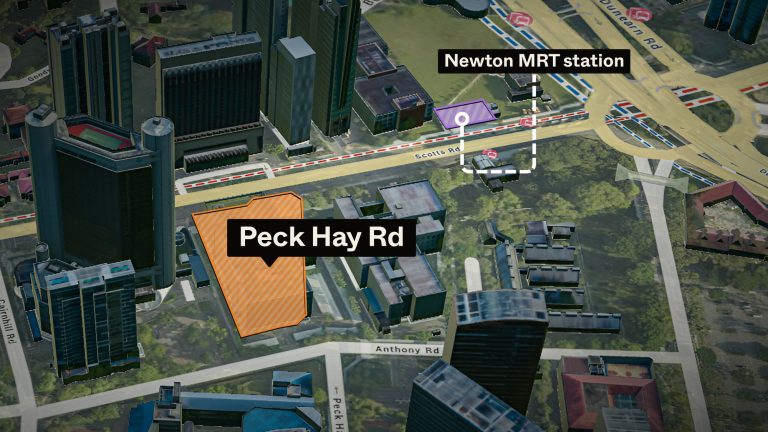
So let’s say you are looking at a 3 bedroom unit at Newton, knowing the total number of 3 bedders in the area as compared to the other unit types will definitely give you a good indication of the current supply in the area.
Unfortunately, there’s no shortcut to that – it is pure manual work of taking the time to search for the surrounding developments to look up for the unit mix of each individual development.
The easiest way would be to use Street Directory to find the surrounding condos.
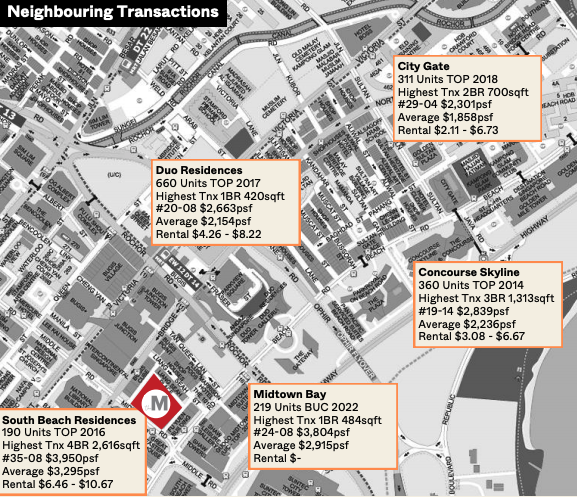
Once you’ve gathered the list of developments, you can now gauge the number of units each unit type holds in the development.
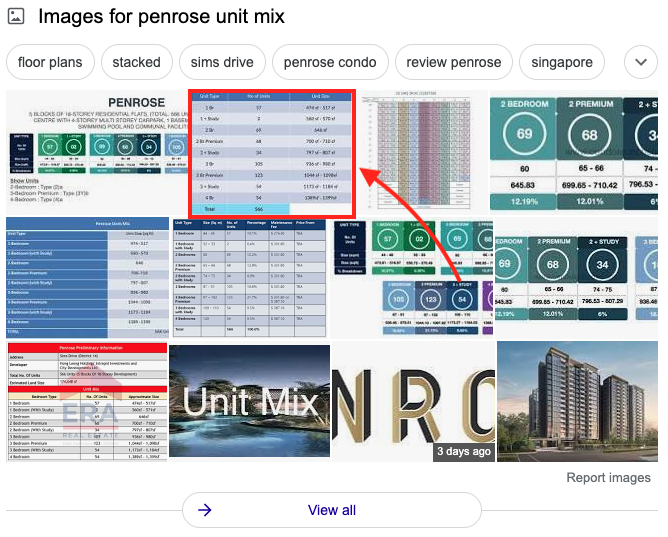
For newer developments, I would suggest doing a quick Google search instead. There will usually be a number of sites showing the unit mix, which makes your job a lot easier.
But for older developments, the task at hand gets more complicated – the best way would be to use a tool like Square Foot to determine the breakdown.
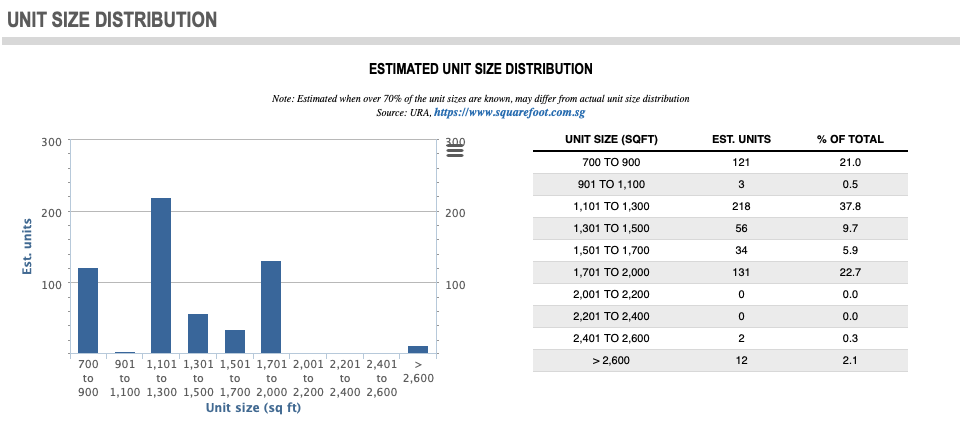
That said, while Square Foot does show the breakdown, it is by unit size, not unit type.
So if you really want to be accurate about it, you’d need to search via PropertyGuru listings for the size and match it up to the unit type.
I’m not going to sugar coat it – it can be an extremely tedious job.
The good news is, there is another way to look at it – if you are viewing it from an entry price perspective.
Ryan has covered it quite comprehensively in his Kopar case study, which you can view here.
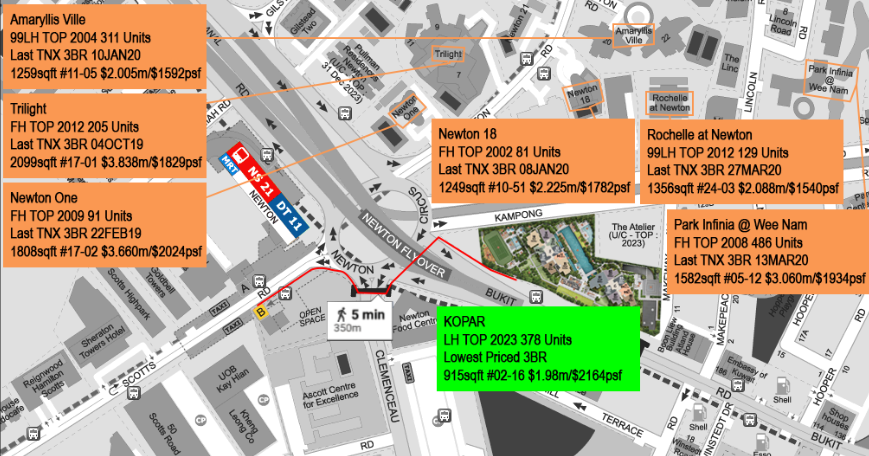
So with that same list of developments in the vicinity, find the price point of each of the 3 bedroom units in each development.
Depending on your exit strategy, you’d want to come in at close to, if not the lowest entry price for a 3 bedroom unit in the area.
Now we’ve gotten the first one out of the way, let’s move on to the next – listing demand.
2. Supply and demand – listing demand
*Let me just preface this by saying that this (very sadly) is not available to consumers. You will need an agent account to get access to the data. While it would be nice to have this available to everyone, it is totally understandable that this is also only available for agents, given the high prices they are paying for PropertyGuru. On a more positive note, now that you know about this, do ask your agent about it!
**Also I would like to say (before you even think of it), this is not a sponsored ad by PropertyGuru in any shape or form. I honestly dislike their browsing experience as a buyer, but you can’t deny the influence they have on the market.
It’s safe to say that PropertyGuru has the real estate market in Singapore dominated.
Search for any property in Singapore, and you’ll find that they will come in the first top 3 results on Google – it is basically an SEO expert’s dream.
It is also the main reason why they can keep increasing their listing prices with agents. And while agents can make all the noise they want, the truth is that PropertyGuru is still an indispensable tool when it comes to marketing.
So because PropertyGuru has the lion share of searches, what this means for us is that there will be a ton of insights to take away from all that data.
PropertyGuru actually has a market supply gap tool that shows you the demand and supply for properties in an area from a listing perspective (supply) and the searches for the area (demand).
Again, knowing data like this can come in very handy.
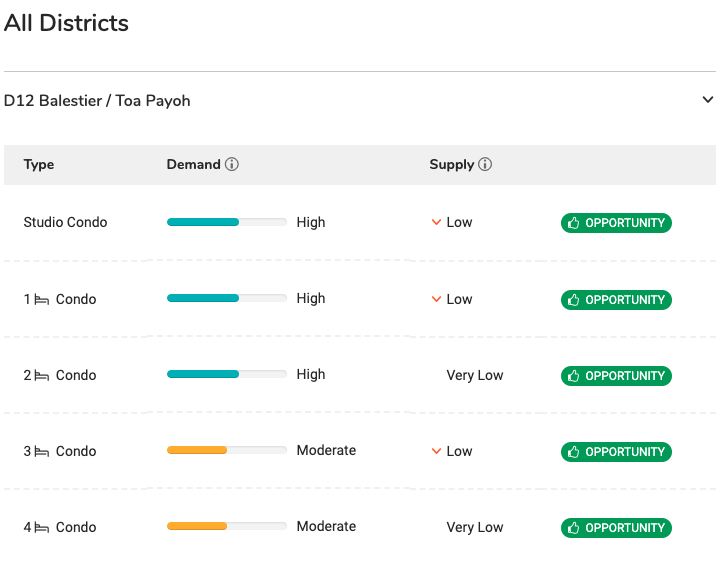
Let’s say in this example of District 12 (Balestier/Toa Payoh), demand is shown to be high for a 1 bedroom condo, but the current supply of listings is low.
From a buyer perspective, this might not be great news for you as this means that there would be increased competition for the current supply in the area.
Conversely, sellers of a 1 bedroom condo in that area would be much happier upon seeing this as there is a high demand but low supply.
3. Supply and demand – rental
Likewise to the above, knowing the rental demand for property in the area can be an important determining factor for investors.
So while rental yield is undoubtedly a crucial metric, rentability is also something that you absolutely have to consider.
With the PropertyGuru market supply gap tool, you can see the demand and supply from a rental perspective as well.
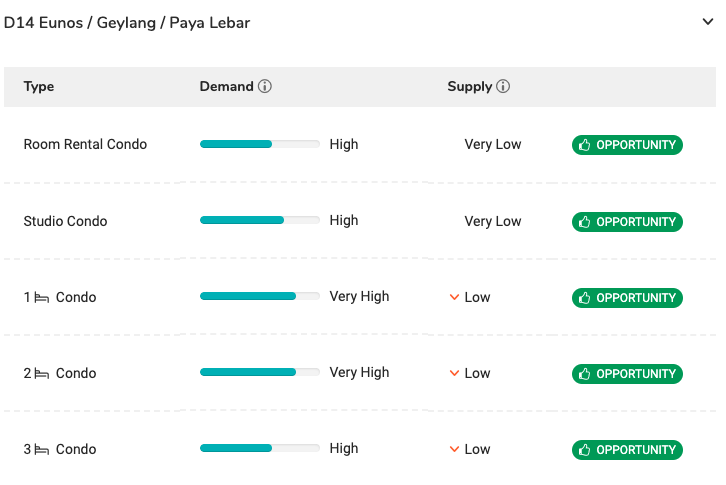
Again, if you were to look at the 1 bedroom situation in District 14 (Eunos/Geylang/Paya Lebar), you’d see that the searches are very high (demand), and the available listings are very low (supply).
Like the above, this information is only available as a paid option for agents.
But there is another option of determining the rental demand – although I’d have to admit, has very obvious flaws.
So as a very crude fashion of looking at the rental demand, you can utilise the number of listings at any given moment on PropertyGuru as a benchmark.
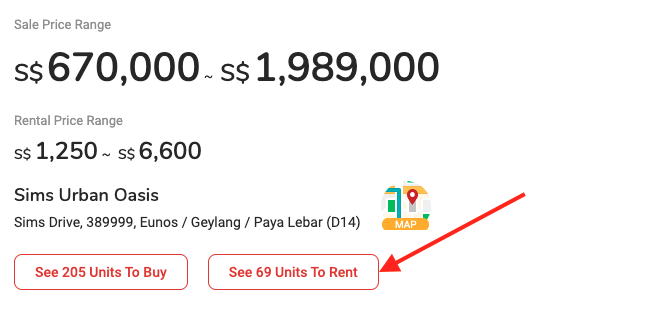
For example, Sims Urban Oasis currently has 69 unit listings for rent. Take that divided by the number of units (1,024), and you get a 6.7% vacancy rate. Given the current vacancy rate in Singapore of 5.4% (as of 2Q2020), you could say that Sims Urban Oasis isn’t performing too well in the rental market.
But, as mentioned, this method has its flaws.
First, there is a seasonality to rental that is not accounted for here.
To illustrate, October could be a period that just so happened to have many tenancies that have expired and have to be put up on the market for rent. The current numbers on PropertyGuru will not account for how quick the turnover time actually is.
Also, another big problem with PropertyGuru is the number of duplicate listings. I have come across a single property being listed with 5 or 6 different agents, and obviously a high number of duplicates can have a huge bearing on the data that you see here.
So by that example, if half of the listings for Sims Urban Oasis were duplicates, you would be looking at a vacancy rate of 3.4% instead. It goes without saying – it is a significant difference.
4. Supply and demand – population
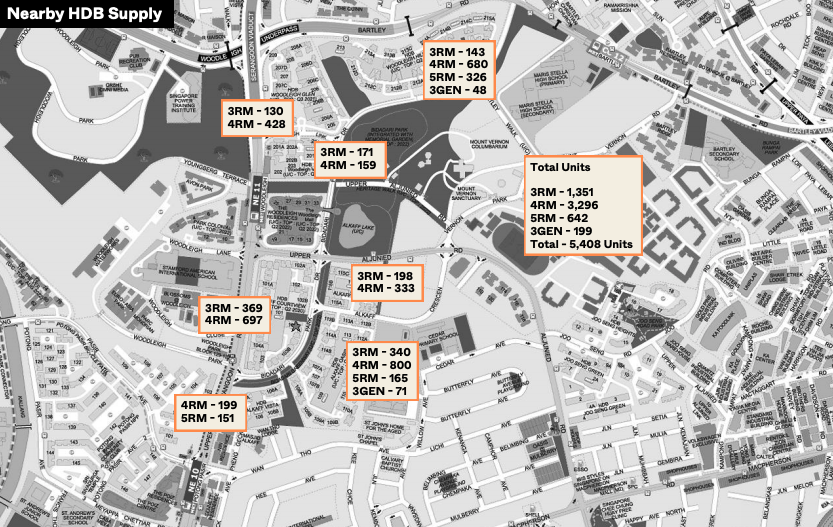
The last way to ascertain supply and demand of an area is through the upcoming supply and current population of the vicinity that you are looking at.
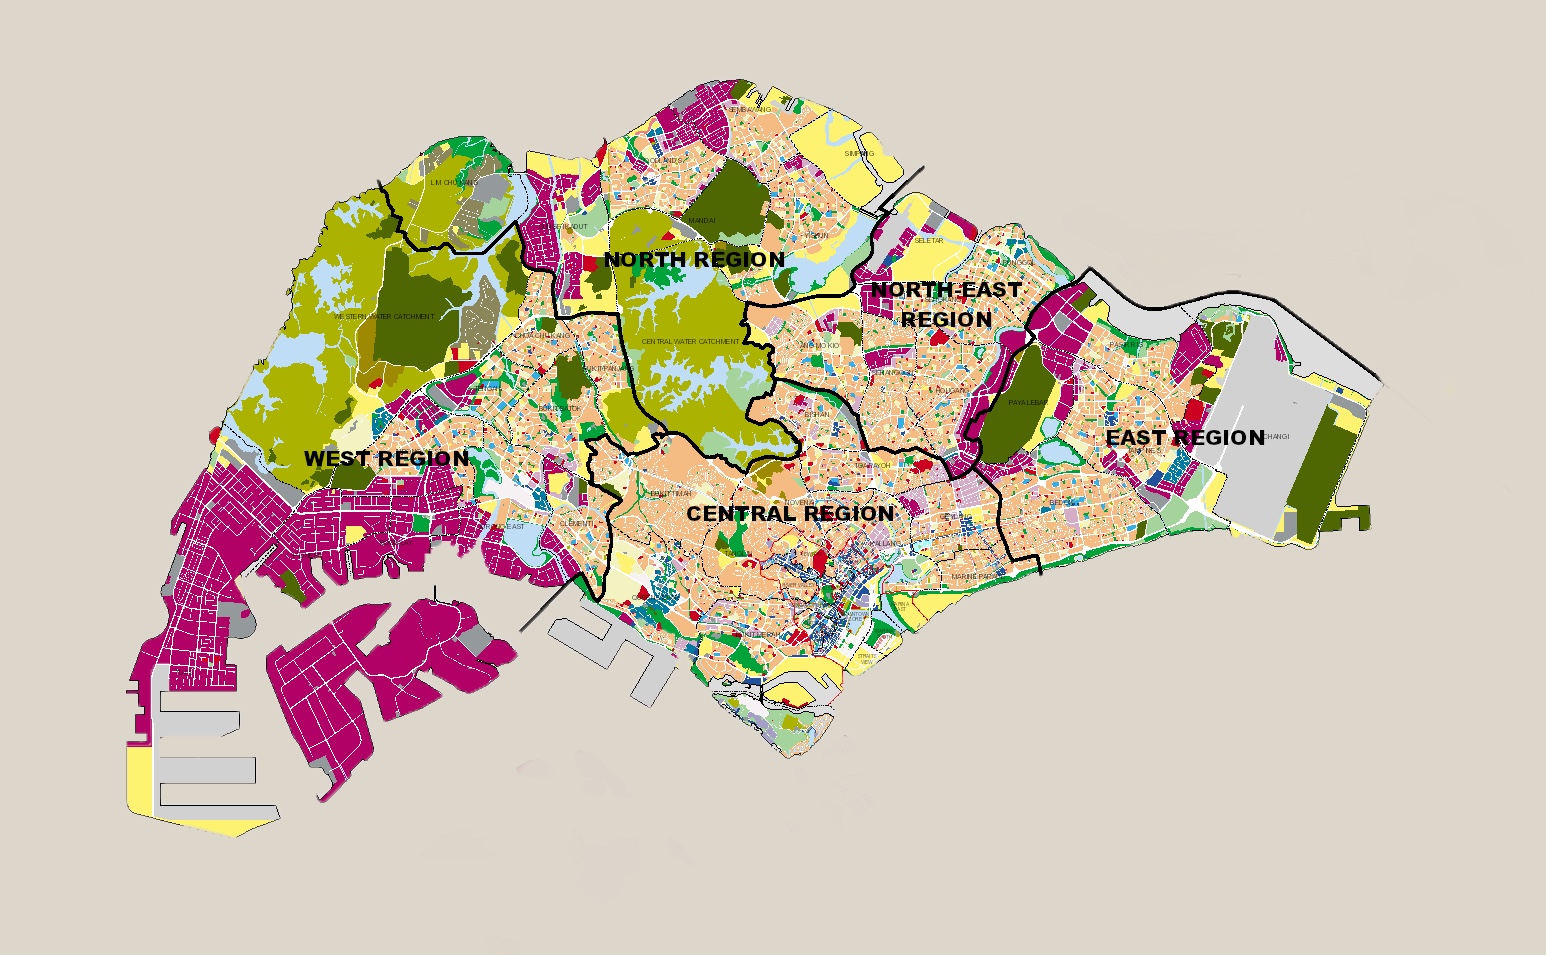
So the simplest way to see the upcoming supply is through the URA website, more specifically – the private residential projects in the pipeline page.
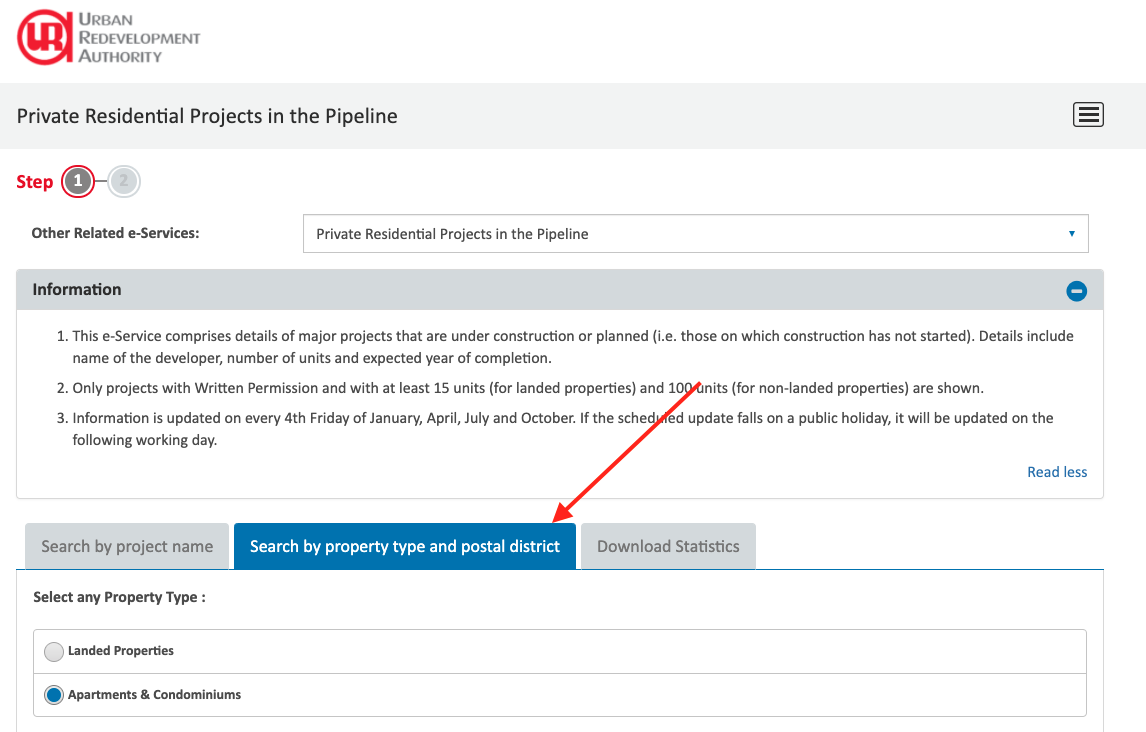
Select the property type, and then the postal district that you are looking at.
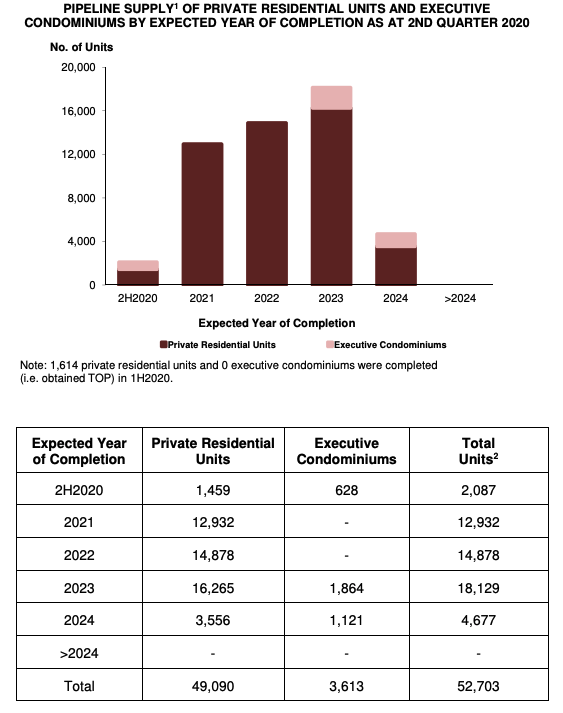
Alternatively, you can search for the pipeline supply by quarters, so the latest data would be for Q2, 2020.
That said, that’s just the upcoming supply, what about the demand?
Although again, this isn’t the most comprehensive way (also because it doesn’t account for foreign demand), but an additional way of finding out the potential support is through the population of the area.
You can get all this data from the Singstat website.
| Area | Condominiums and Other Apartments | Total HDB | Landed Properties | Others | Grand Total |
| Ang Mo Kio | 13,880 | 133,260 | 16,070 | 1,220 | 164,430 |
| Bedok | 54,430 | 178,590 | 44,230 | 2,720 | 279,970 |
| Bishan | 16,730 | 60,380 | 10,450 | 670 | 88,230 |
| Bukit Batok | 26,440 | 121,010 | 5,900 | 790 | 154,140 |
| Bukit Merah | 13,340 | 137,620 | 440 | 1,200 | 152,600 |
| Bukit Panjang | 18,880 | 117,480 | 3,240 | 100 | 139,700 |
| Bukit Timah | 36,840 | 7,170 | 32,840 | 870 | 77,720 |
| Changi | 0 | 370 | 330 | 1,090 | 1,790 |
| Choa Chu Kang | 21,360 | 166,730 | 2,450 | 560 | 191,100 |
| Clementi | 17,170 | 68,790 | 5,830 | 1,120 | 92,910 |
| Downtown Core | 1,750 | 670 | 0 | 80 | 2,500 |
| Geylang | 19,210 | 82,920 | 6,460 | 1,930 | 110,520 |
| Hougang | 28,120 | 172,190 | 22,530 | 4,270 | 227,110 |
| Jurong East | 6,960 | 71,830 | 0 | 440 | 79,230 |
| Jurong West | 16,740 | 243,380 | 4,300 | 590 | 265,010 |
| Kallang | 18,820 | 80,330 | 1,400 | 1,390 | 101,940 |
| Lim Chu Kang | 0 | 0 | 0 | 70 | 70 |
| Mandai | 1,300 | 0 | 760 | 0 | 2,060 |
| Marine Parade | 17,070 | 19,780 | 9,260 | 340 | 46,450 |
| Museum | 430 | 0 | 0 | 0 | 430 |
| Newton | 7,280 | 0 | 530 | 190 | 8,000 |
| Novena | 18,720 | 22,100 | 7,820 | 750 | 49,390 |
| Orchard | 850 | 0 | 0 | 50 | 900 |
| Outram | 1,040 | 17,480 | 0 | 530 | 19,050 |
| Pasir Ris | 36,450 | 104,080 | 7,180 | 500 | 148,210 |
| Punggol | 21,790 | 148,590 | 310 | 230 | 170,920 |
| Queenstown | 11,620 | 80,210 | 3,410 | 1,230 | 96,470 |
| River Valley | 9,530 | 0 | 650 | 0 | 10,180 |
| Rochor | 2,290 | 10,040 | 10 | 520 | 12,860 |
| Seletar | 0 | 0 | 260 | 0 | 260 |
| Sembawang | 10,090 | 81,550 | 3,740 | 690 | 96,070 |
| Sengkang | 28,870 | 213,730 | 1,560 | 750 | 244,910 |
| Serangoon | 15,260 | 65,010 | 35,420 | 800 | 116,490 |
| Singapore River | 2,870 | 0 | 0 | 70 | 2,940 |
| Southern Islands | 1,220 | 0 | 660 | 0 | 1,880 |
| Sungei Kadut | 0 | 0 | 700 | 0 | 700 |
| Tampines | 26,940 | 224,370 | 4,610 | 1,100 | 257,020 |
| Tanglin | 16,760 | 490 | 4,380 | 80 | 21,710 |
| Toa Payoh | 14,040 | 100,240 | 5,750 | 1,030 | 121,060 |
| Western Water Catchment | 0 | 0 | 0 | 680 | 680 |
| Woodlands | 16,750 | 236,590 | 730 | 930 | 255,000 |
| Yishun | 18,270 | 195,950 | 5,770 | 820 | 220,810 |
The breakdown is actually highly specific – you can find out the population numbers by HDB, condos and apartments, and landed homes. (I’ve taken out the HDB breakdown for easier viewing of the table, if you want the full thing you can email us at stories@stackedhomes.com).
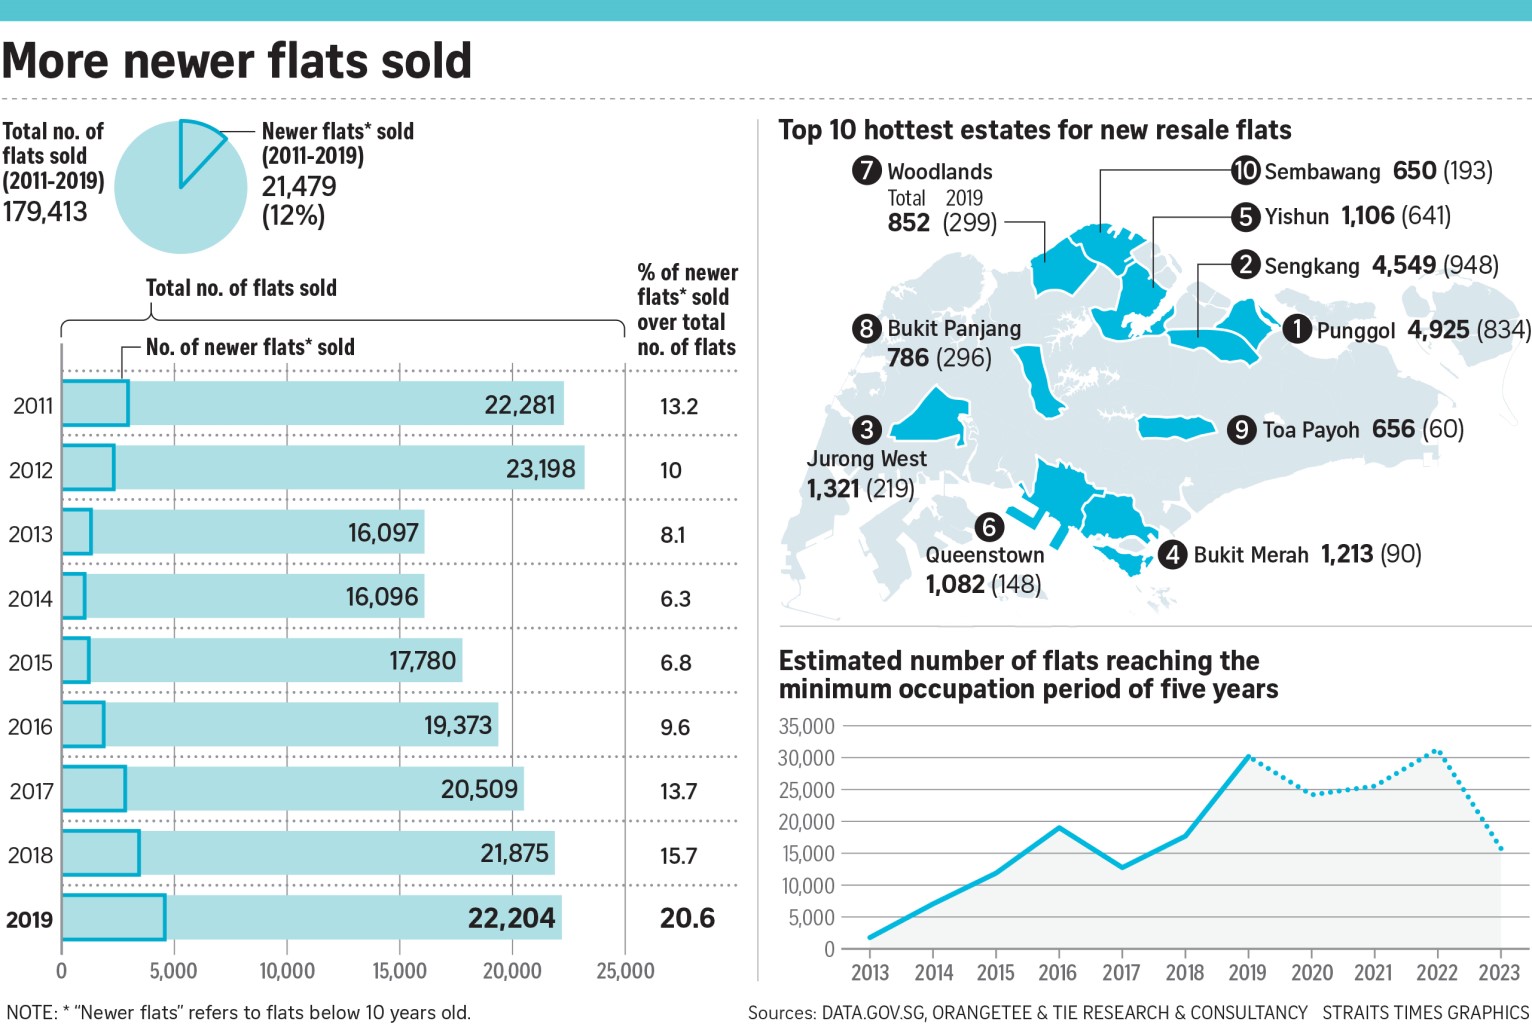
More specifically, however, you would also want to look at the potential number of HDB upgraders. By now, it’s no secret that the number of HDB flats reaching MOP over the next few years is going to be a factor in future condo prices.
Like my very first point, it is a laborious task – but if you really want to be sure – you have to do it.
Final Words
As always, buying a property, whether it is for own stay or investment isn’t a straightforward decision. There are just so many nuances and factors to consider.
But given that this will always be the biggest purchase ever for most people, it is highly worthwhile to put in the time to do the research to eliminate as much risks as possible to come to a well informed decision.
I hope this has gone some way to help you in your property journey, any questions or comments feel free to leave them below or reach out to me at stories@stackedhomes.com!
At Stacked, we like to look beyond the headlines and surface-level numbers, and focus on how things play out in the real world.
If you’d like to discuss how this applies to your own circumstances, you can reach out for a one-to-one consultation here.
And if you simply have a question or want to share a thought, feel free to write to us at stories@stackedhomes.com — we read every message.


2 Comments
Hi Sean, thanks for the article. this is very informative and i’ve learnt a lot. Can you please also share about how we can determine current demand vs supply at certain districts are balanced or over supplied/over demand etc?
i think it can be worked out using number of population vs. number of house units vs. price trends… but I’m not sure how i can gather all information for me to compute.
this will enable buyers to look out for next 2-3years for price trends.