NDP Rally 2025: The 4 Key Housing Takeaways for Singaporeans
Some Singaporeans may have tuned into the NDP Rally expecting more announcements about housing affordability. Instead, the Prime Minister spent much of his 2025 address on global politics and geopolitical shifts. Nonetheless, the Prime Minister did acknowledge that housing is an ongoing concern, saying that:
“Besides jobs, we will continue to focus on areas that matter to young Singaporeans, including housing and parenting. We have made several major moves over the past year. We have built more HDB flats with higher subsidies.”
The PM also noted that Singapore will be “super-aged” by 2026. This is a UN definition, where at least one in five citizens is 65 or older. This is an issue that affects several areas beyond just housing, but it also has significant implications for the property market. Let’s take a look at what we can expect:
Key property changes to look out for:
1. Transformations in the north of Singapore

One of the most concrete housing-related announcements this year was for Kranji, Woodlands, and Sembawang. These areas will undergo extensive transformation, positioning the north of Singapore as the next growth frontier after Punggol.
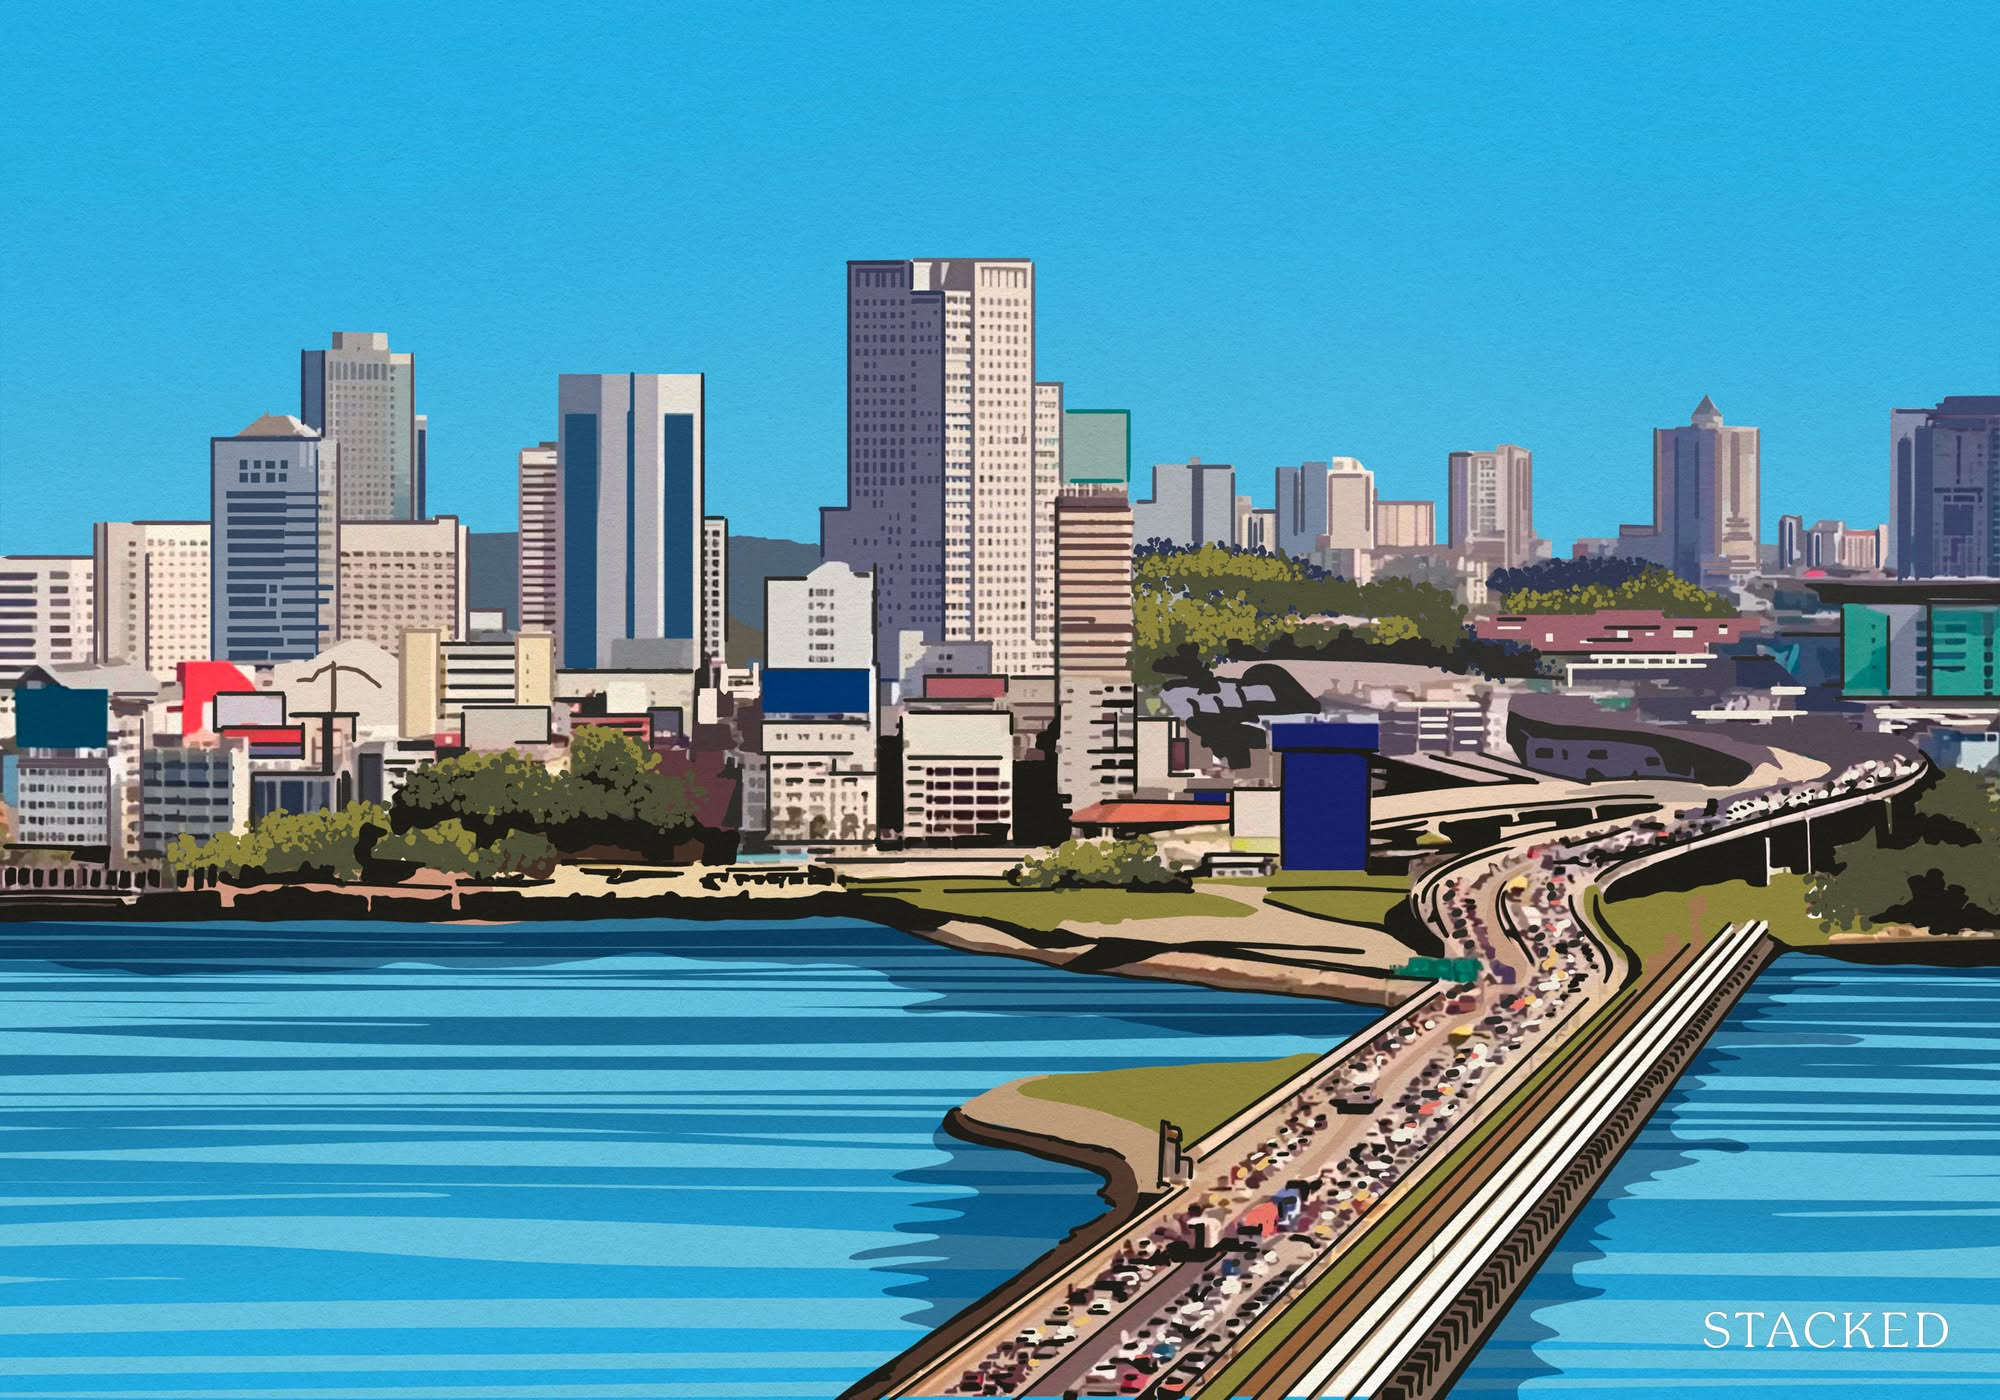
In Woodlands, the focus is on cross-border connectivity and economic vitality. The redevelopment of Woodlands Checkpoint (which will be five times larger) will be alongside the long-awaited RTS Link to Johor Bahru. Around 4,000 new flats will also be introduced, with mixed-use industrial and residential spaces catering to both workers and families.
We’re already seeing renewed interest in Johor area properties, as we explained in this article. The completion of the RTS, as well as a better border crossing in general, can help to amplify the interest. In addition, the residences built here, including the flats, will have an interesting advantage: they may have a strong tenant pool among Malaysian foreign workers, and hence may draw buyers with an investment mindset.
This also applies to existing homeowners in the north; the SEZ with Johor means a likely inflow of cross-border workers, which can raise demand for both rentals and resale flats.
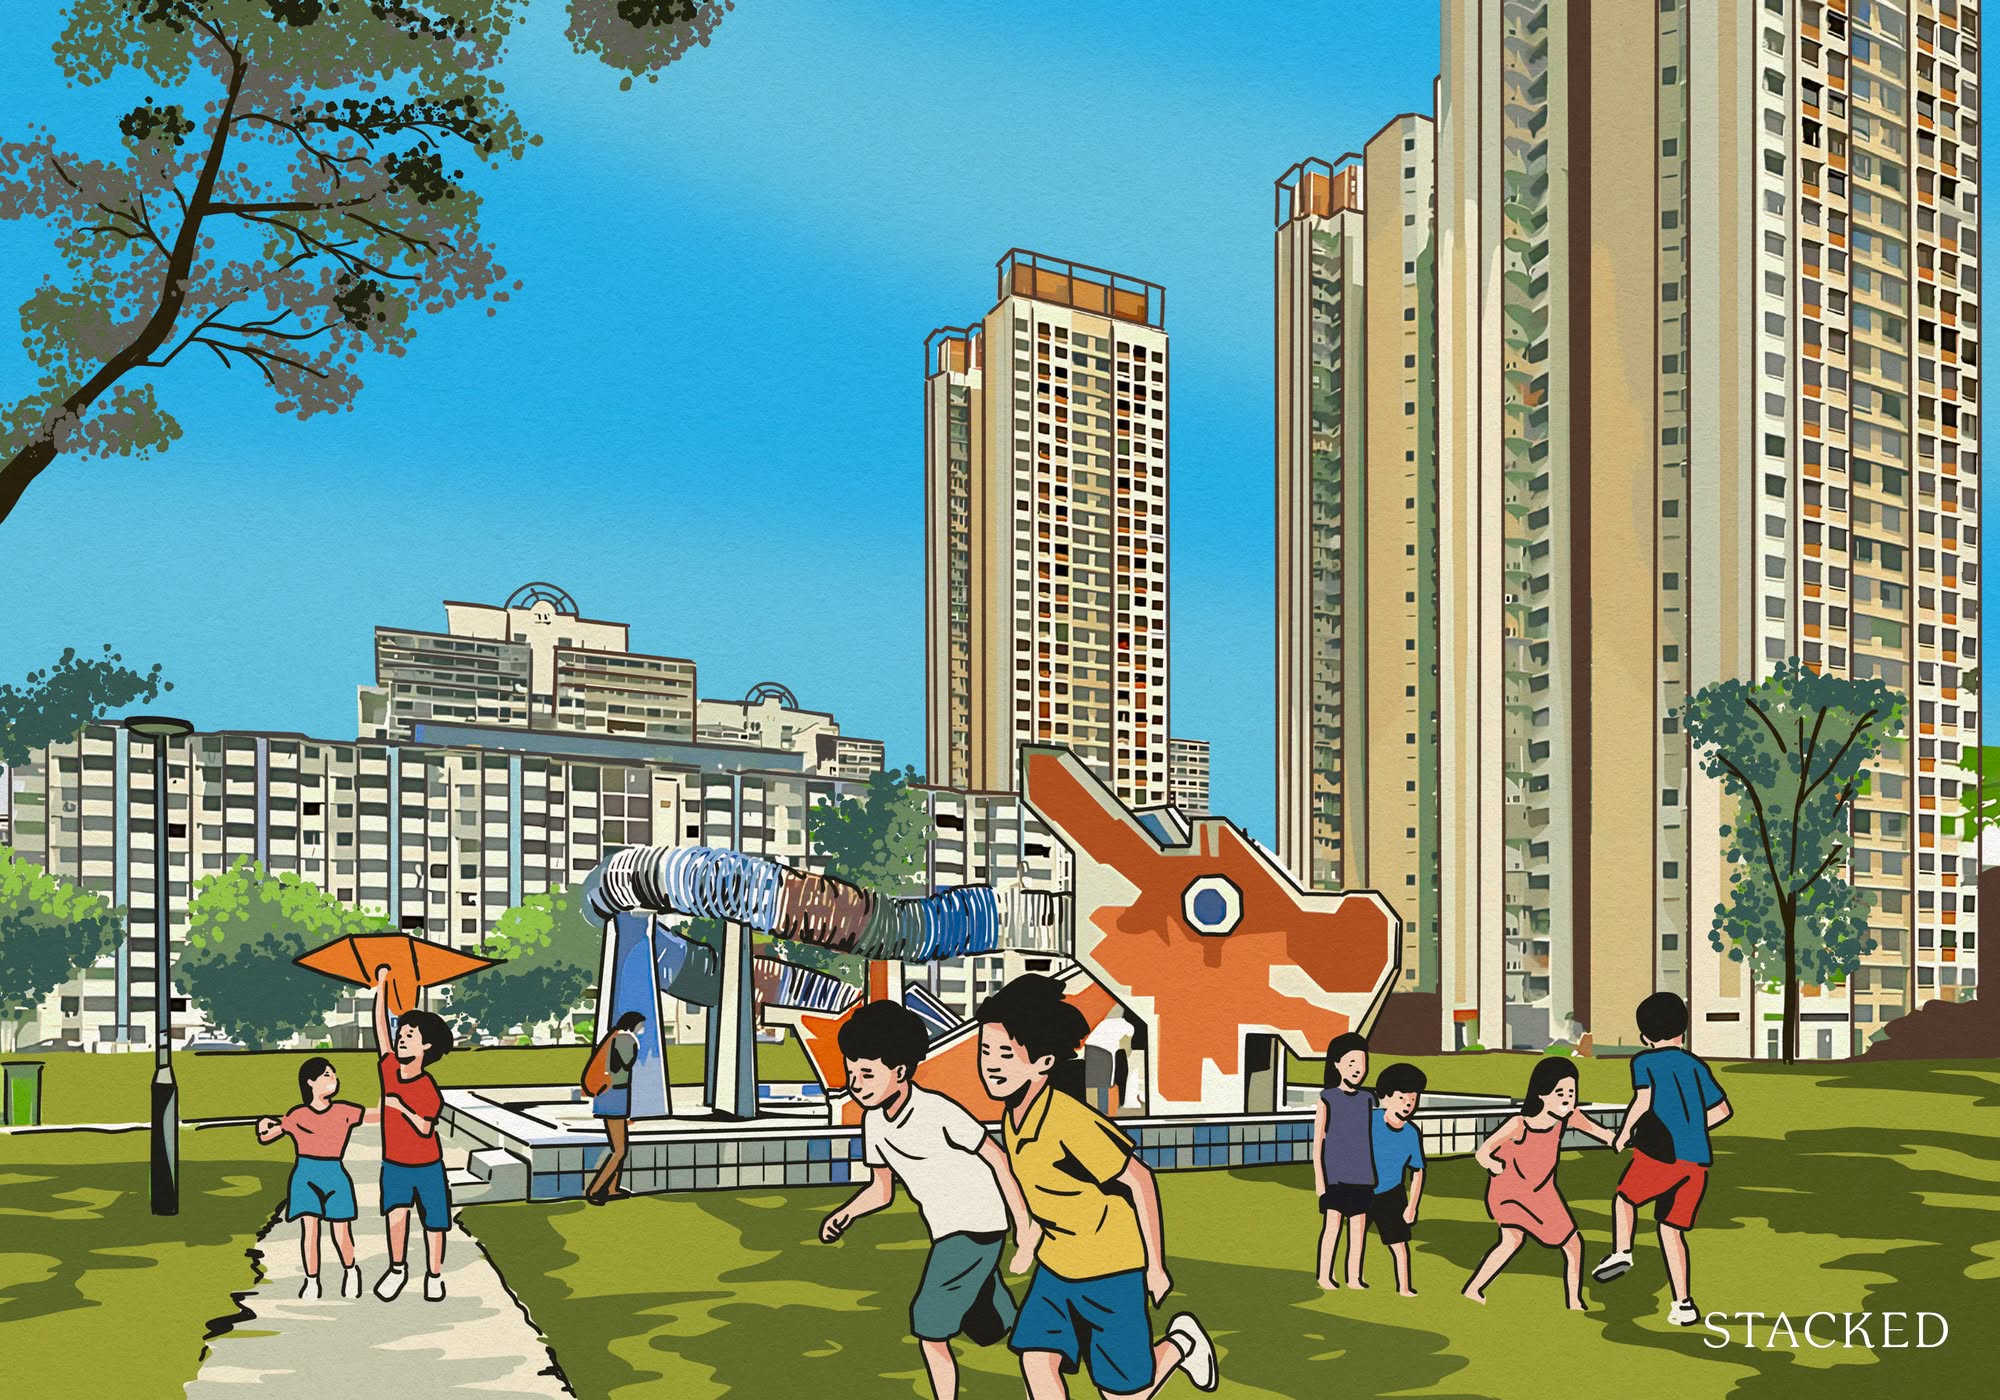
In Kranji, the government will repurpose the land previously used for horse racing into a new township with around 14,000 new homes, which is larger than Bidadari. The area benefits from proximity to the Rail Corridor, Mandai Wildlife Reserve, and a new Sungei Kadut interchange, offering residents both green surroundings and improved transport. This development could turn Kranji into a mix of eco-living and urban convenience, since URA maintains the vision of integrating green corridors.
Existing residents in nearby Choa Chu Kang and Yew Tee may benefit from this, as the development of a new township will add amenities (like malls) that are also beneficial to these neighbours.
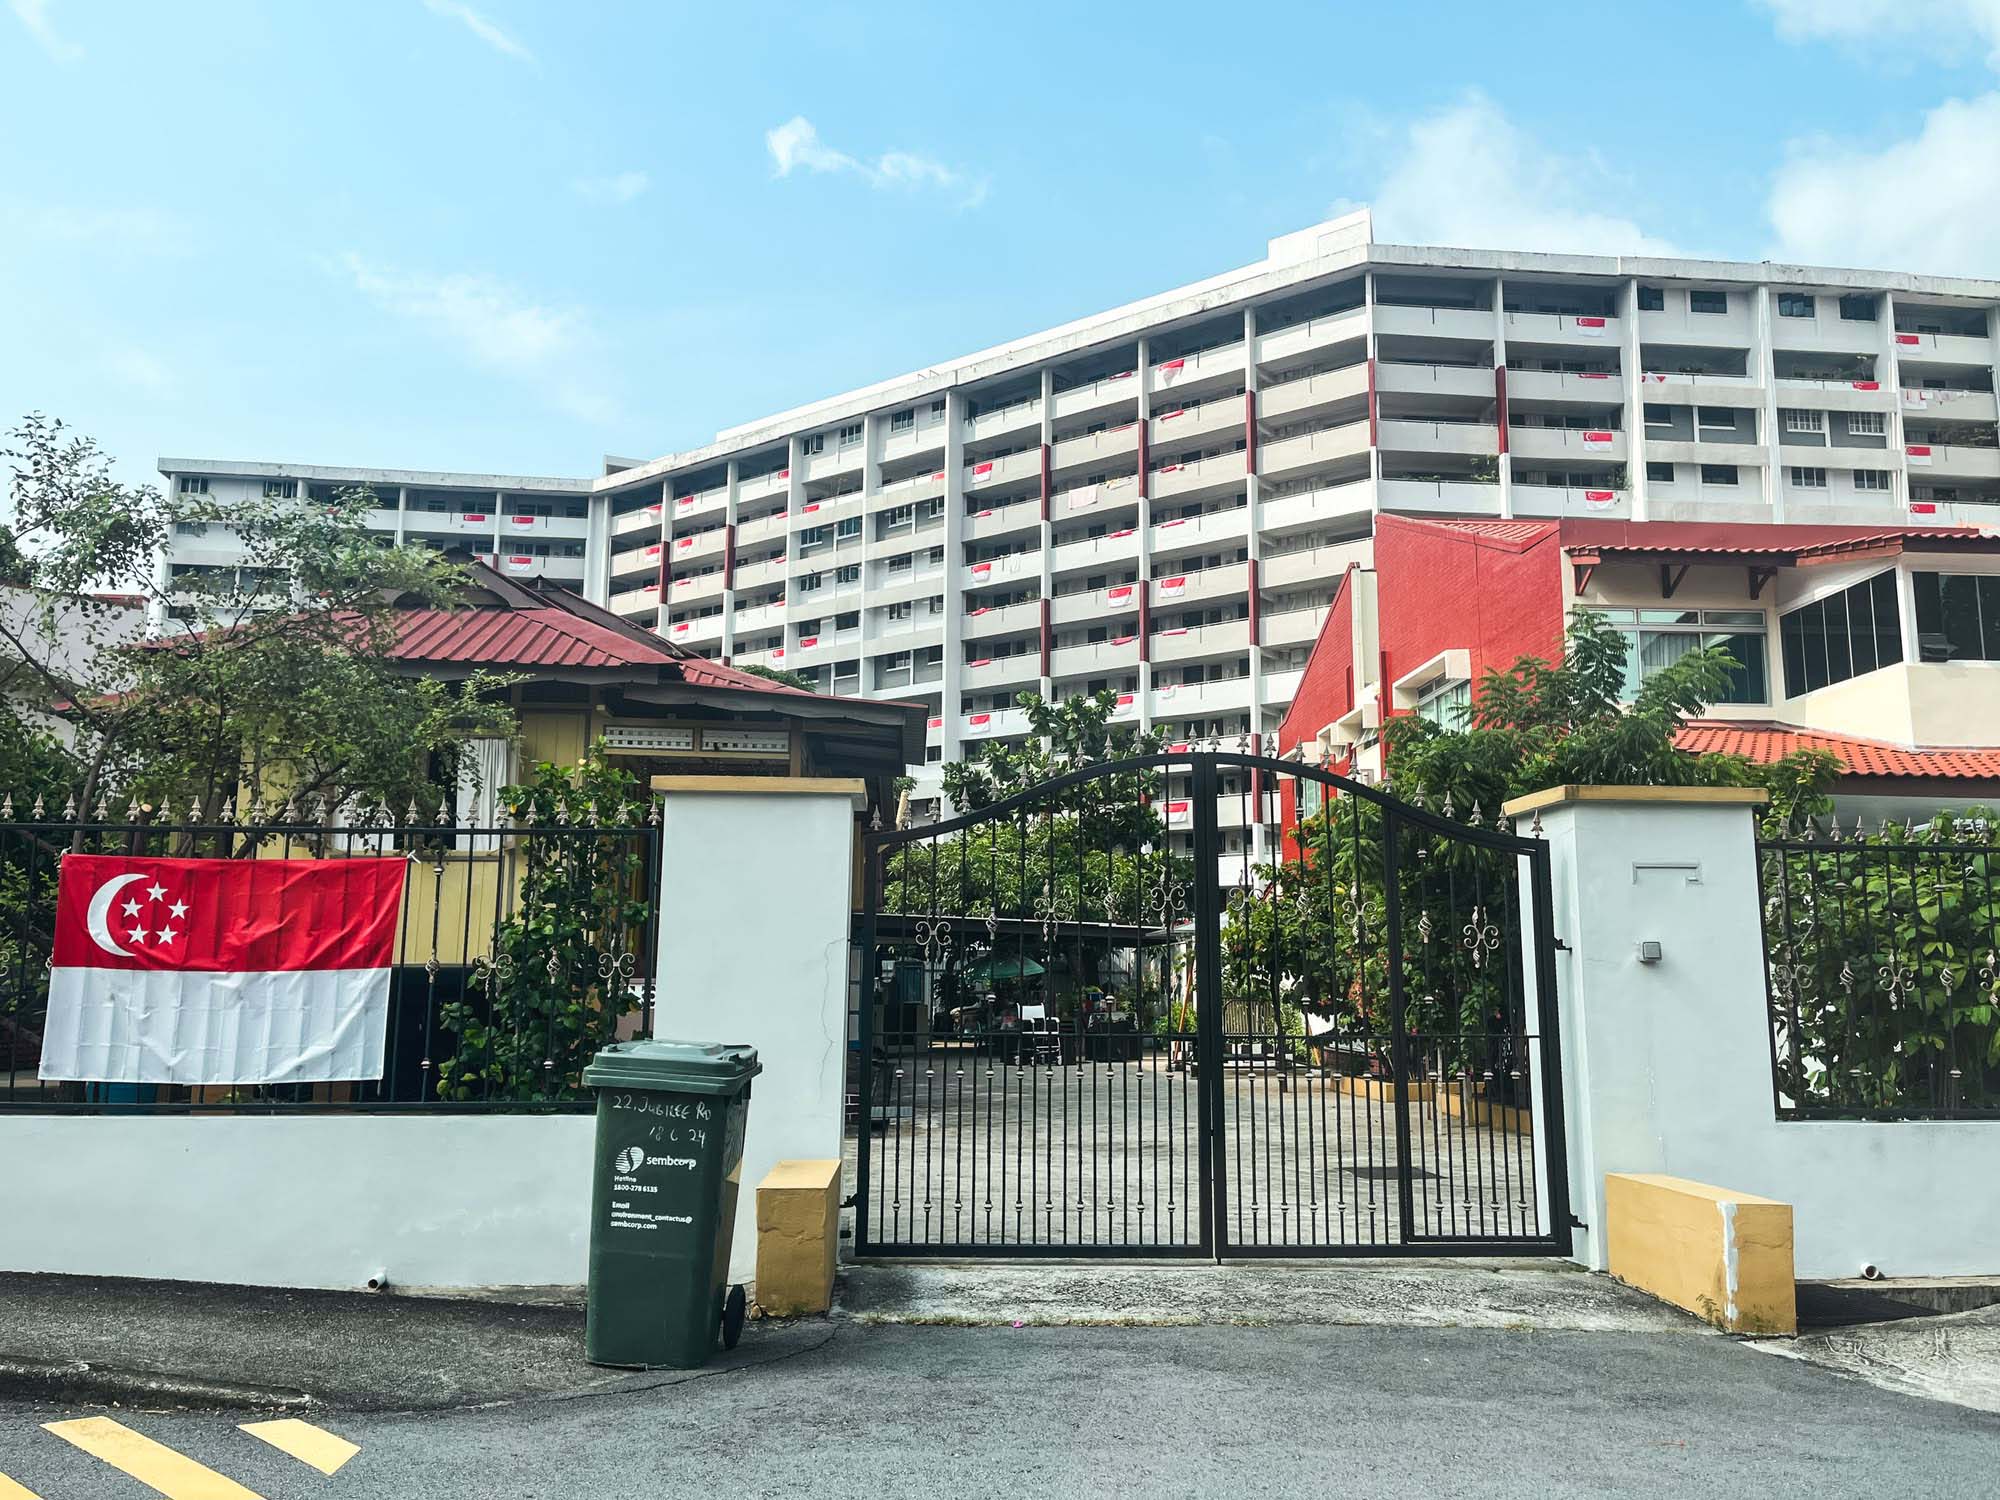
Meanwhile, Sembawang Shipyard will be redeveloped as a waterfront residential and lifestyle hub. There are plans for new homes, dining, retail, and community spaces along the coast; and we can’t help but feel the project echoes the earlier transformation of Punggol Waterway. Sembawang has long been under-appreciated despite its waterfront potential, with many flats transacting at some of the lowest prices in the north.
However, as with Punggol before, residents should brace for a long wait – the full transformation could take 10 to 15 years, so immediate price effects may be muted.
Taken together, these projects represent the government’s long-term pivot toward the north as Singapore’s next centre of gravity. Residents in these areas can expect more amenities, better connectivity, and a gradual uplift in property values, even though the effects may take a decade or more to materialise.
2. Super-aged Singapore and shifts in housing demand
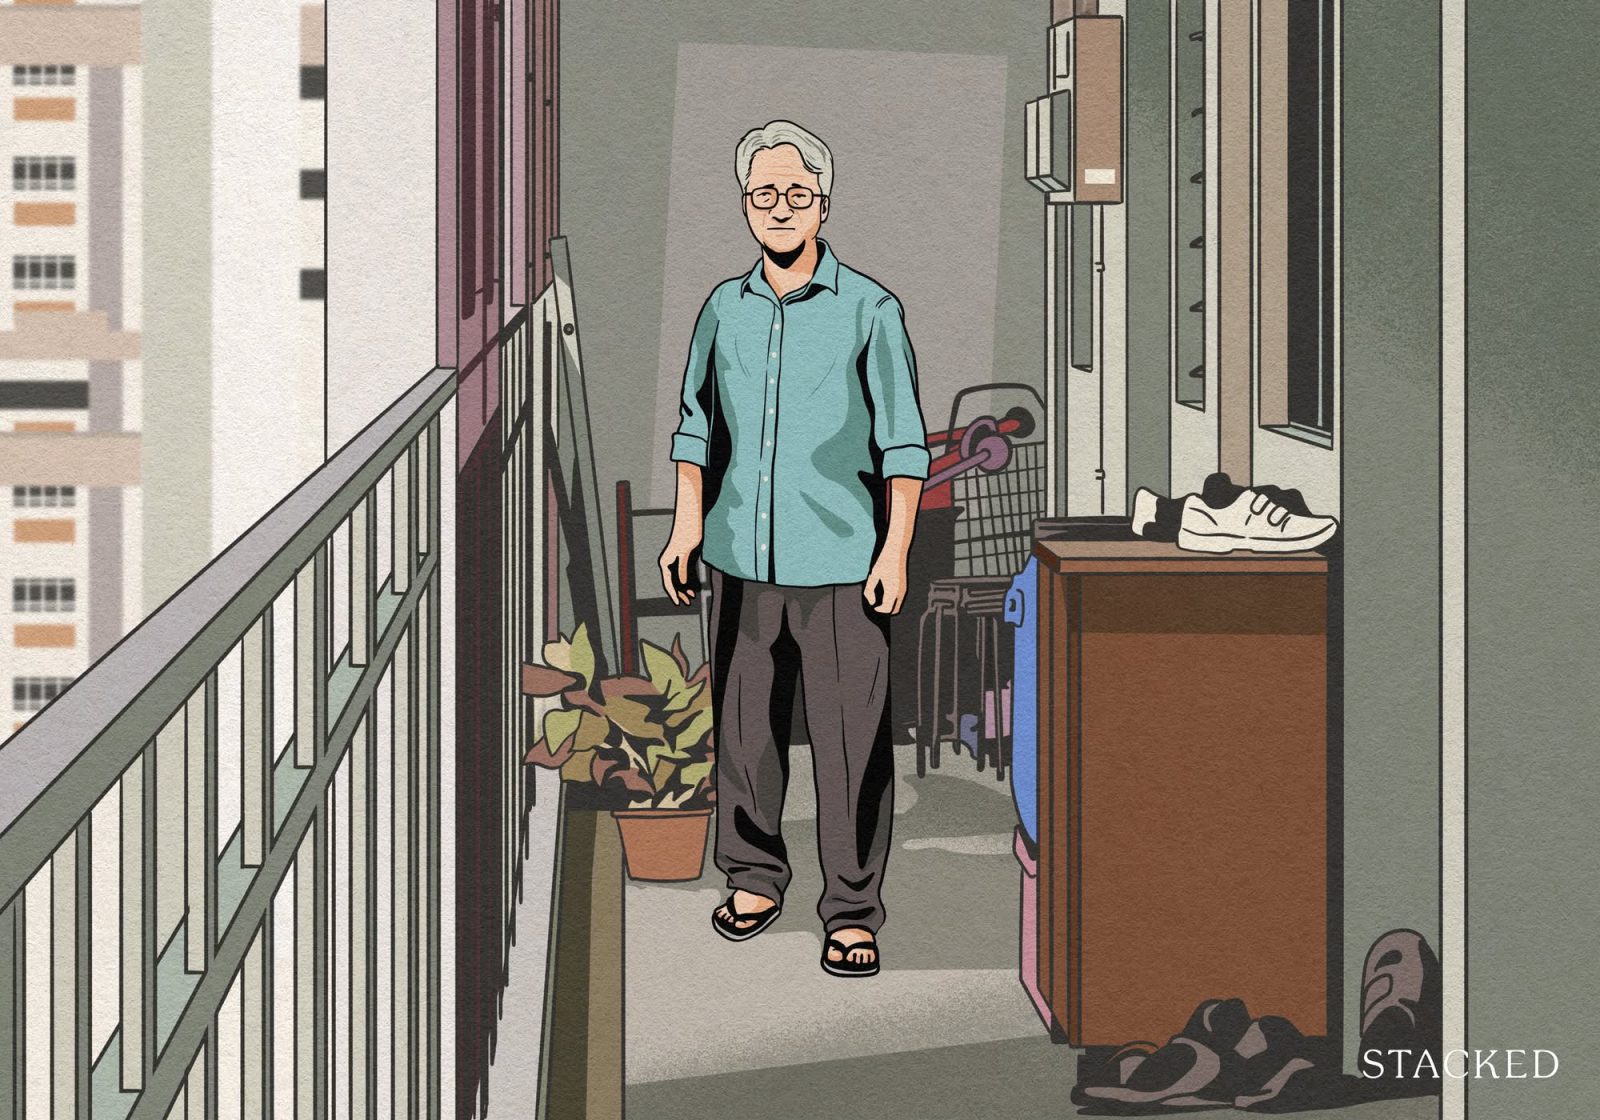
Prime Minister Lawrence Wong flagged that Singapore will cross into “super-aged” status by 2026, meaning that more than one in five citizens will be aged 65 or older. It’s a broad demographic challenge that ties into many things, but let’s consider the more direct implications for the property market.
We have previously mentioned some of the issues here, but besides those issues, we would consider the impact on housing. As we’ve mentioned before, we need to think about how many vacant flats we’ll have when the previous generation passes on. Non-Singaporeans cannot buy these flats, and Singaporeans cannot own more than one HDB flat; so barring a sudden surge in population, we may see the opposite of our current housing shortage.
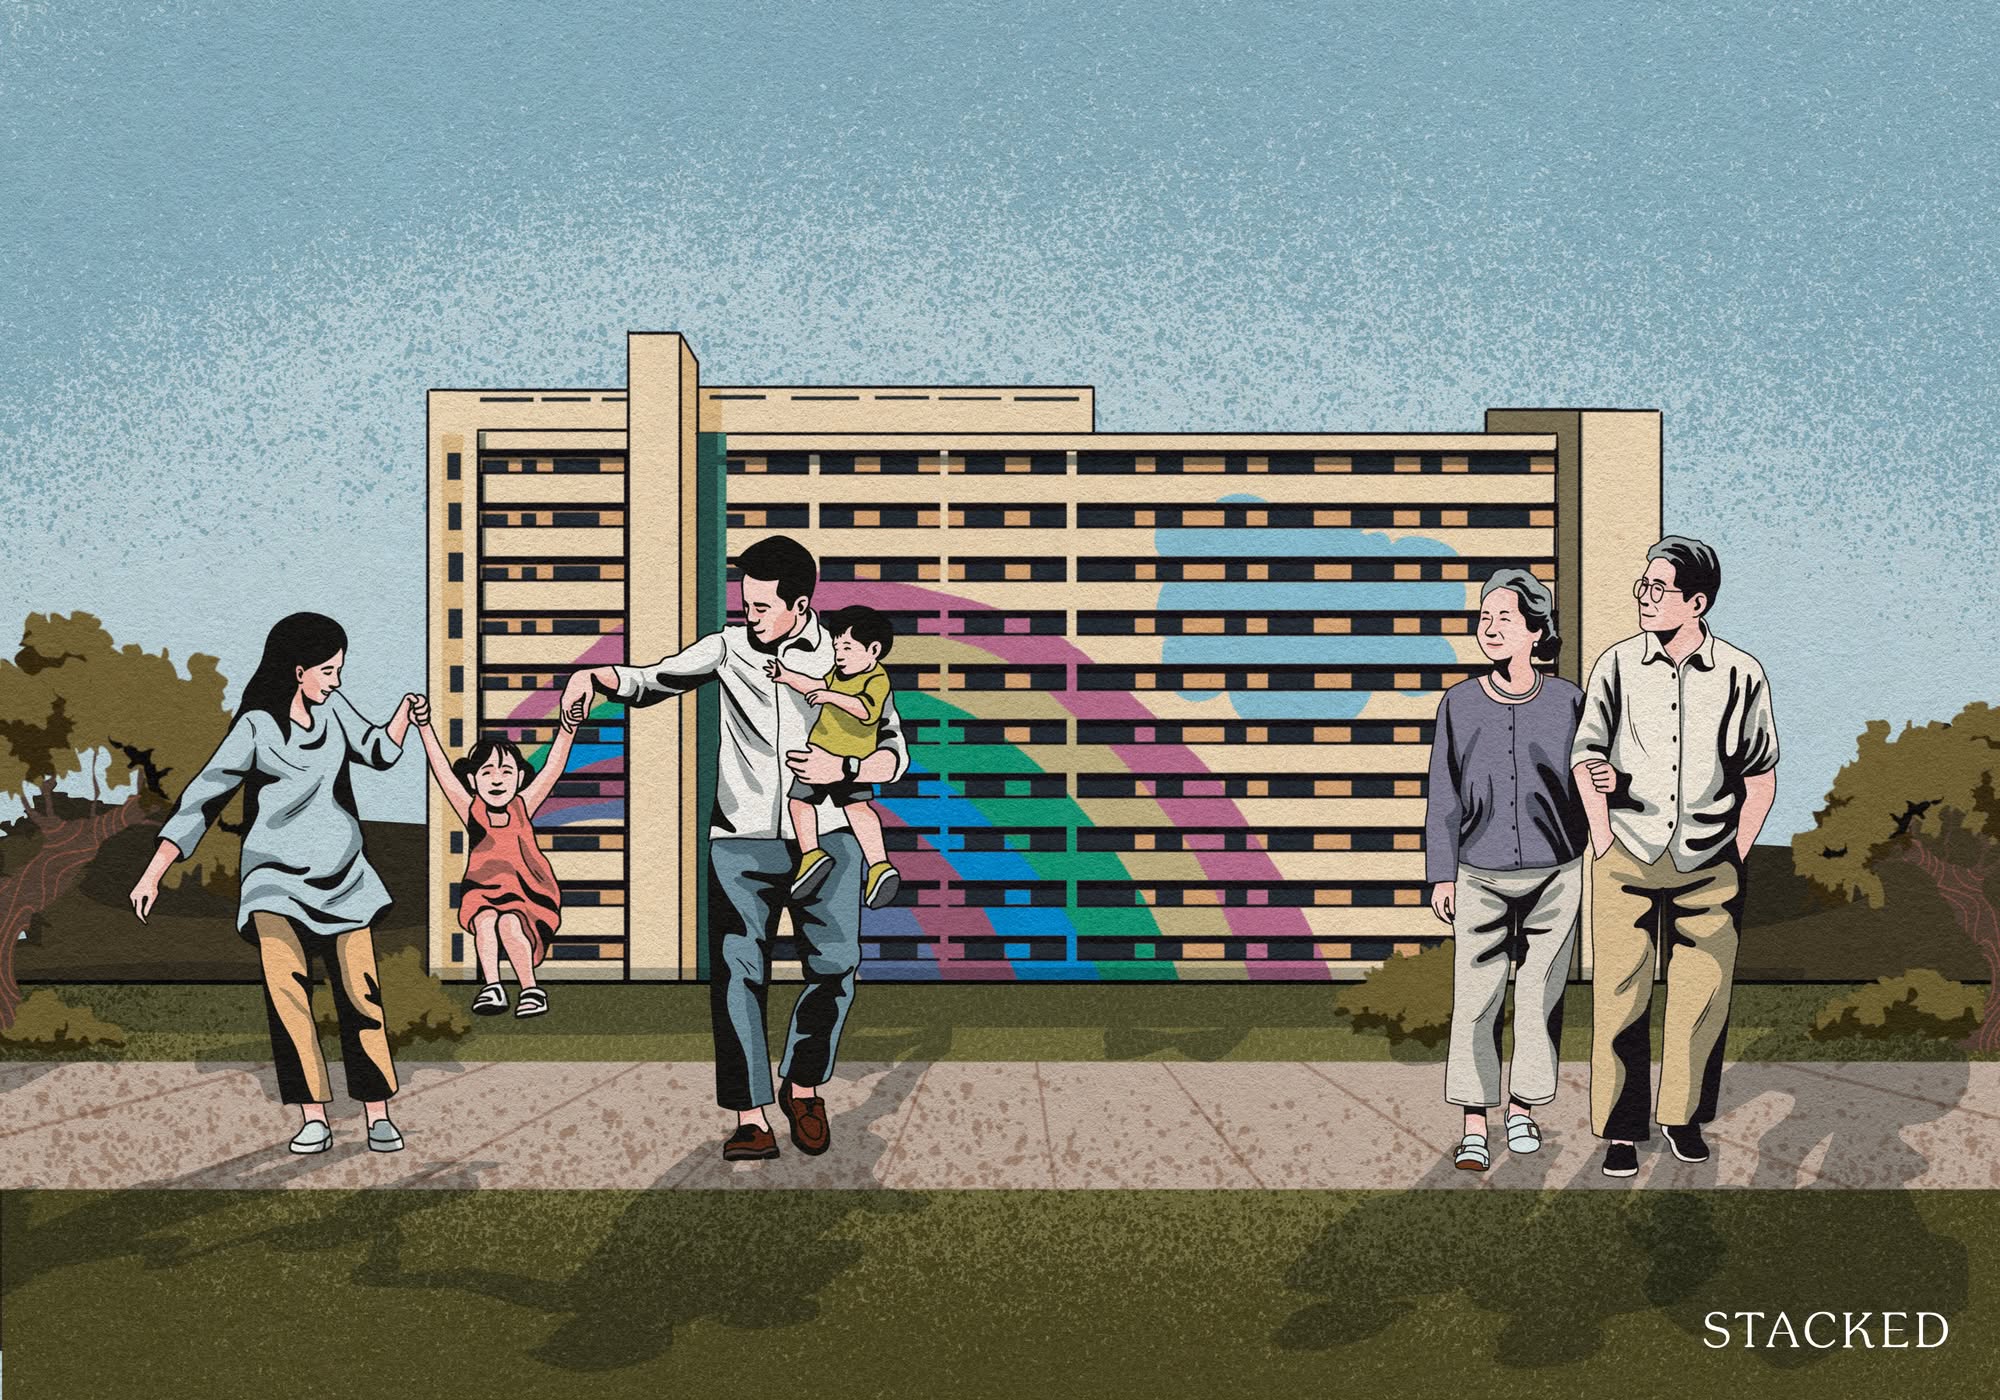
At the same time, inter-generational housing dynamics will deepen. For younger buyers, affordability and parenting support are the key concerns (more supply, higher subsidies). For older Singaporeans, there will be more concern about having housing that comes with care and services. This dual demand profile could mean that estates with both strong family amenities and senior-friendly options (e.g., Bedok, Bishan, Tampines) may see stronger long-term demand across age groups.
Finally, the ageing trend has knock-on effects for investors. With fewer large households, demand for very large properties could see a dip. Smaller units – especially those close to healthcare, transport, and community hubs – might be the ones that older Singaporeans opt to right-size into.
3. Effects of land scarcity and climate change
Land scarcity isn’t new to Singapore, but we notice the way it’s being addressed now is shifting. Previously, reclamation was all about creating more land for growth. But today, reclamation is being reframed as both a housing strategy and a survival necessity, because of rising seas and related climate change.
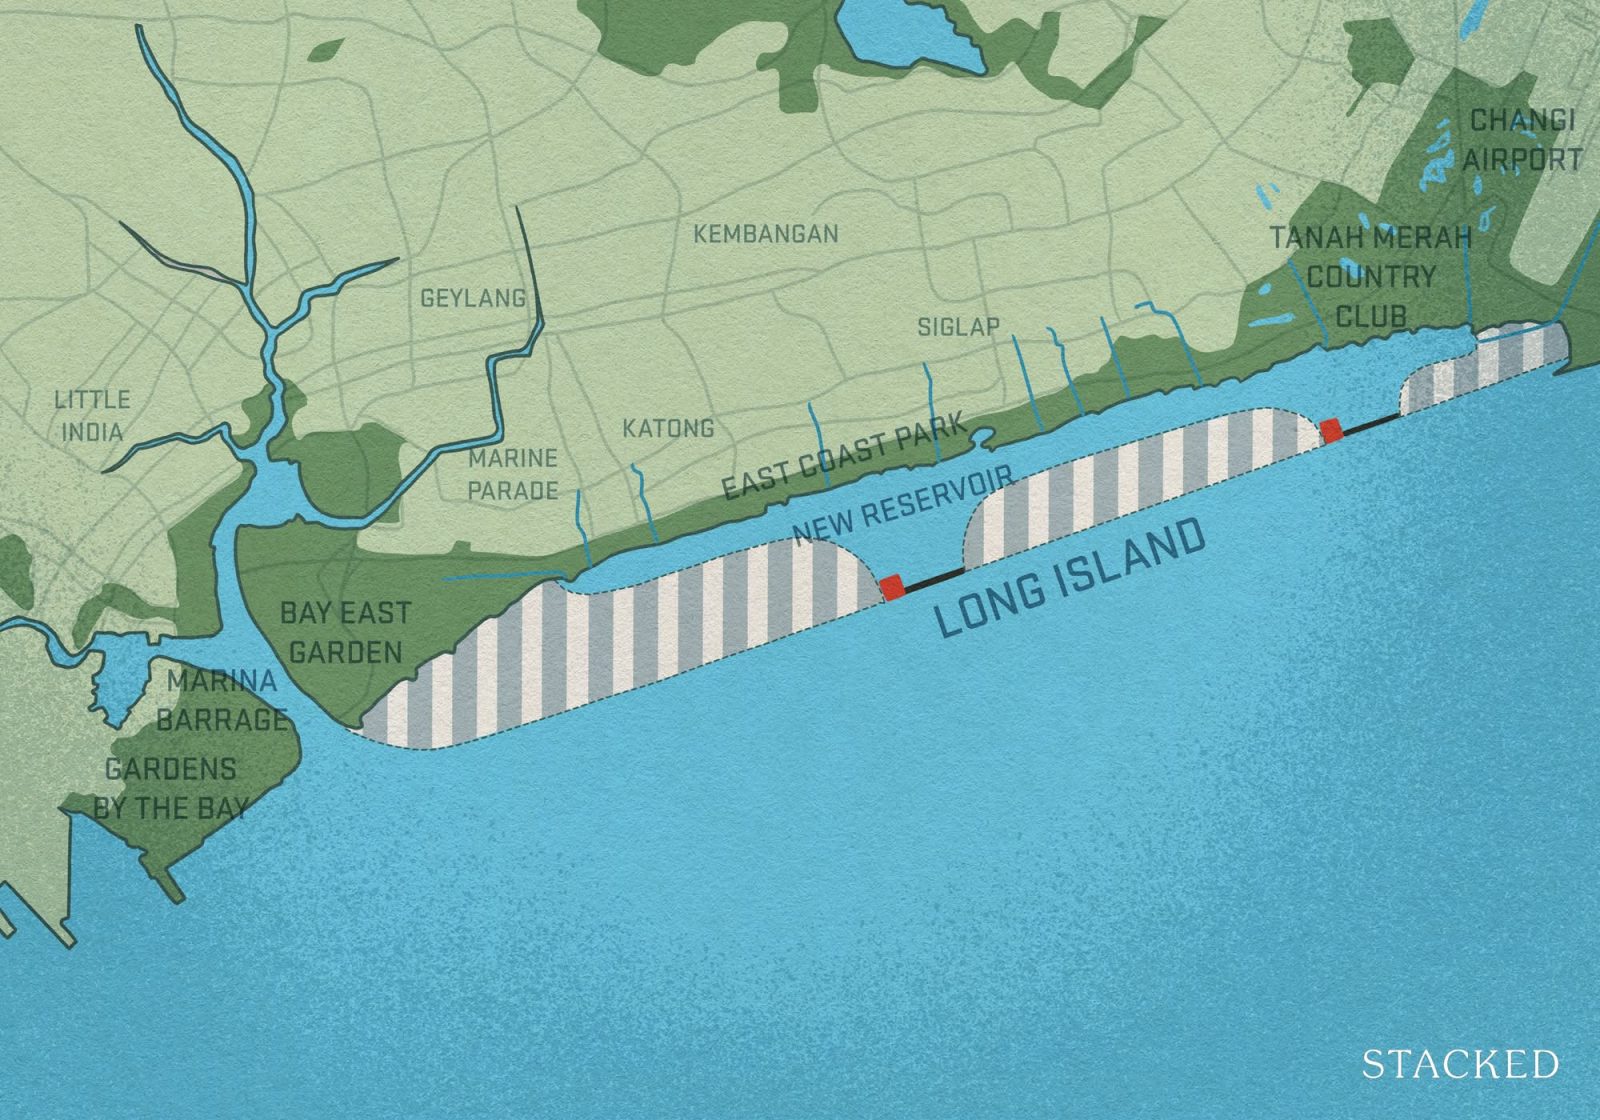
The clearest example is Long Island, a massive plan off the East Coast that could add around 800 hectares of new land. It has a two-fold purpose: it’s a coastal defence project, with seawalls and tidal barriers to protect the East Coast. But it’s also a chance to build up to 60,000 new homes. That dual purpose – climate protection plus housing seems likely to be the model for future projects. We can also look at the Pulau Tekong polder as a form of land reclamation that doubles as flood management.
For the property market, this likely means more estates planned around sustainability. Long Island, for instance, is going to feature integrated reservoirs, park connectors, and “climate-ready infrastructure.”
The big picture is that climate change has permanently inserted itself into our urban planning. Housing will no longer just be about more units, but about pre-emptively stopping future ecological disasters.
4. Affordability and housing demand may not see immediate relief
If you were hoping the speech would come with an instant cure for housing affordability, you may be disappointed. The speech reiterated what we’ve heard before: more flats are being built, and subsidies are being raised.
That will help, but it doesn’t mean prices are about to soften right now. In fact, the very announcement of new plans – like Kranji’s 14,000 homes or the Long Island project – is a reminder of how long supply takes to materialise. By the time shovels hit the ground and families move in, years would have passed.
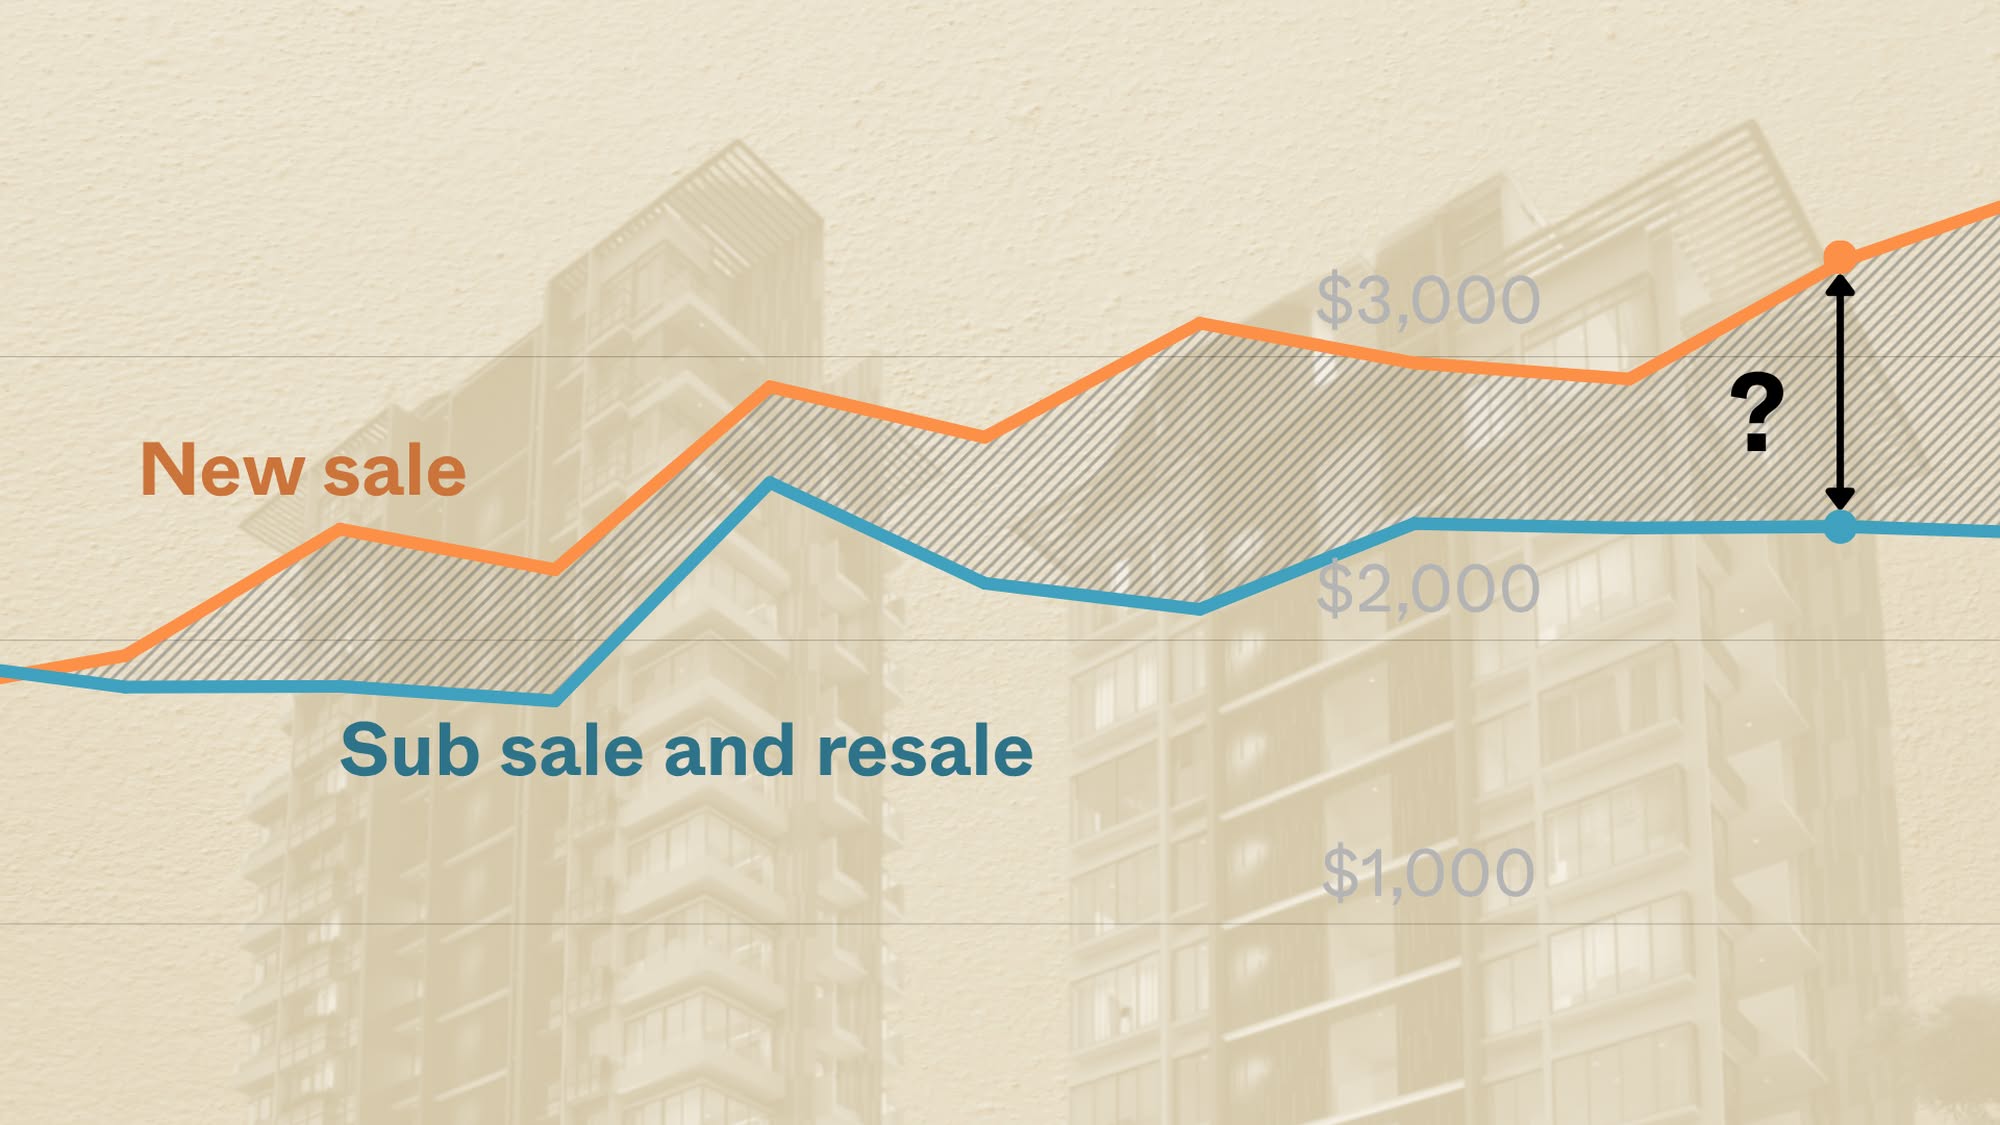
For now, we’re still left with rising flat and condo prices; and with intergenerational wealth transfer continuing, it can be difficult to slow its momentum. We would expect a long, drawn-out stabilisation rather than a sudden dip.
For buyers, the practical takeaway is still to pick within your means and be prepared for today’s prices to look “reasonable” a decade down the road.
For more on the situation as it unfolds, follow us on Stacked. If you’d like to get in touch for a more in-depth consultation, you can do so here.