Is It Worth Paying A Premium For A Pre/Post-War Flat In Tiong Bahru? We Break Down The Numbers
May 16, 2021
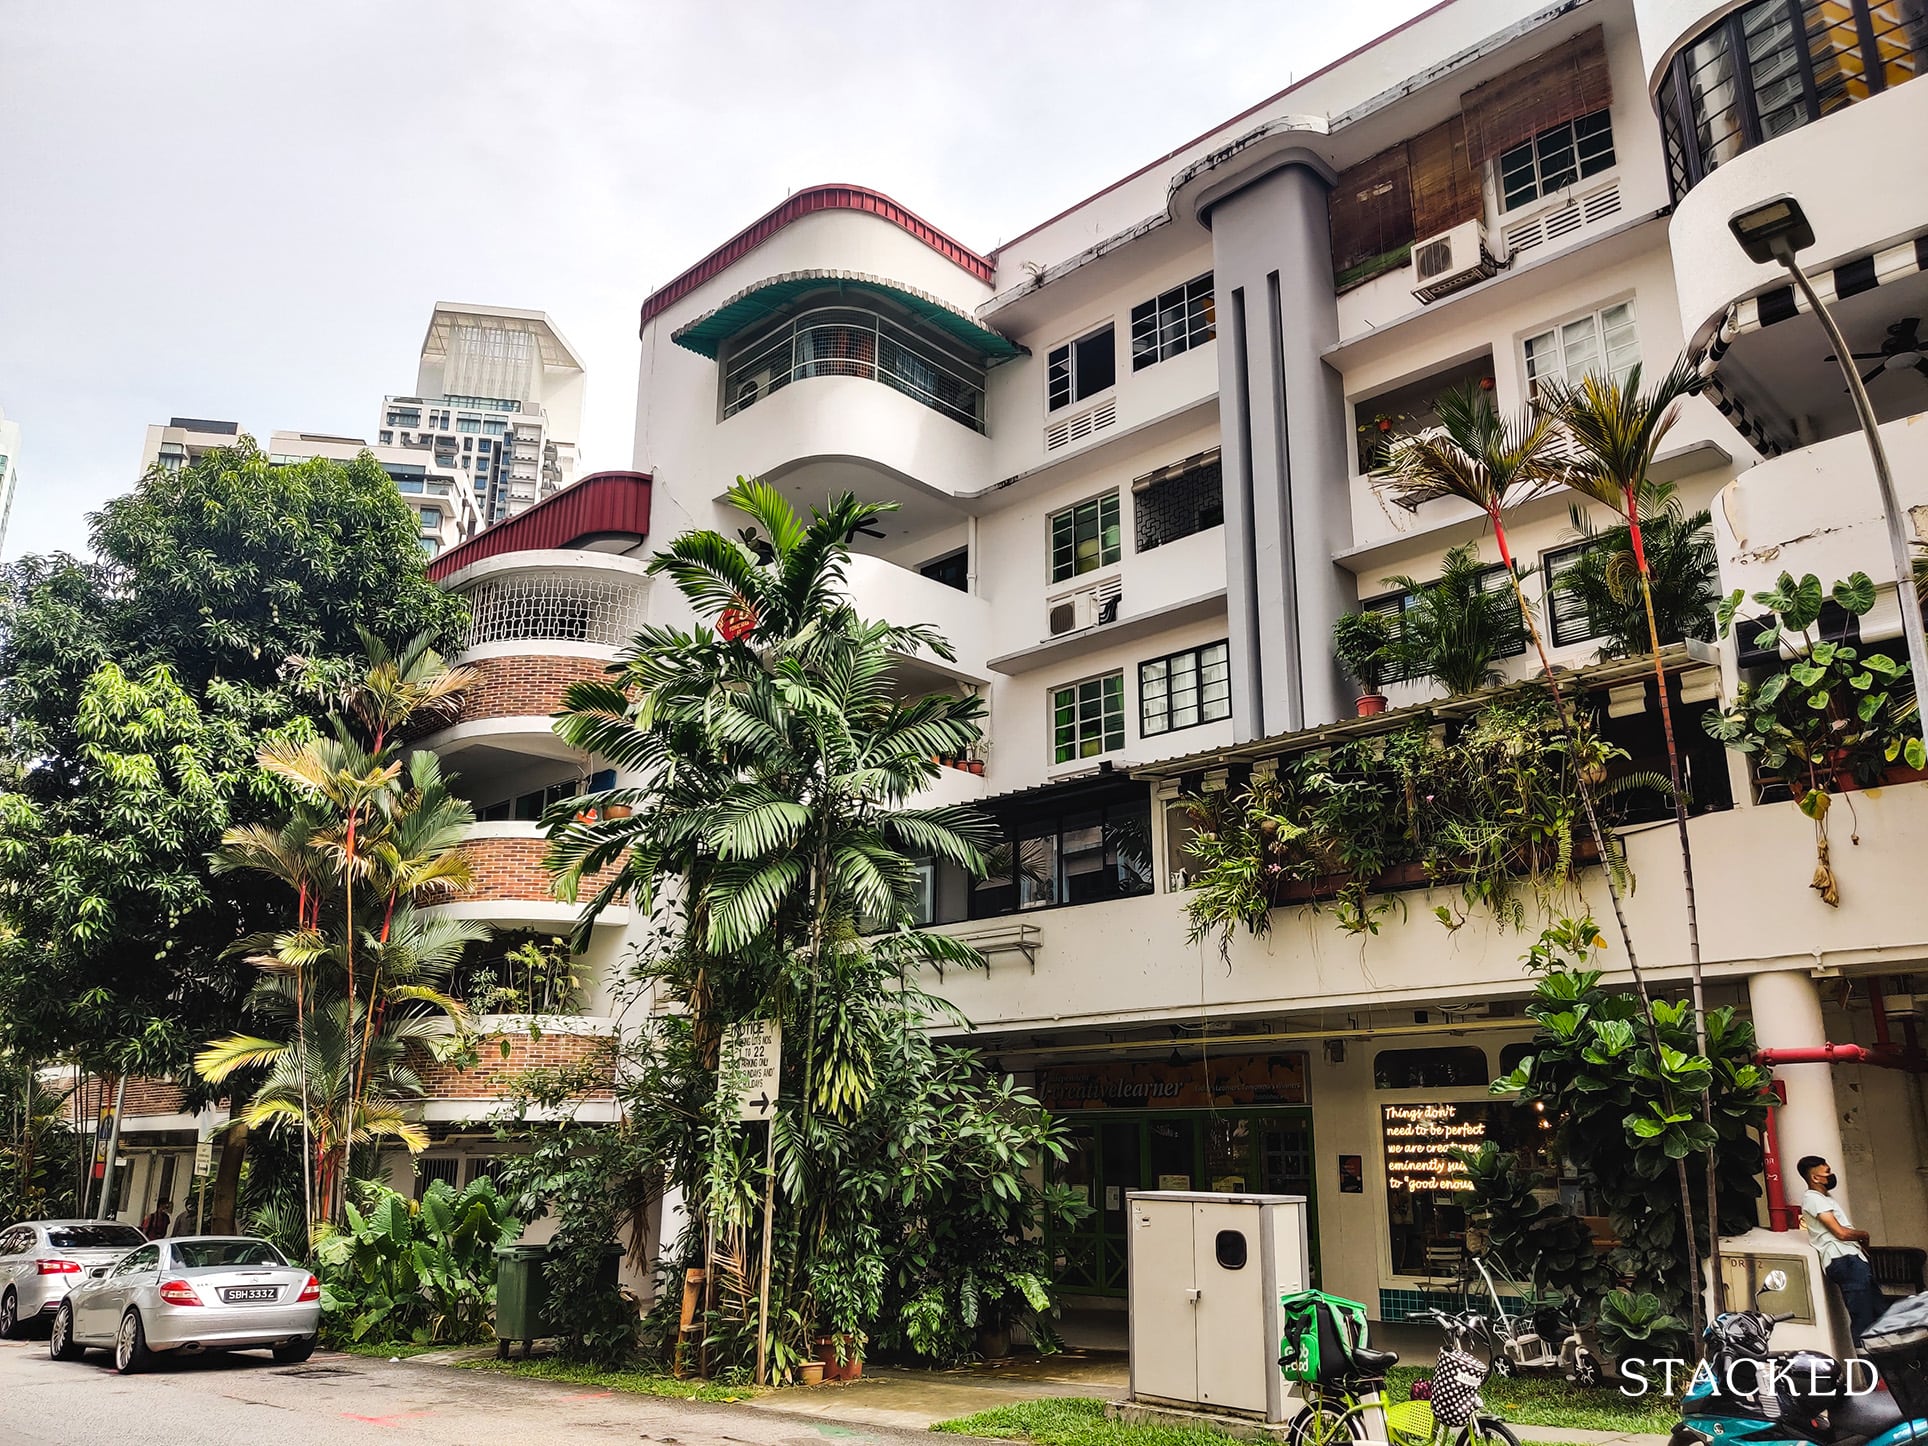
Tiong Bahru flats have made headlines for its steep prices despite its relatively low lease remaining.
A Straits Times article published in August 2020 highlighted a $1.1 million dollar 4-room flat that transacted despite having just 51 years left on the lease.
While resale HDB flats are undoubtedly on a tear right now, not many people would be able to justify a 7 digit figure on a flat with so little lease left.
To put things into perspective, you could buy a freehold (albeit small) apartment in River Valley for that kind of money.
And remember, you will also need to come up with more cash depending on your age because of the new HDB housing loan rules.
So what gives?
With its rich heritage, history and strong amenity offering in the area, there’s clearly a demand for such homes in Singapore.
If you’ve been wondering about why these flats can command such prices, I hope to uncover more about the prices in the area, and whether it is worth a further look.
2 Sites To Consider

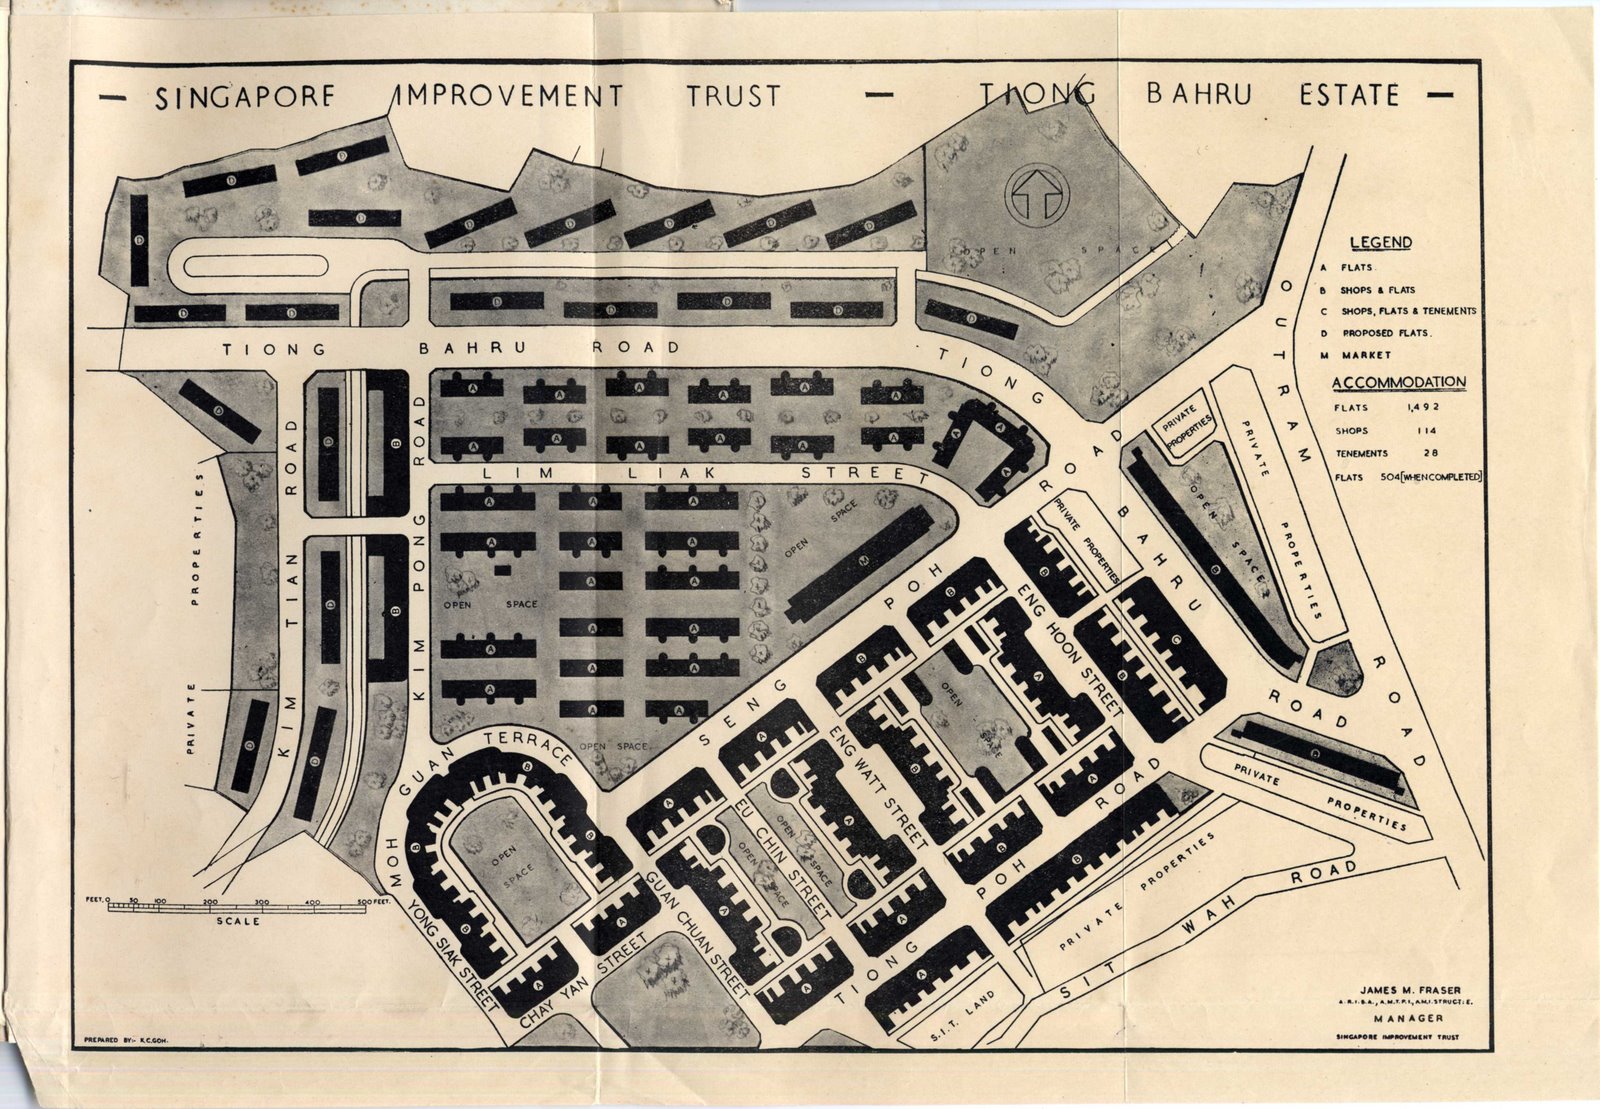
These flats are unique in that they were built by the now defunct SIT (Singapore Improvement Trust), which was primarily in charge of public housing before the HDB took over.
The former SIT walk-up flats can be broken up into 2 sites, one that is conserved and another that is not.
Both sections are separated by Moh Guan Terrace and Seng Poh Road. While it might not be easy to tell the difference between both sites, they both do differ in some aspects.
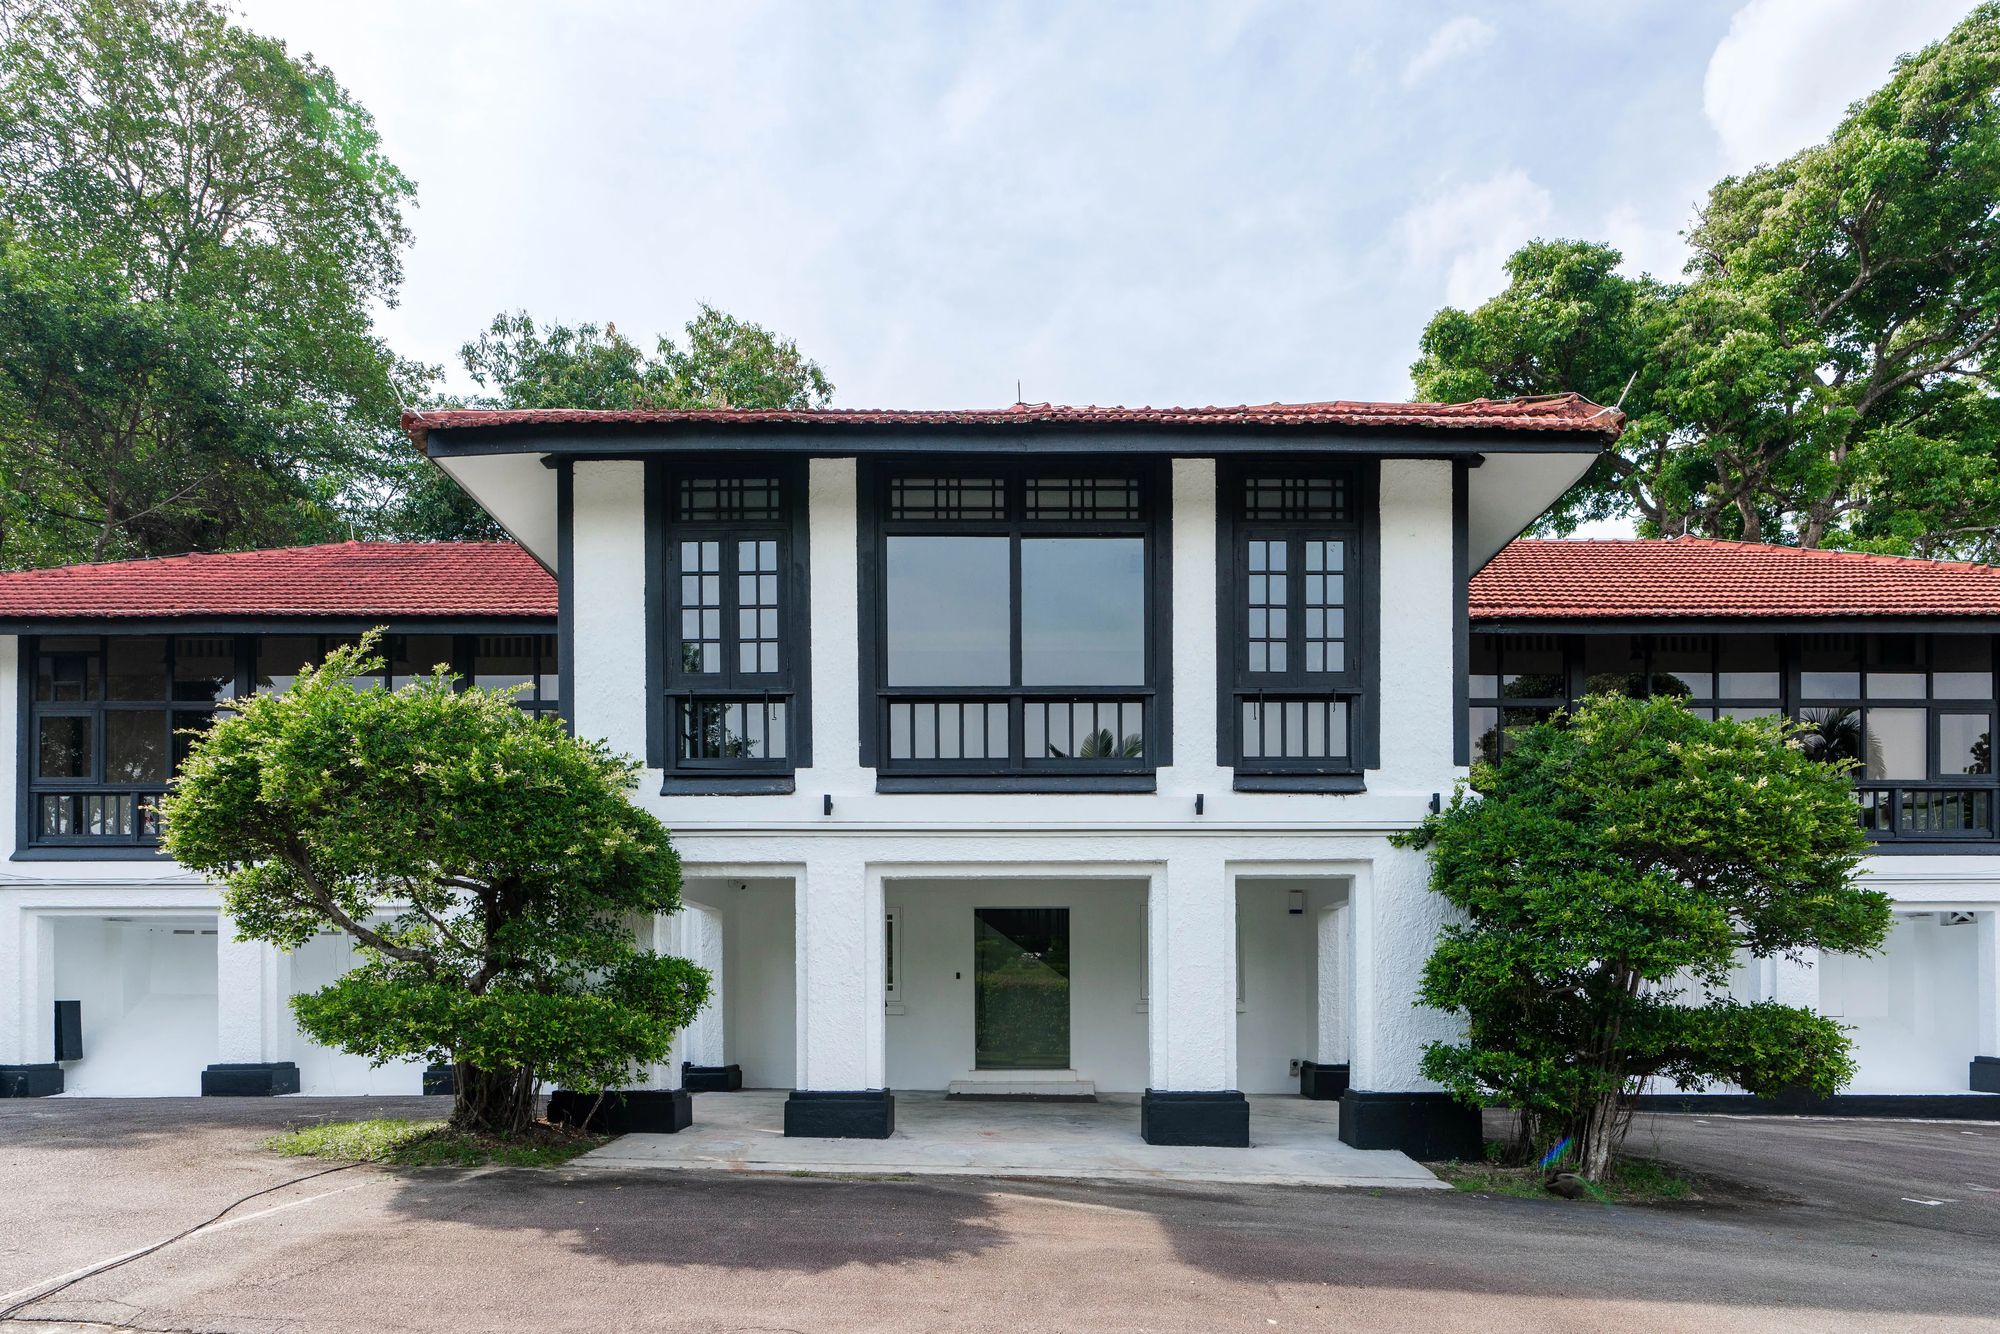
The conserved area was built earlier – in fact, block 55 was completed in 1936 (which is why these are known as pre-war flats).

In the next 5 years till 1941, the SIT continued building more flats which eventually housed around 6,000 people. These flats have been privatised and are fully conserved.
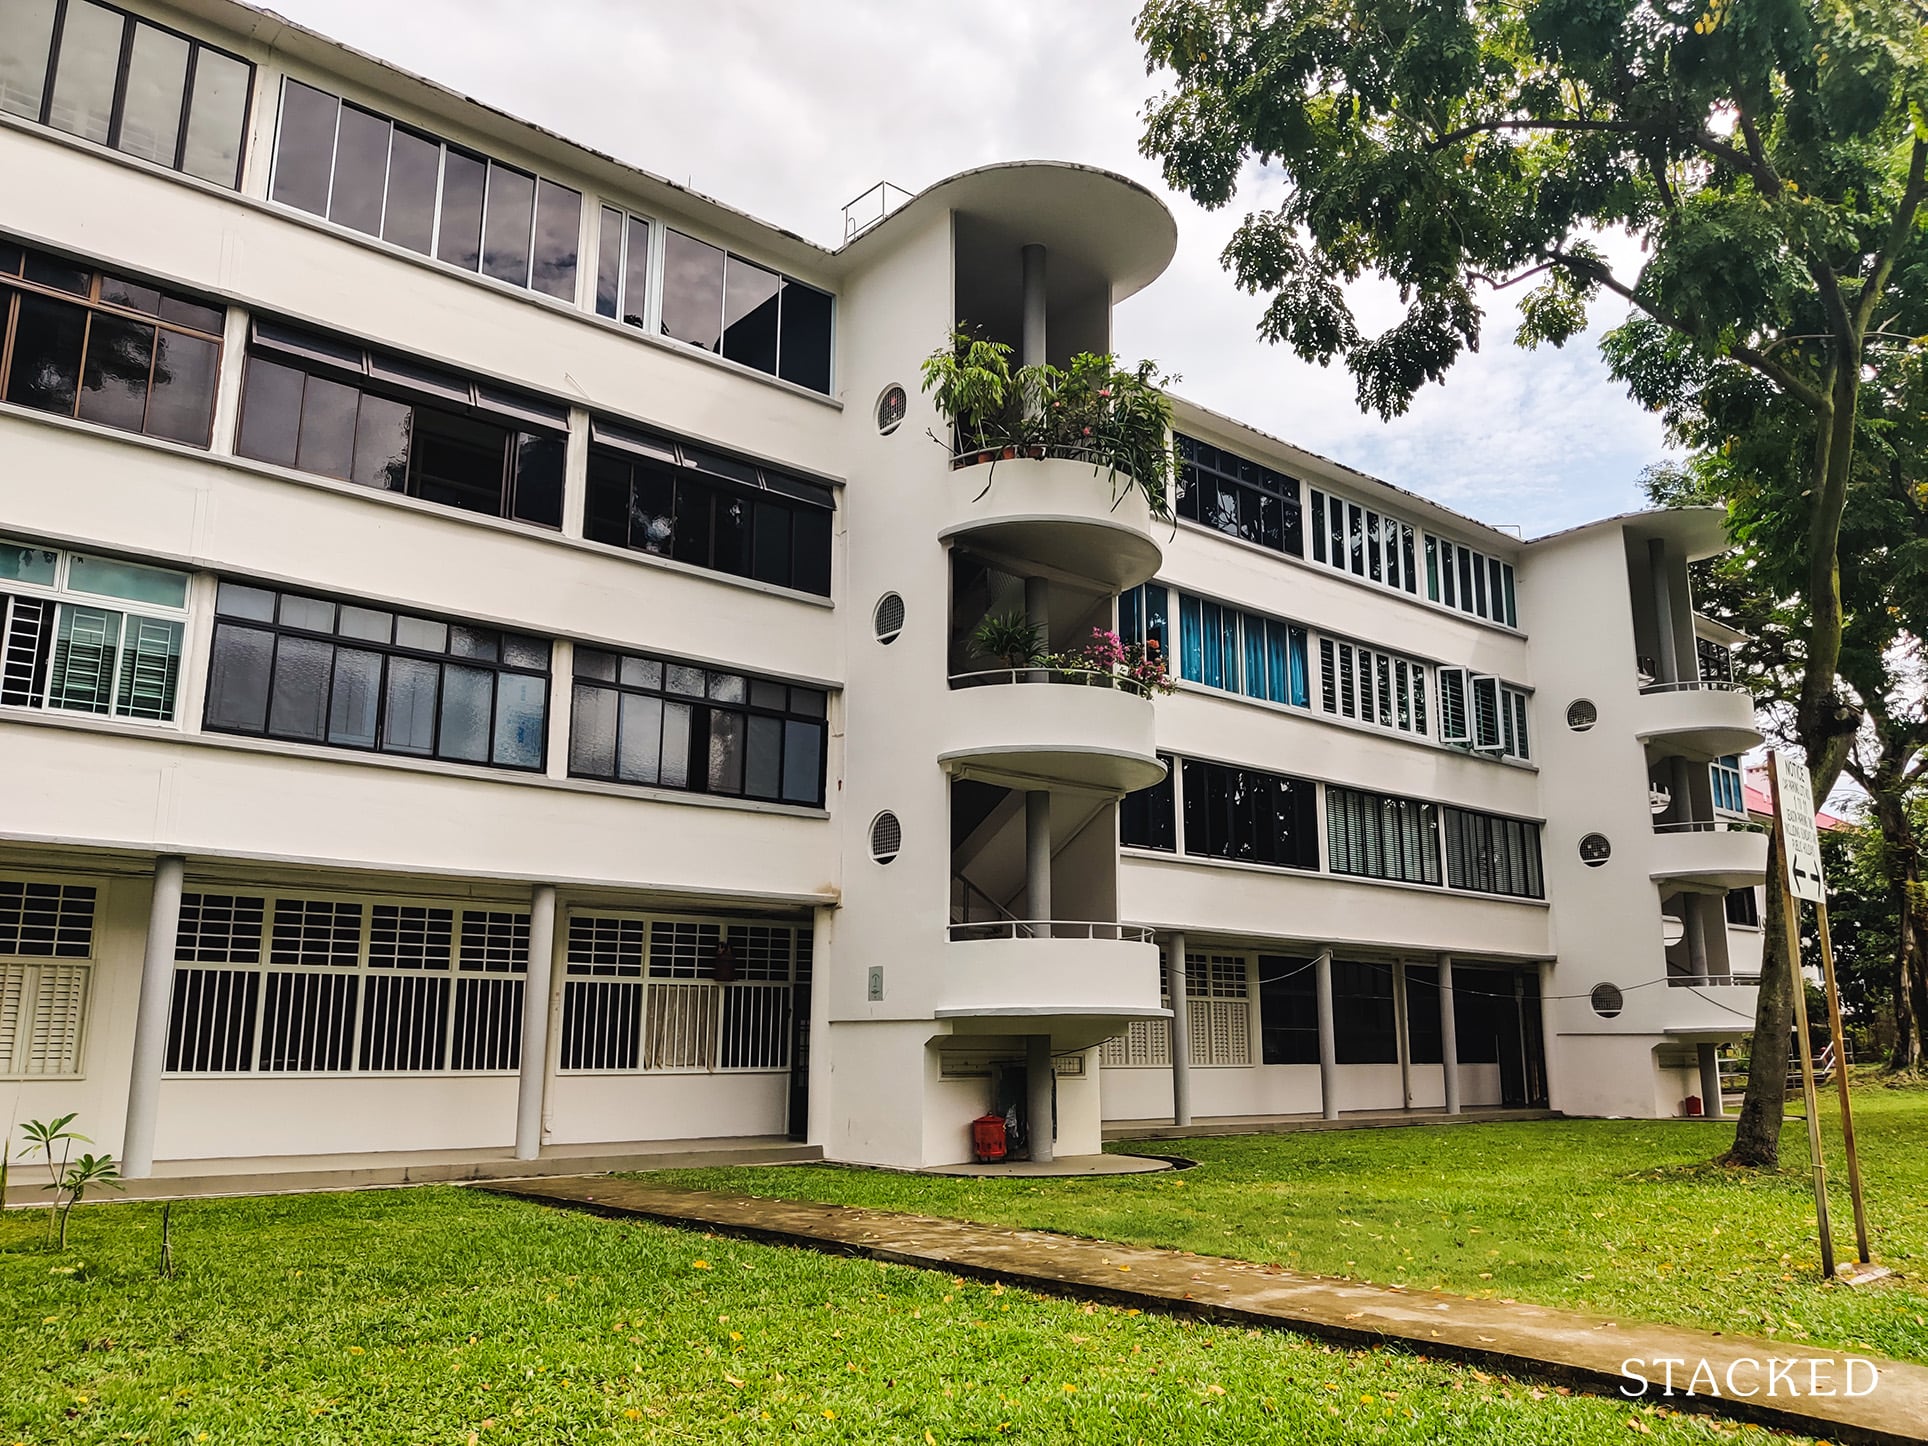
After the war, the SIT continued building more flats in the area from Seng Poh Road towards Tiong Bahru Road and Boon Tiong Road. The difference are that these are the post-war flats and are not conserved, neither are they privatised.

And unlike the pre-war flats, the SIT wanted to create a more “open development” concept, which meant more open areas served by footpaths in order to foster the community spirit.
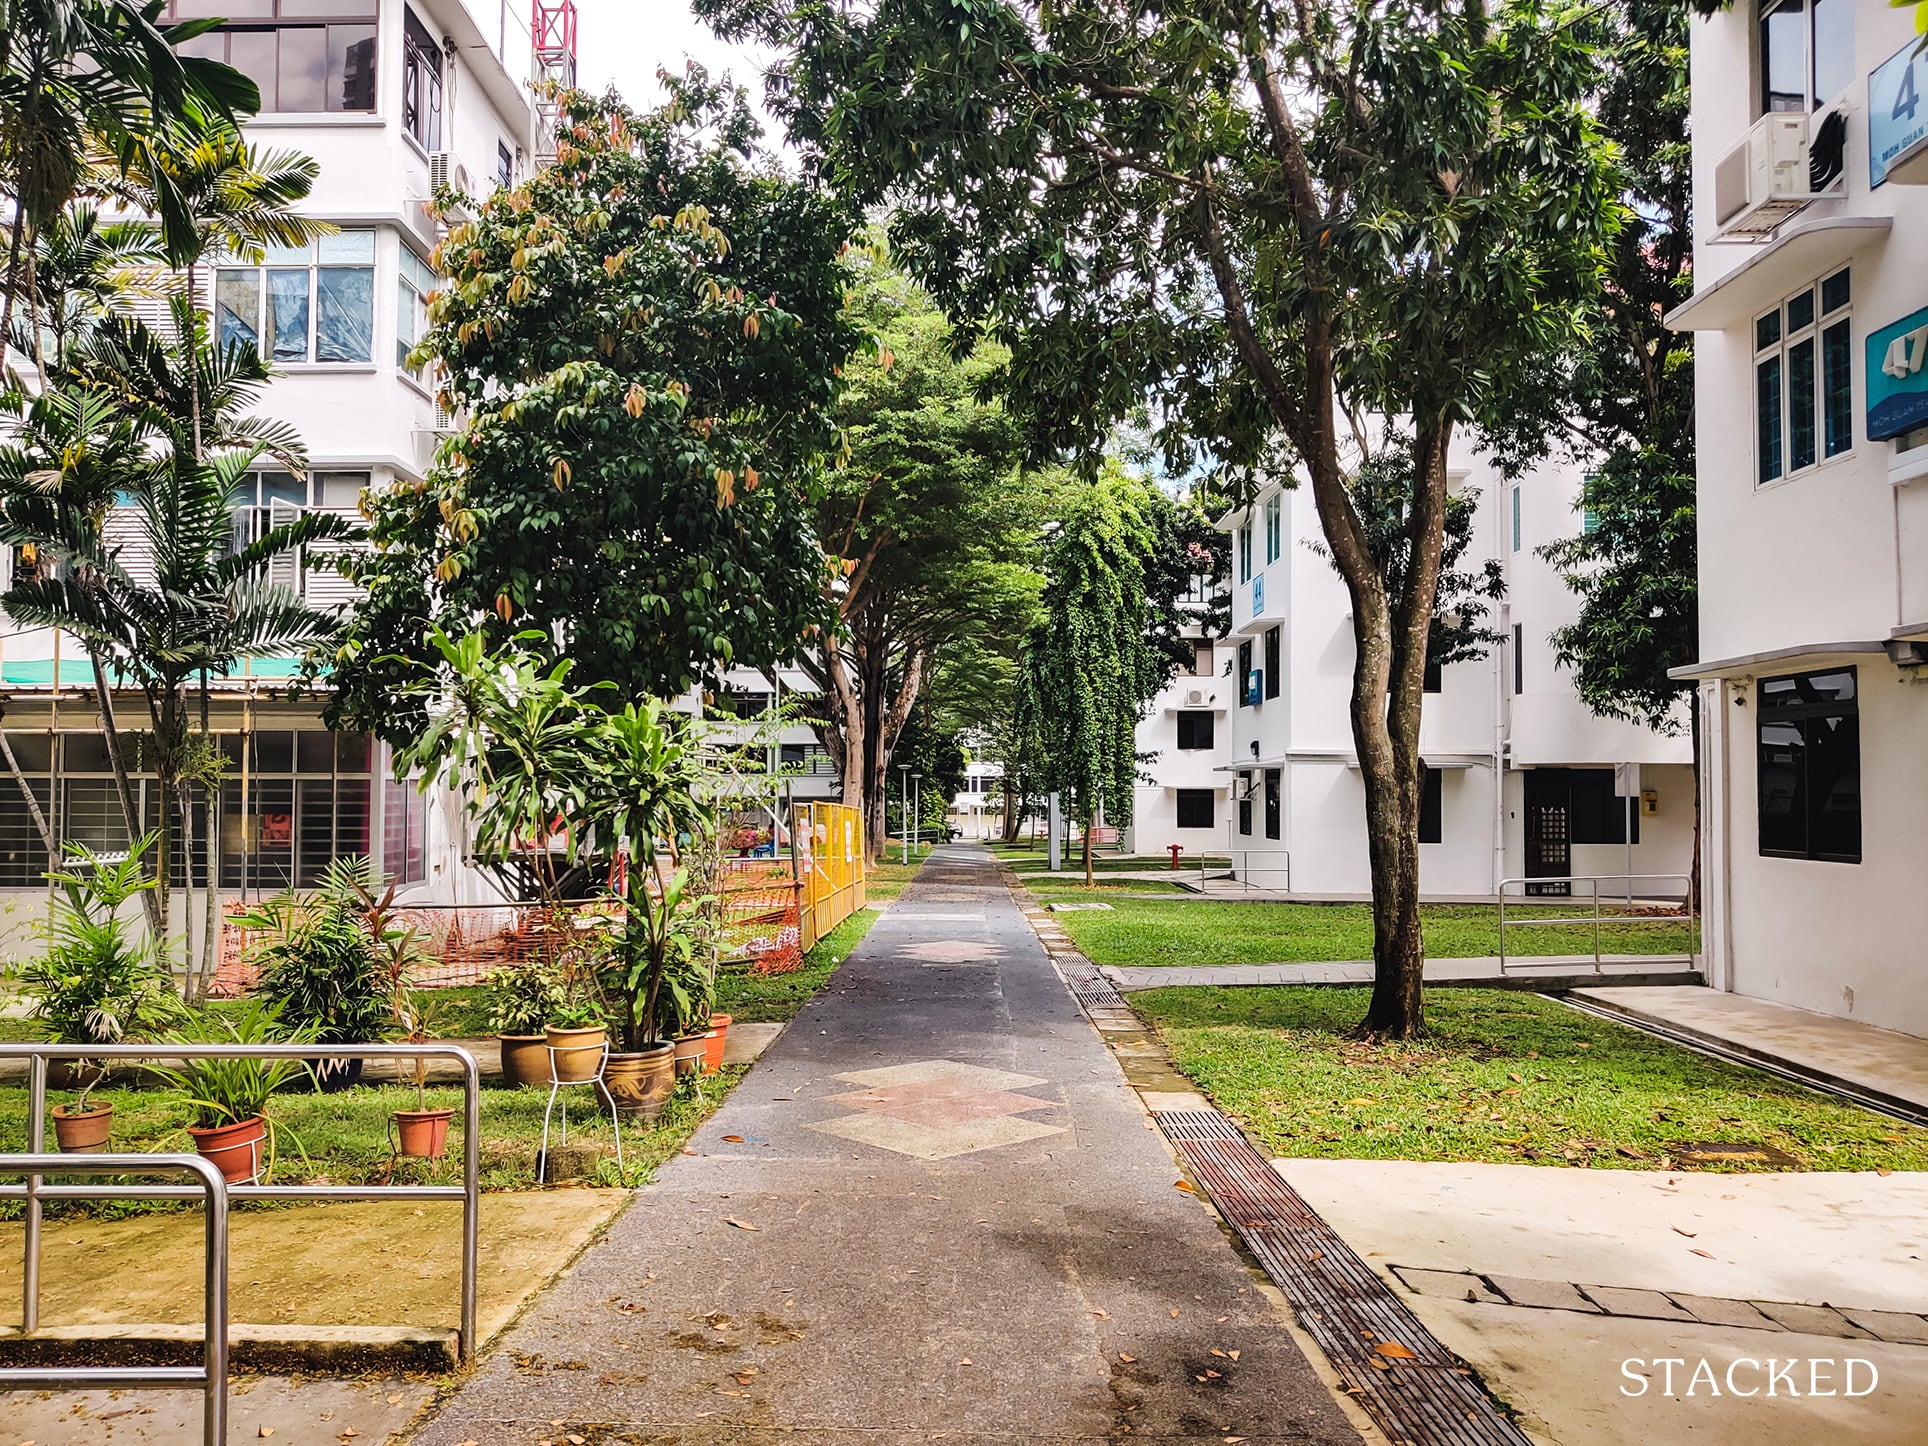
It’s the reason why you’ll find walking pathways around the blocks, where residents would hang their laundry and do their gardening – activities that increases the chance of meeting their neighbour. This “kampong spirit” can still be felt up to this day.
Now that I’ve briefly covered both areas, let’s take a look at the data.
What are the prices of the post-war flats like?
| Year | Post-War SIT Flats Median Prices | Other Bukit Merah Flat Median Prices | Post-War SIT Flats Completion Year | Other Bukit Merah Completion Year (Median of Transacted) | Post-War SIT Flats $PSF | Other Bukit Merah $PSF |
| 1990 | $53,500 | $45,500 | 1973 | 1976 | $62 | $66 |
| 1991 | $53,500 | $45,600 | 1973 | 1976 | $62 | $70 |
| 1992 | $55,000 | $50,000 | 1973 | 1976 | $66 | $72 |
| 1993 | $121,500 | $74,000 | 1973 | 1975 | $131 | $107 |
| 1994 | $137,500 | $95,000 | 1973 | 1976 | $148 | $137 |
| 1995 | $190,000 | $121,500 | 1973 | 1976 | $212 | $174 |
| 1996 | $265,000 | $170,500 | 1973 | 1976 | $290 | $245 |
| 1997 | $279,250 | $200,000 | 1973 | 1976 | $309 | $280 |
| 1998 | $230,000 | $157,000 | 1973 | 1976 | $263 | $224 |
| 1999 | $210,000 | $146,900 | 1973 | 1976 | $239 | $209 |
| 2000 | $257,500 | $154,000 | 1973 | 1976 | $274 | $221 |
| 2001 | $262,000 | $143,000 | 1973 | 1976 | $277 | $203 |
| 2002 | $255,250 | $143,000 | 1973 | 1976 | $269 | $208 |
| 2003 | $260,000 | $163,900 | 1973 | 1976 | $283 | $232 |
| 2004 | $257,500 | $178,000 | 1973 | 1976 | $276 | $250 |
| 2005 | $244,000 | $172,000 | 1973 | 1976 | $274 | $245 |
| 2006 | $267,500 | $176,000 | 1973 | 1976 | $291 | $253 |
| 2007 | $320,000 | $200,000 | 1973 | 1975 | $338 | $284 |
| 2008 | $412,500 | $252,000 | 1973 | 1976 | $441 | $363 |
| 2009 | $420,000 | $277,000 | 1973 | 1976 | $470 | $386 |
| 2010 | $491,500 | $318,000 | 1973 | 1976 | $550 | $448 |
| 2011 | $560,000 | $356,000 | 1973 | 1976 | $618 | $498 |
| 2012 | $587,500 | $378,000 | 1973 | 1976 | $670 | $534 |
| 2013 | $635,650 | $400,000 | 1973 | 1976 | $698 | $554 |
| 2014 | $629,000 | $380,000 | 1973 | 1976 | $685 | $528 |
| 2015 | $630,000 | $370,000 | 1973 | 1976 | $671 | $507 |
| 2016 | $630,000 | $360,000 | 1973 | 1976 | $681 | $490 |
| 2017 | $624,000 | $358,000 | 1973 | 1978 | $696 | $493 |
| 2018 | $595,000 | $340,000 | 1973 | 1976 | $646 | $472 |
| 2019 | $622,000 | $310,000 | 1973 | 1976 | $677 | $441 |
| 2020 | $581,594 | $315,000 | 1973 | 1976 | $637 | $445 |
| 2021 | $618,000 | $338,444 | 1973 | 1976 | $671 | $471 |
The table showcases 3-room flats transacted across all the blocks in the non-conserved area against all other 3-room flats in the Bukit Merah HDB estate.
Simply put, 3-room flats were chosen because these were the most common flat types in those days. There are also 2-room and 4-room flats, but these are less common.
Here is a chart visually depicting how prices have changed in terms of $PSF.
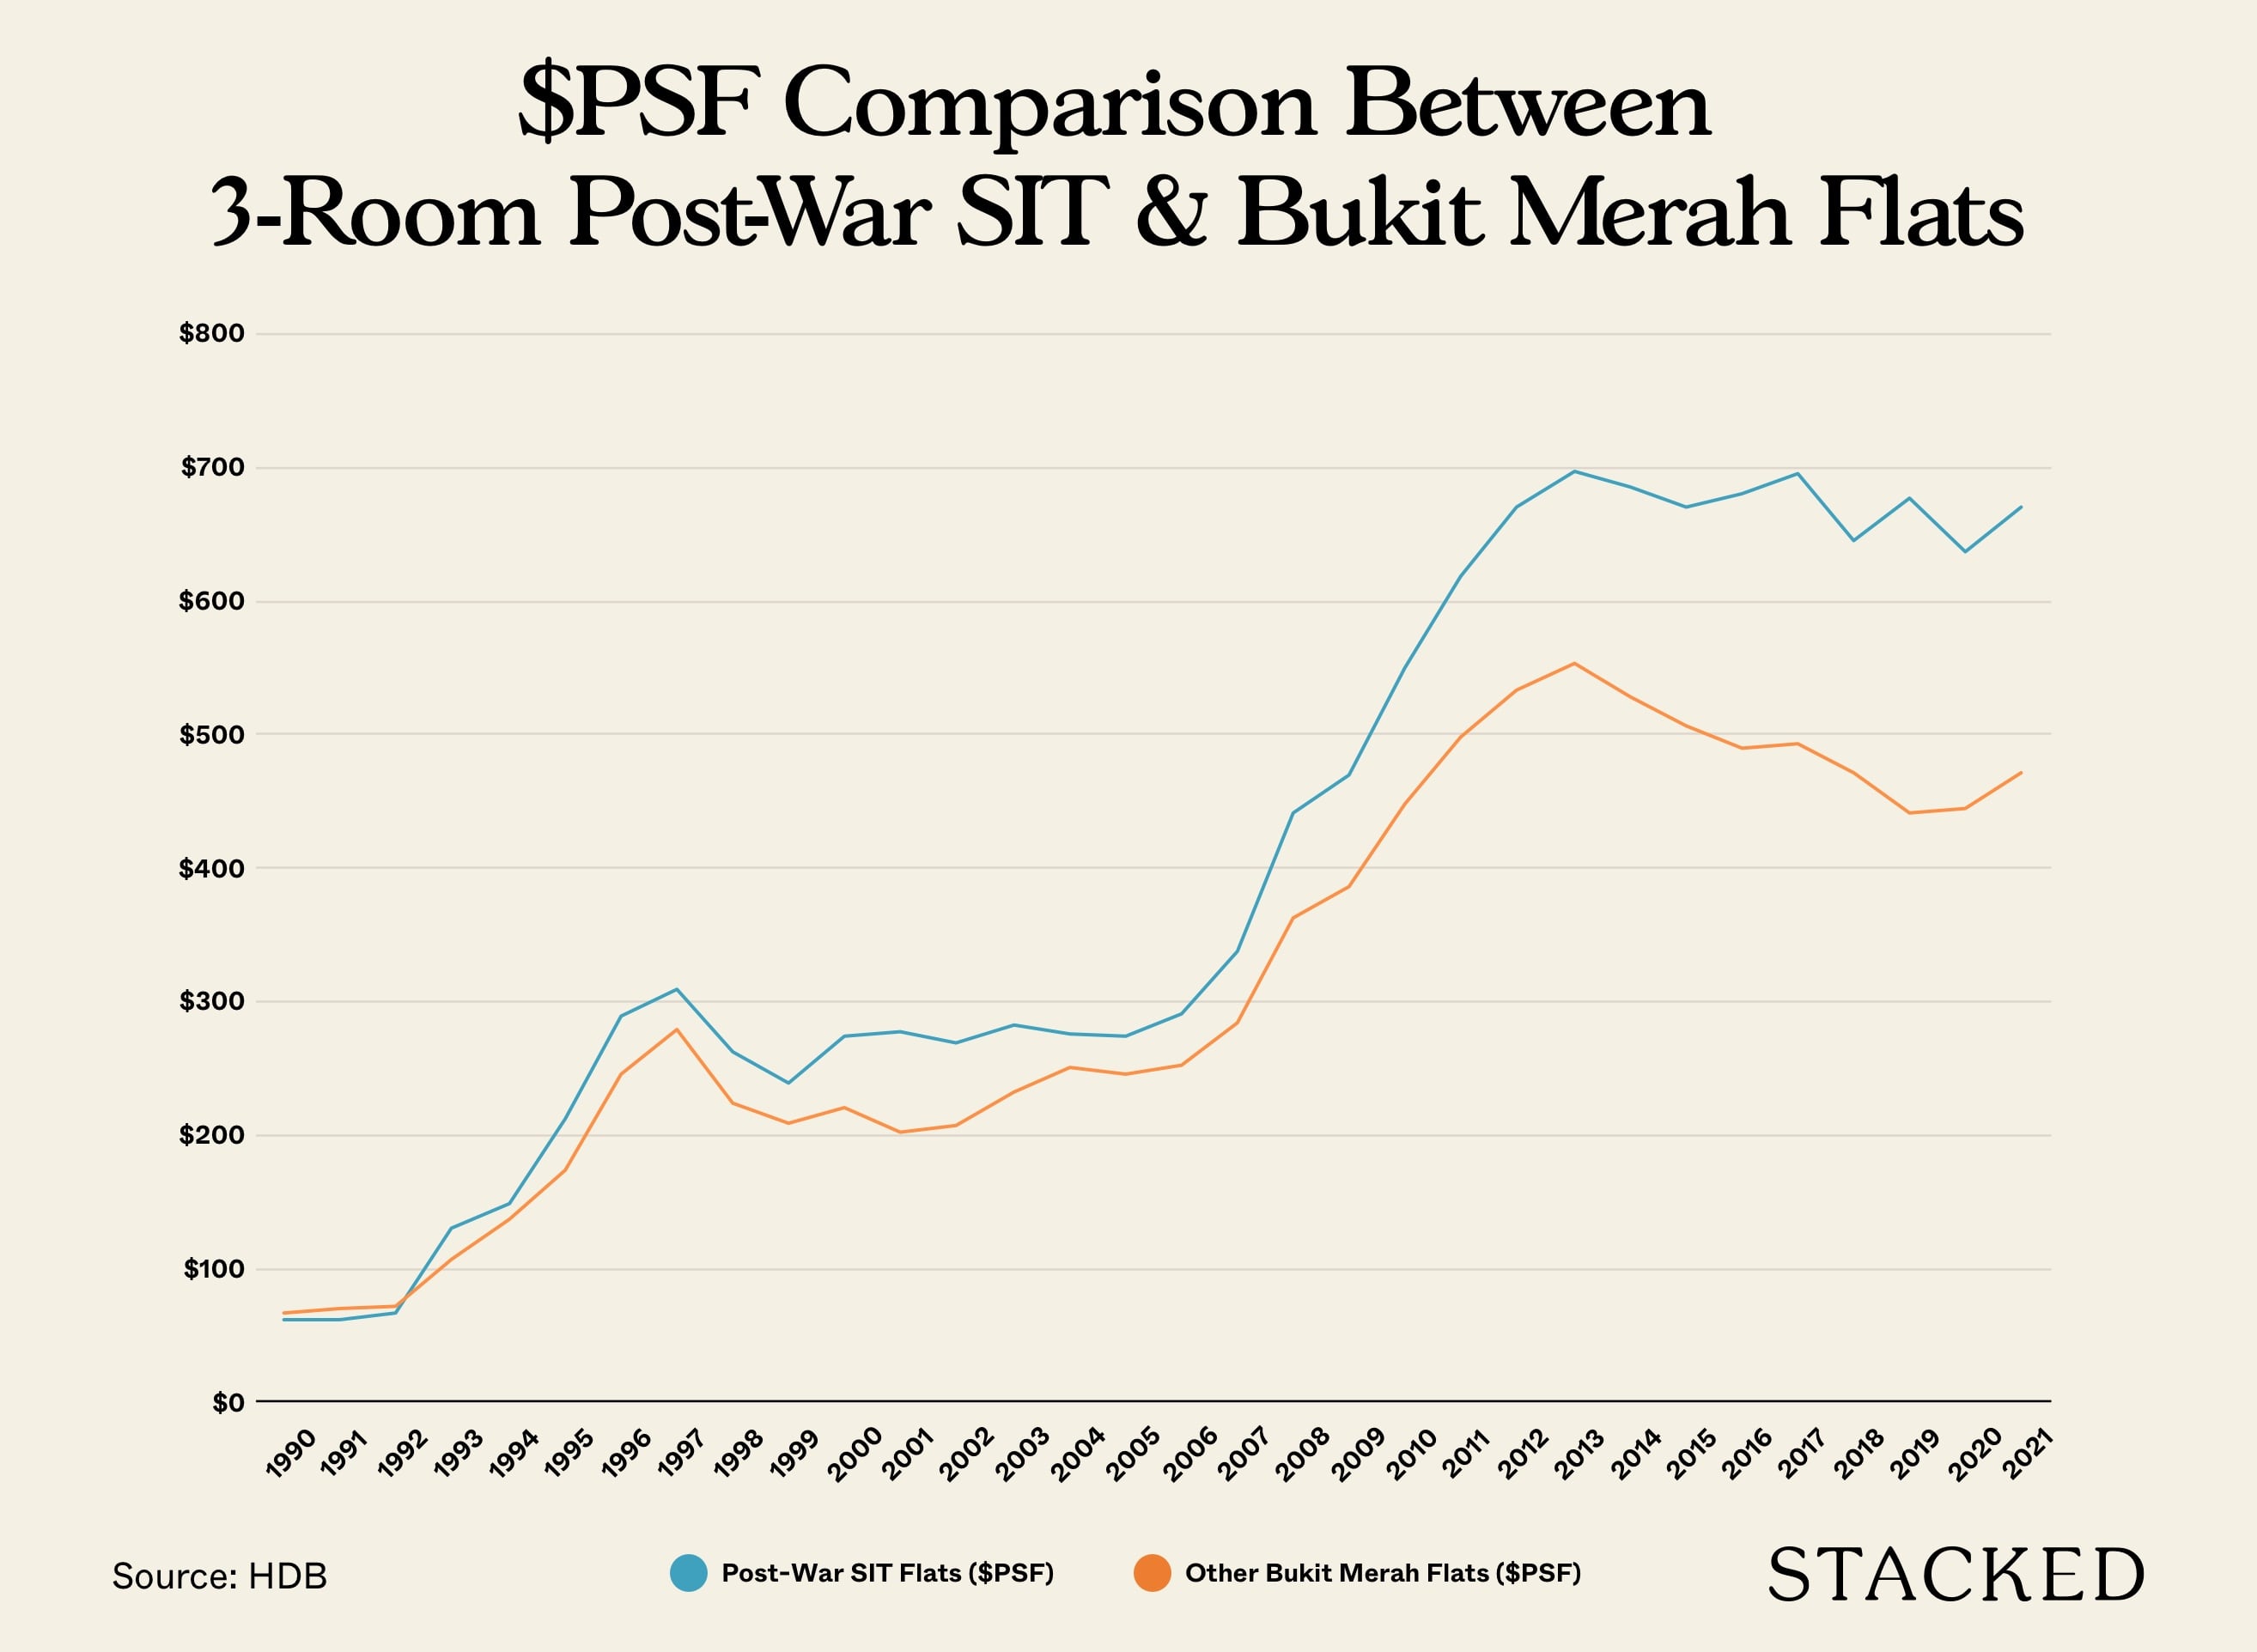
Clearly, the disparity between the post-war SIT flats and other flats in Bukit Merah have increased over time and seem to have diverged over time.
However, 3-room flats in post-war SIT flats are actually bigger. On average, transactions indicate flat sizes of around 84-85 SQM for post-war SIT flats, while 3-room flats in other parts of Bukit Merah are around 65 SQM. As a result, the quantum disparity is much more stark:
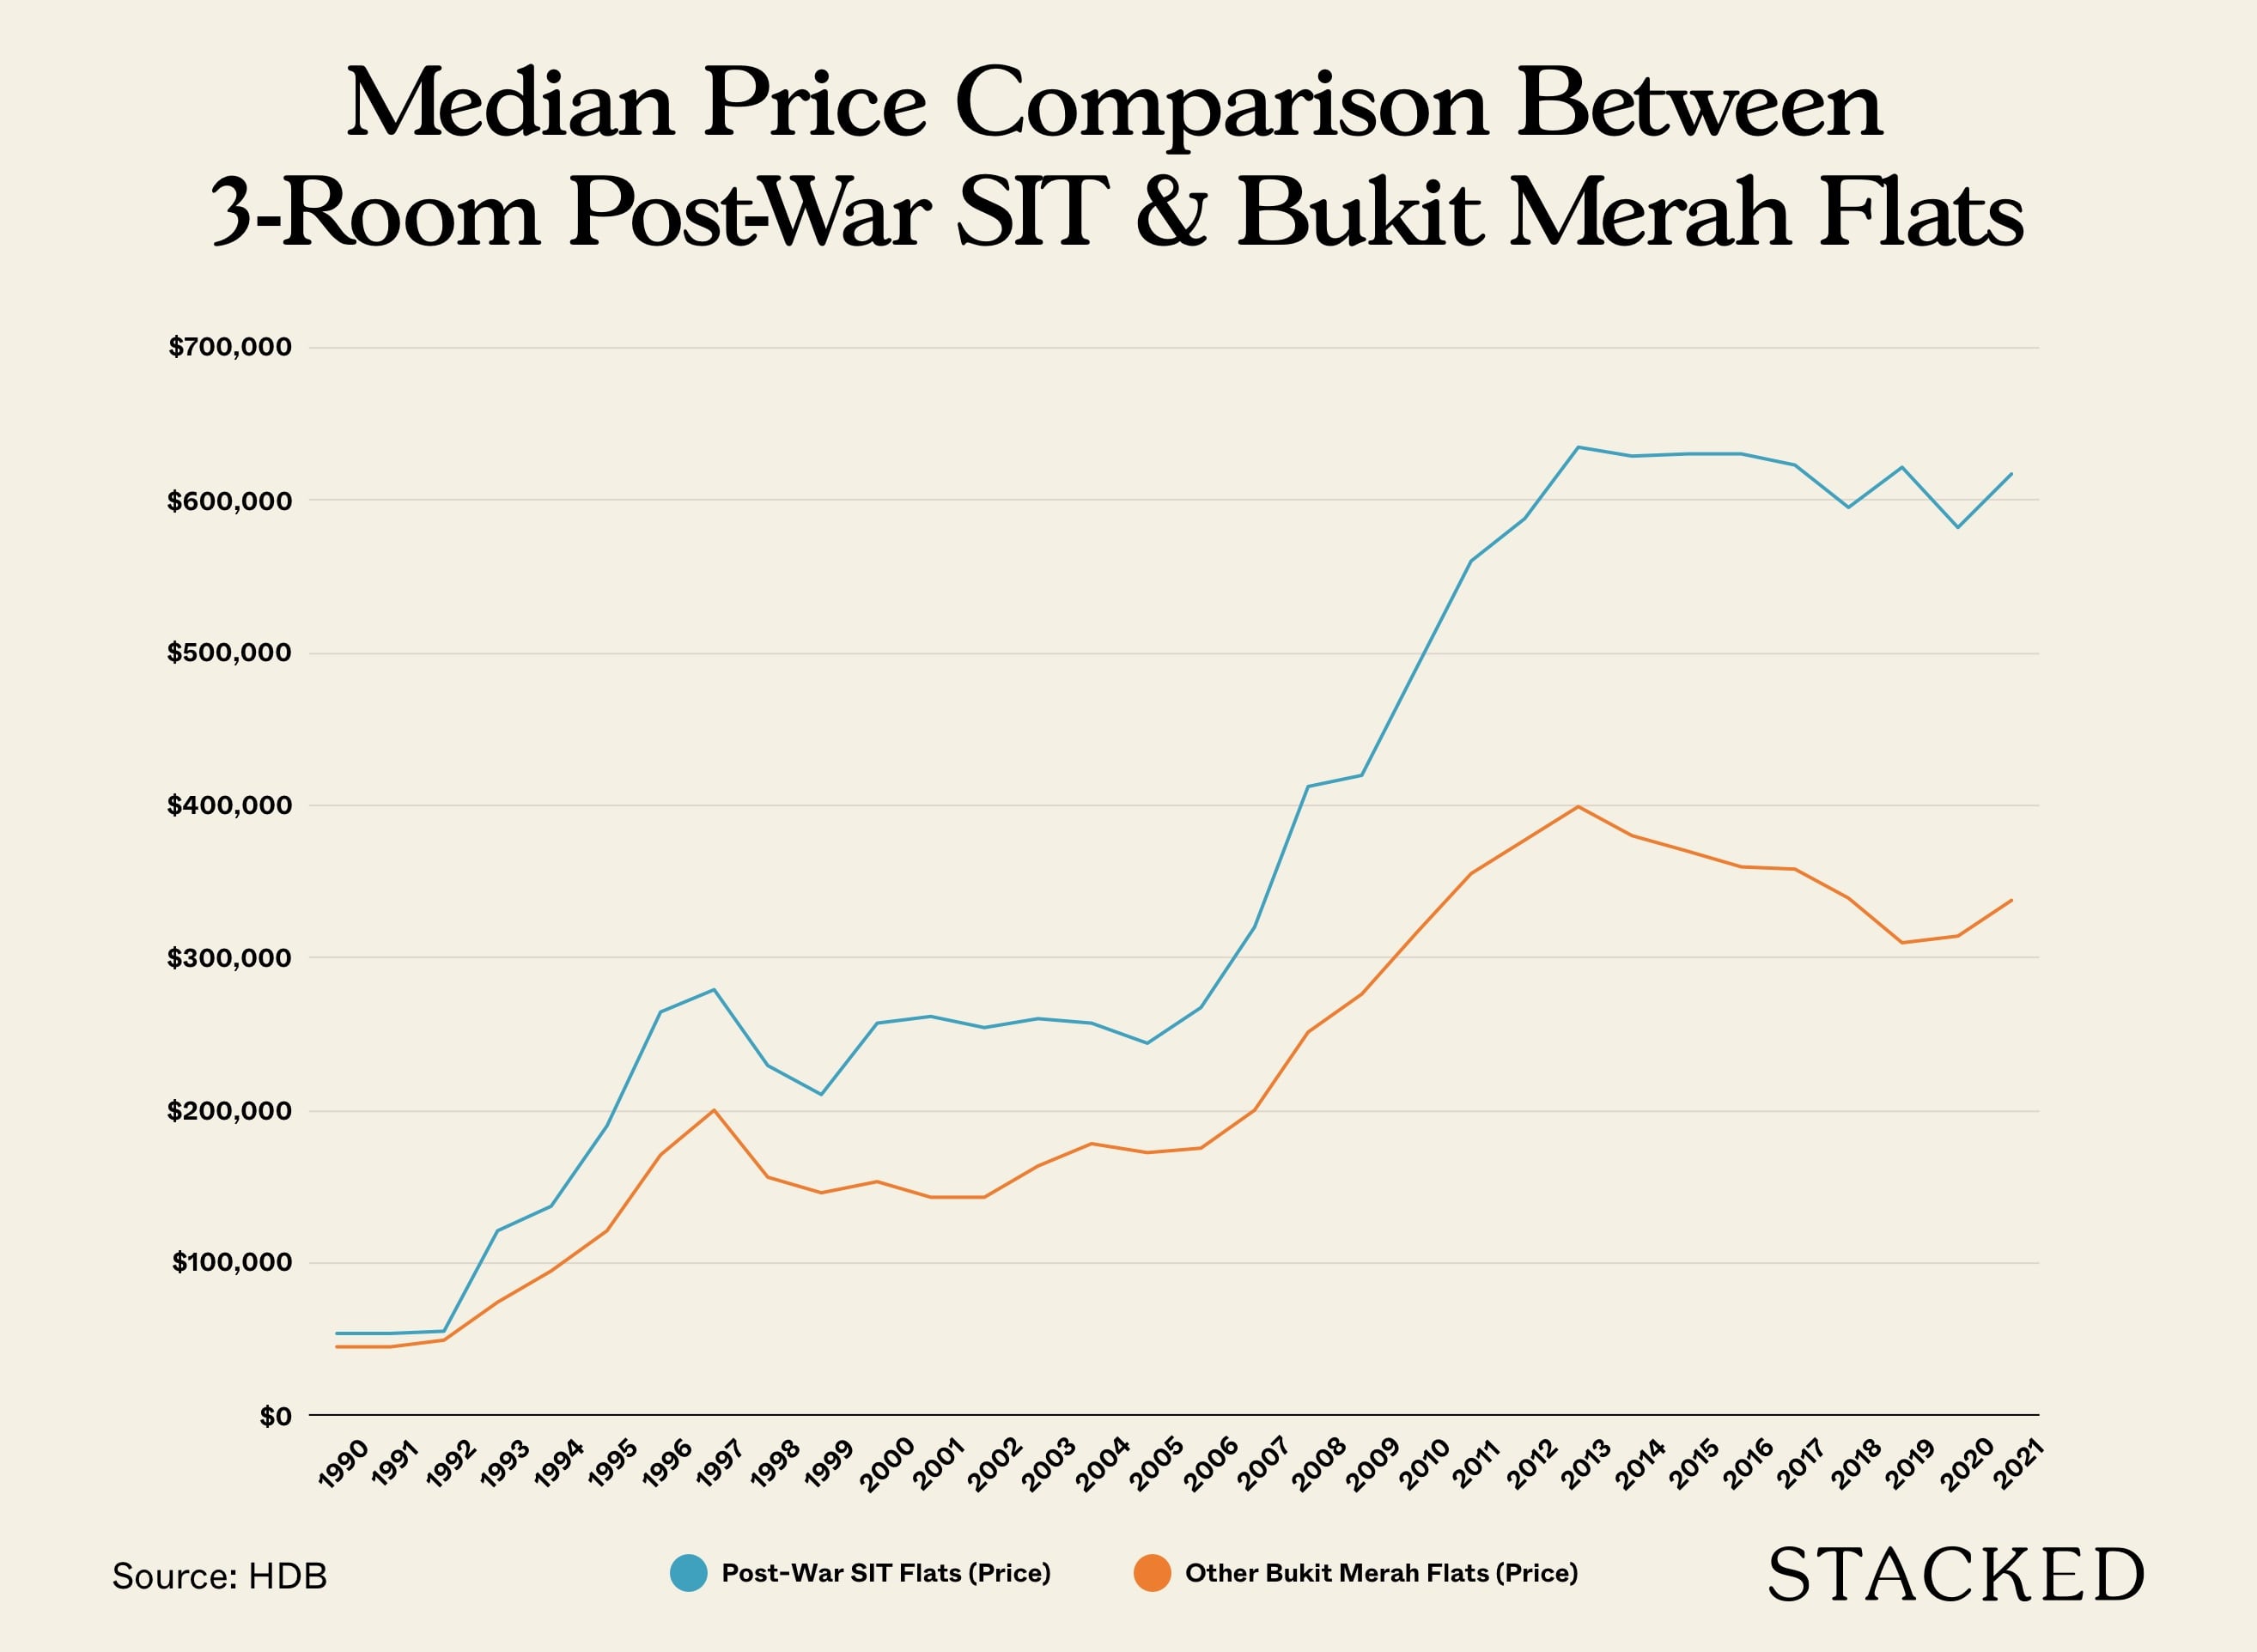
Again, it’s clear that Post-War SIT flats have done significantly better than the average Bukit Merah HDB flat. Throughout the past 30 years, prices of post-war SIT flats have never dipped below the median prices of flats in the same estate.
Value in scarcity?
Here’s a thought: as there are only that many post-war Tiong Bahru flats around steeped in the rich heritage and history of the area, these flats would naturally see higher demand.
This is even more so since it is located in quite a prime area which would be attractive to foreigners looking to rent a neighbourhood with a local charm.
But is this really the case? Let’s examine what the rental data tells us.
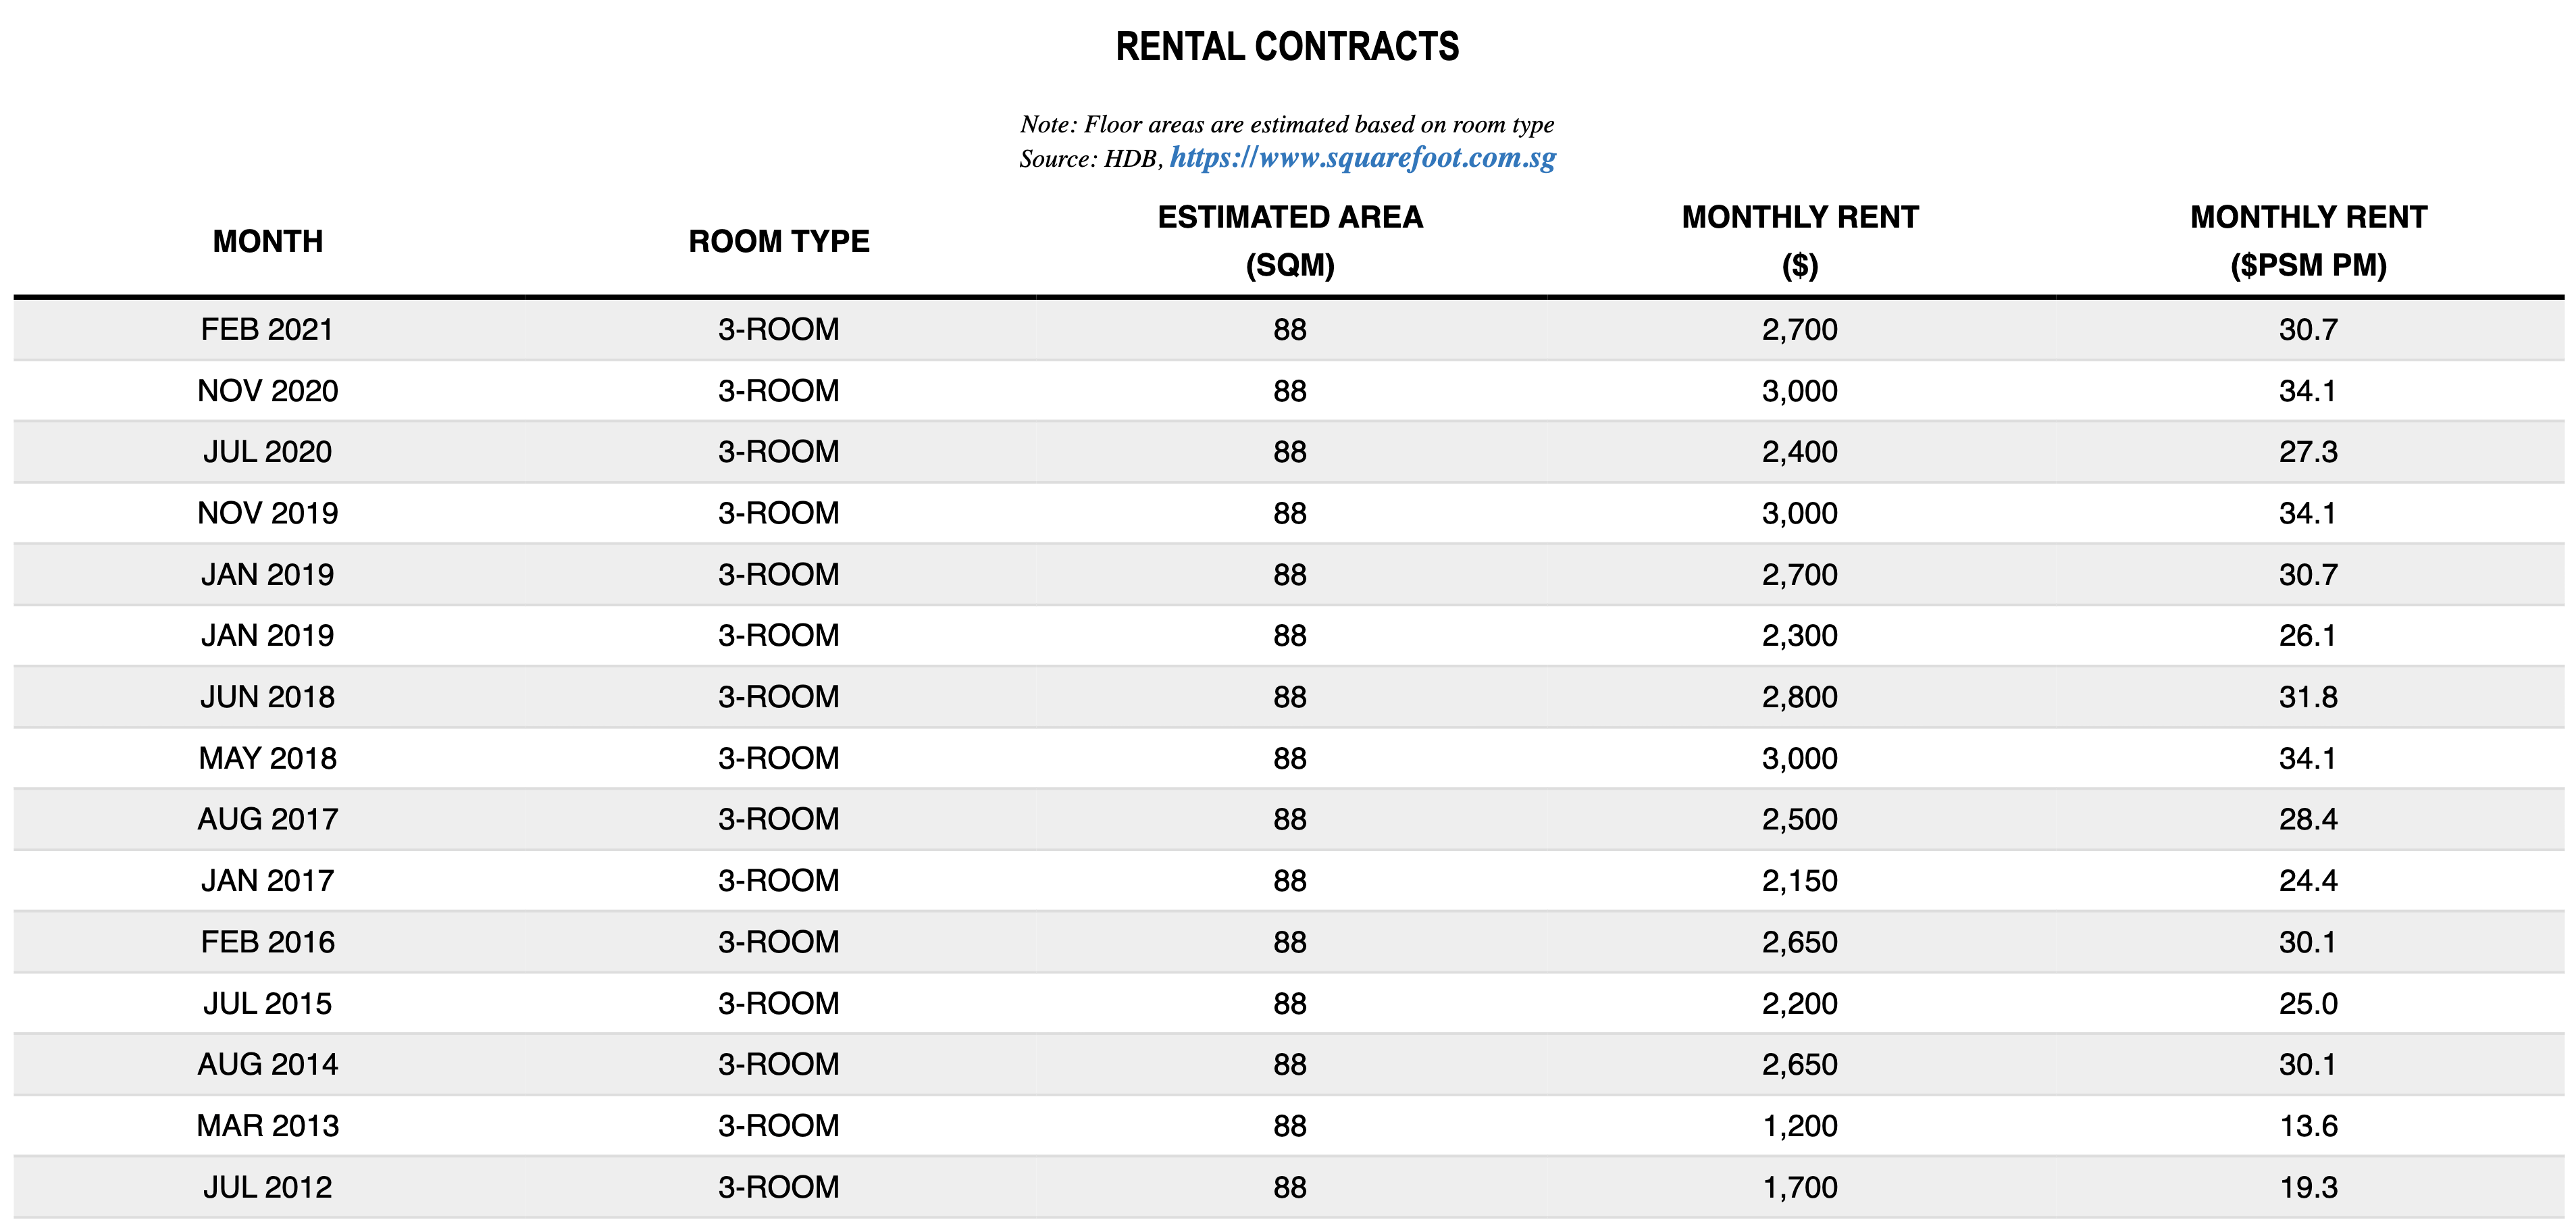
And here’s what median rent for the post-war flats against the median rent of the entire Bukit Merah estate.
| Year | Post-War SIT Flat Median Rent | Bukit Merah Median Rent (Q1 Of Each Year) |
| 2012 | $2,400 | $2,000 |
| 2013 | $2,550 | $2,200 |
| 2014 | $2,700 | $2,210 |
| 2015 | $2,800 | $2,200 |
| 2016 | $2,600 | $2,100 |
| 2017 | $2,650 | $2,000 |
| 2018 | $2,700 | $1,900 |
| 2019 | $2,600 | $1,900 |
| 2020 | $2,700 | $1,900 |
| 2021 | $2,525 | $2,000 |
It doesn’t take long to see that the 3-room flats in the walk-ups commands a higher monthly rental.
What do the yields look like?
| Year | Post-War Annual Rent | Post-War Price | Post-War Yield | Bukit Merah Annual Rent | Bukit Merah Price | Bukit Merah Yield |
| 2012 | $28,800 | $587,500 | 4.90% | $24,000 | $378,000 | 6.35% |
| 2013 | $30,600 | $635,650 | 4.81% | $26,400 | $400,000 | 6.60% |
| 2014 | $32,400 | $629,000 | 5.15% | $26,520 | $380,000 | 6.98% |
| 2015 | $33,600 | $630,000 | 5.33% | $26,400 | $370,000 | 7.14% |
| 2016 | $31,200 | $630,000 | 4.95% | $25,200 | $360,000 | 7.00% |
| 2017 | $31,800 | $624,000 | 5.10% | $24,000 | $358,000 | 6.70% |
| 2018 | $32,400 | $595,000 | 5.45% | $22,800 | $340,000 | 6.71% |
| 2019 | $31,200 | $622,000 | 5.02% | $22,800 | $310,000 | 7.35% |
| 2020 | $32,400 | $581,594 | 5.57% | $22,800 | $315,000 | 7.24% |
| 2021 | $30,300 | $618,000 | 4.90% | $24,000 | $338,444 | 7.09% |
The rental yield data tells us an interesting story here. Compared to other flats in the Bukit Merah area, post-war flats have a consistently lower rental yield year on year.
On average, the yield over the past 10 years for post-war flats is about 5.12%, while other 3-room Bukit Merah flats average about 6.92%. Post-war flats have a lower rental yield of around 25-30% compared to the estate.
So why is that the case?
While a larger size means a higher price, the higher monthly rental should have helped raise the yield to match the flats in Bukit Merah. But that cannot be said here.
Rental on a per square meter basis is similar to the average in Bukit Merah as shown previously.
| Year | Post-War SIT Flat Sizes (sqm) | Post-War SIT Flat Rents | Post-War SIT Flat $PSM | Bukit Merah Sizes (sqm) | Bukit Merah Rents | Bukit Merah $PSM |
| 2012 | 88 | $2,400 | $27 | 65 | $2,000 | $31 |
| 2013 | 88 | $2,550 | $29 | 65 | $2,200 | $34 |
| 2014 | 88 | $2,700 | $31 | 65 | $2,210 | $34 |
| 2015 | 88 | $2,800 | $32 | 65 | $2,200 | $34 |
| 2016 | 88 | $2,600 | $30 | 65 | $2,100 | $32 |
| 2017 | 88 | $2,650 | $30 | 67 | $2,000 | $30 |
| 2018 | 88 | $2,700 | $31 | 65 | $1,900 | $29 |
| 2019 | 88 | $2,600 | $30 | 65 | $1,900 | $29 |
| 2020 | 88 | $2,700 | $31 | 65 | $1,900 | $29 |
| 2021 | 88 | $2,525 | $29 | 65 | $2,000 | $31 |
As yield is a function of both rental earned and market price, it could mean 2 things:
First, that the rental demand for post-war flats in Tiong Bahru is not as hot as one would imagine it to be, considering their similar $PSM value. While it is a crude measure, sharing a similar $PSM data to the rest of the estate does hint that these flats in the Tiong Bahru estate aren’t that much more special than any other typical 3-room flat in Bukit Merah.
More from Stacked
Why Emerald Of Katong Sold 99% Of Units In Just 2 Days: We Break Down The Sale Prices
Here’s a little-known way to gauge just how attractive a new condo really is: check how many property agents have…
Second, prices for post-war flats are high. You can see from the market price’s $PSF data that post-war flats have consistently been higher.
This boils down to the overall desirability of living in this area by local purchasers. Considering how the yields aren’t that impressive, plus the fact that this is still an HDB (meaning you cannot rent out the whole unit as the standard 5-year MOP applies), there could be many genuine homeowners who are just willing to pay a premium to stay here.
But the lease is so low, are they out of their minds?
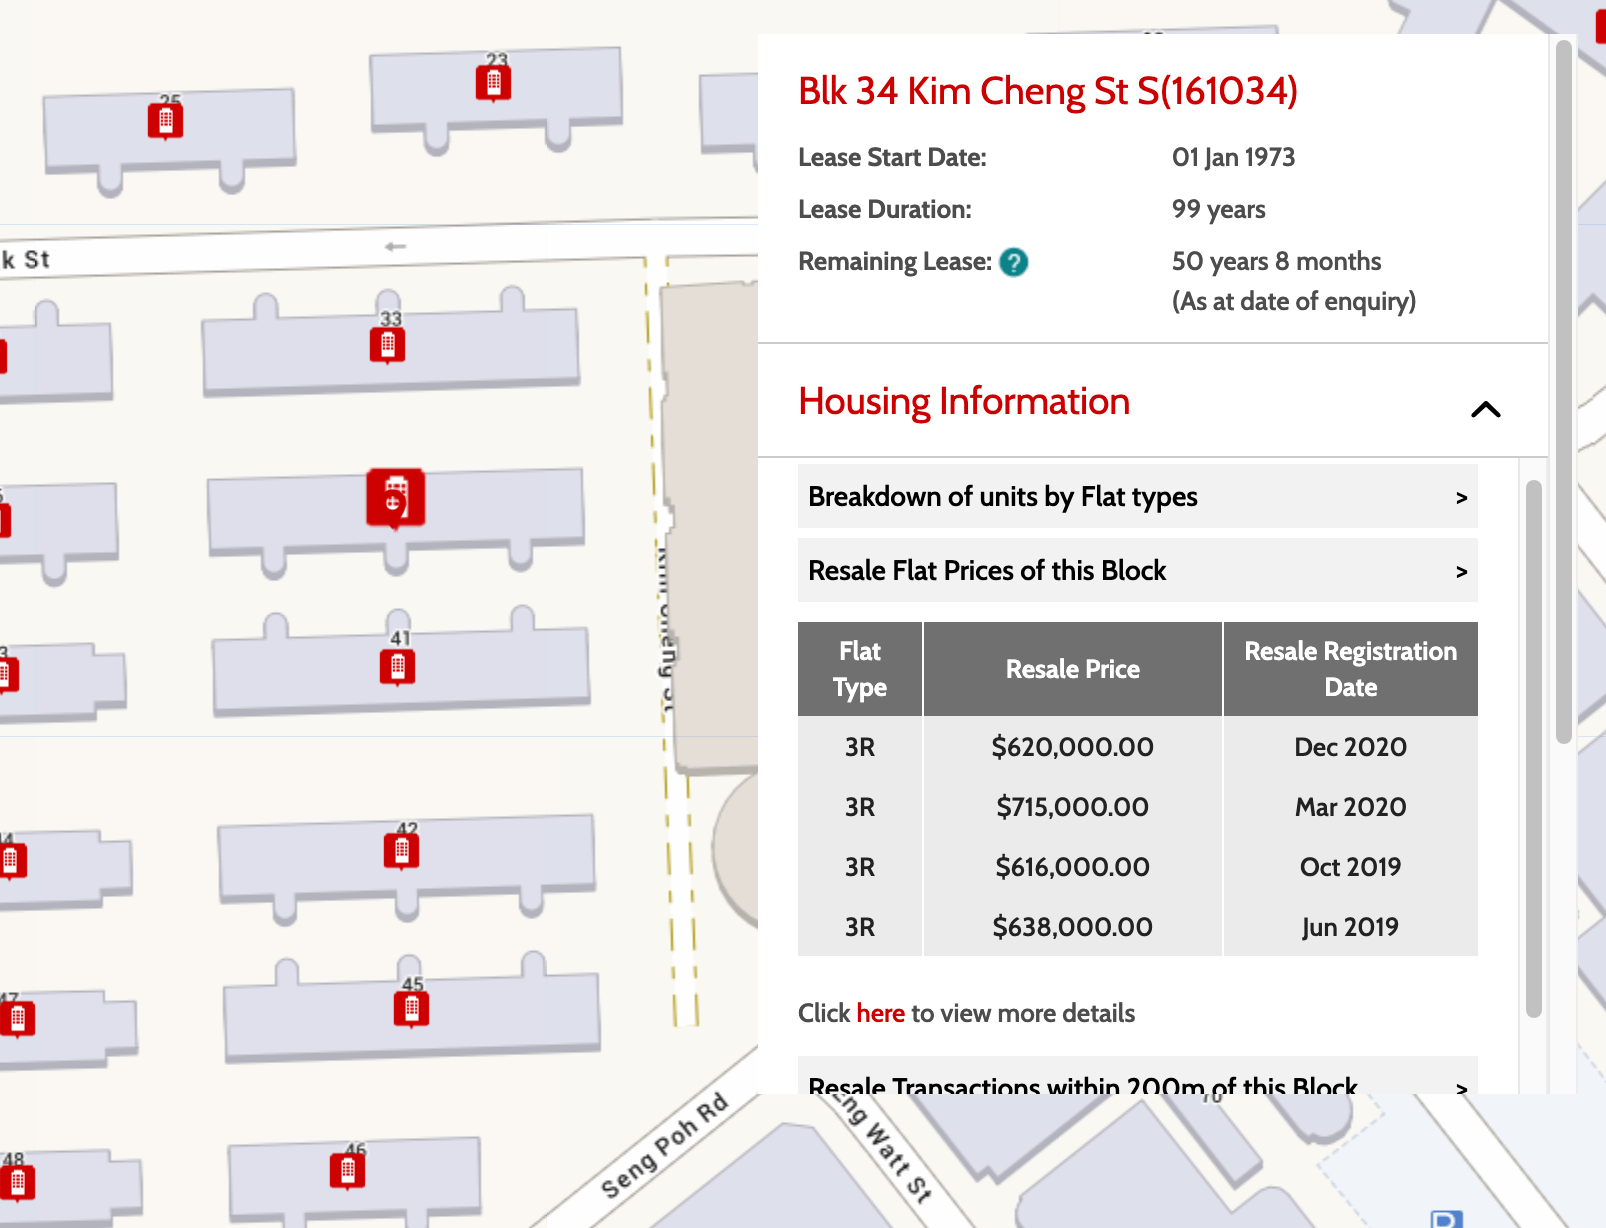
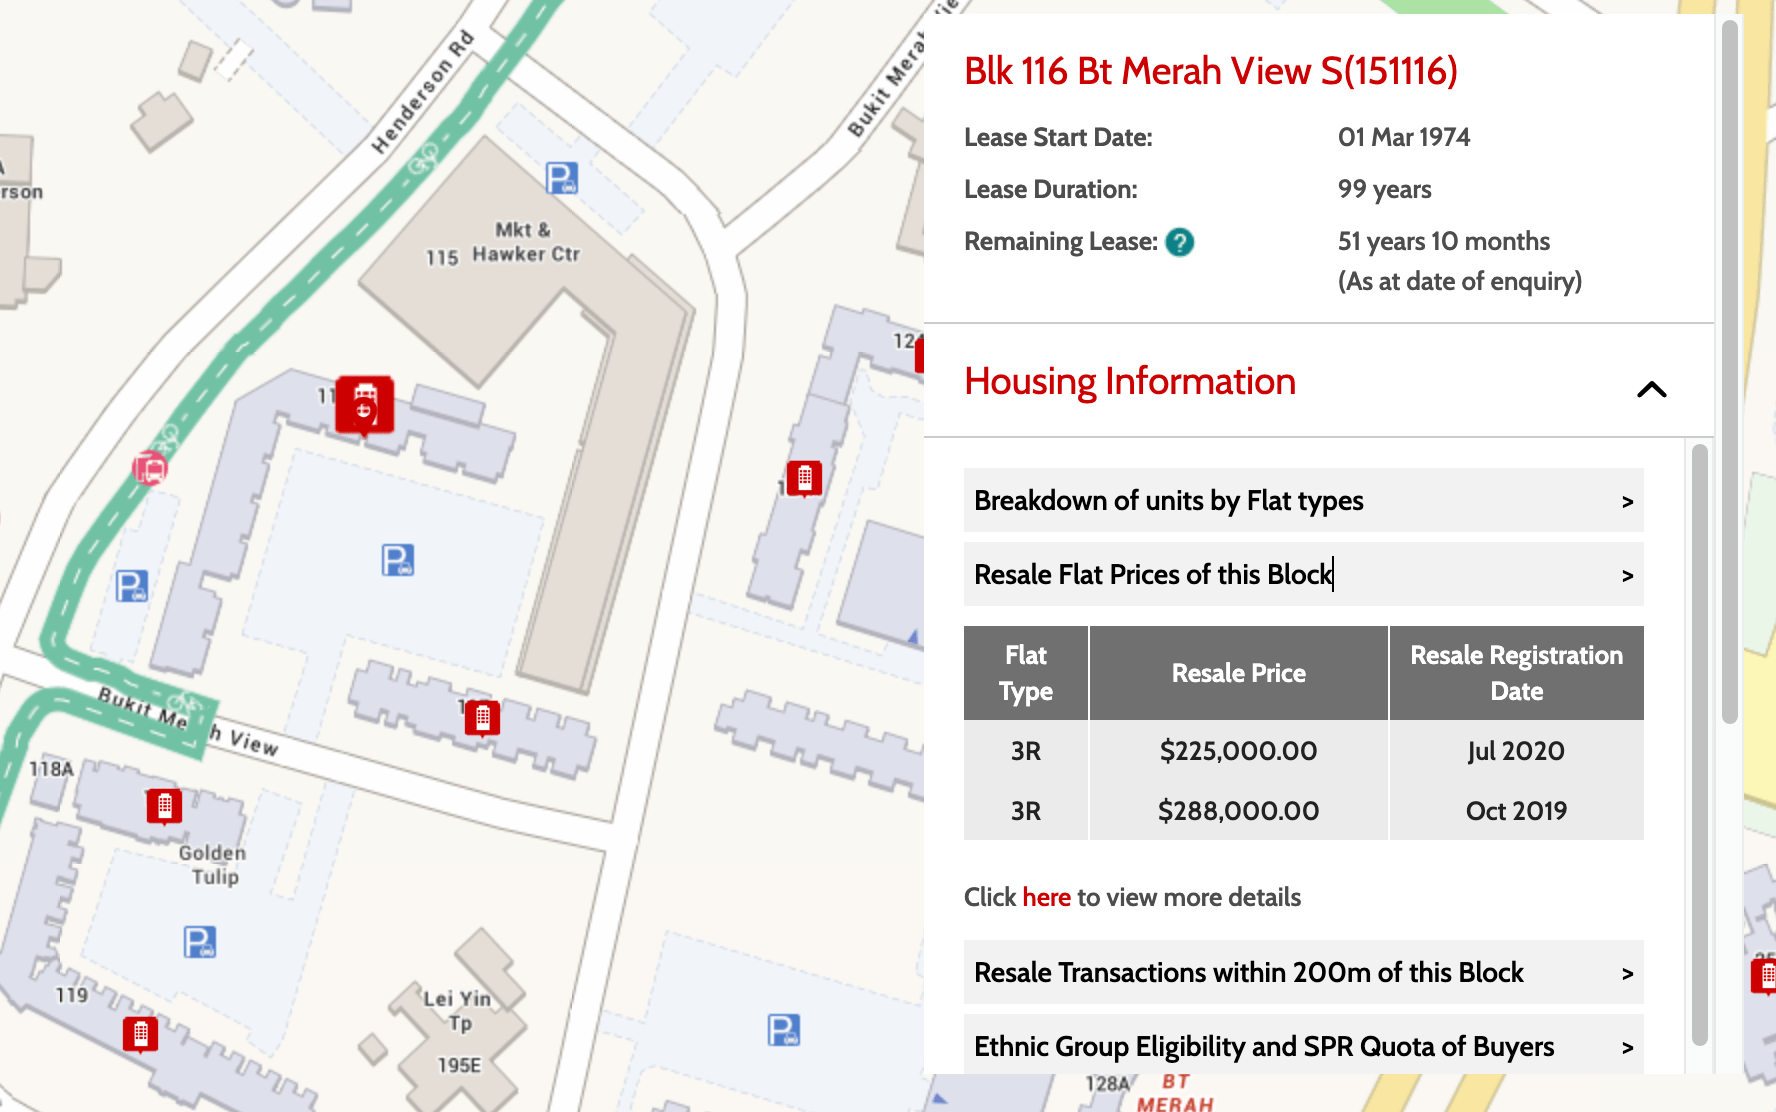
Bukit Merah is a very mature estate, so there are a lot of old flats there. The post-war flats, however, do have just around 50 years left (as of this writing), or about half its age remaining.
But what is crazy is that prices have continued to nudge upwards and the gap between $PSM of post-war flats and other flats in Bukit Merah have maintained or widened despite the relatively similar completion year from actual transactions.
I wouldn’t blame you if you thought this was irrational. But is there a reason for this madness?
One reason (besides the location) why homeowners are willing to pay a premium to stay here could be due to the possibility of SERS (Selective En Bloc Redevelopment Scheme).
For the uninitiated, SERS is an exercise implemented to renew older housing estates before the lease is up. It’s generally seen as a plus point given how HDB would compensate owners while providing a fresh lease in a new HDB flat.
Given that the Tiong Bahru area is literally the definition of an old housing estate, there will definitely be some homeowners who are hopeful of this exit possibility. Selling a post-war flat 10 to 20 years down the road would likely be a loss-making exercise given the exponential lease decay, so this is the only financially viable exit left for such a development.
But homeowners here have reason to be hopeful. After all, the very first SERS exercise ever conducted was conducted on some SIT flats built in Tiong Bahru/Boon Tiong Road.
Owners who buy now and hold for 10-20 years may increasingly see a diminishing chance of SERS (hey, the government could just wait you out, you know?).
Paying a premium in the hope of SERS would be doubly-loss making. As the years go by and the reality of SERS diminishes, the prices of these flats could fall much faster.
There may also be no real hurry to rejuvenate this estate. Some of the SIT flats north of Tiong Bahru Road have already gone through SERS.
The remaining blocks do take up a considerable amount of space near the conserved pre-war flat areas which does nicely blend in with the Tiong Bahru enclave, so a decision to rejuvenate this area would see many SIT flats disappear in Tiong Bahru – a significant change to the area.
All that being said, I am torn on this issue as well (it’s anyone’s guess, really). The HDB may see this low density area as a way to make money – compensate a small number of owners, and sell high-rise premium HDB flats that many would be willing to pay for does sound like a lucrative deal.
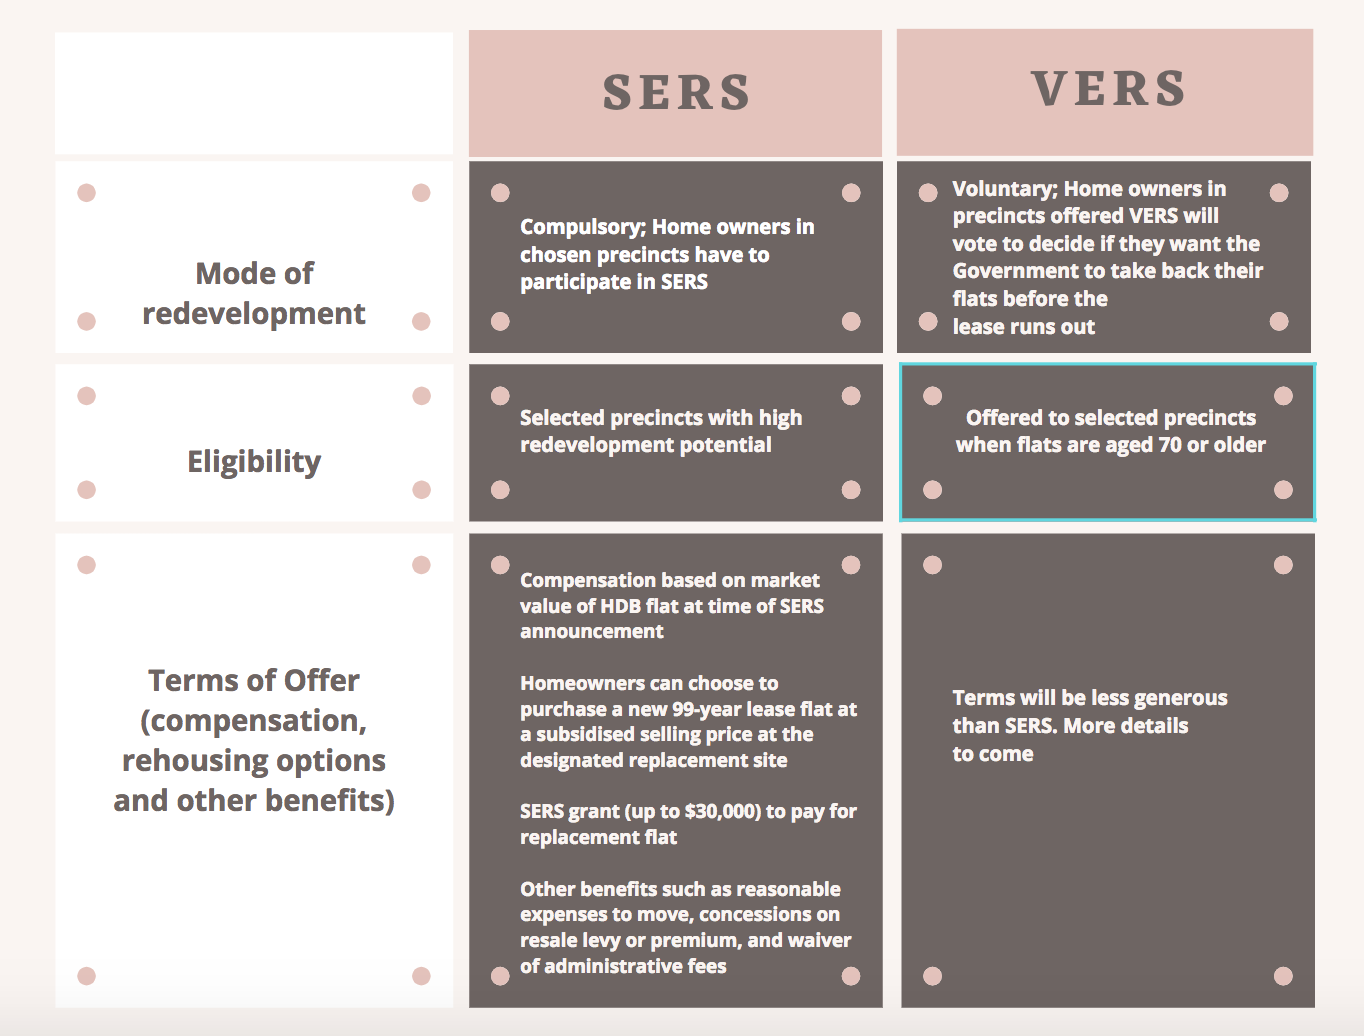
Moreover, the introduction of VERS (Voluntary Early Redevelopment Scheme) is still a possibility, but of course the returns from this exercise isn’t expected to be anywhere near what SERS can offer – even more so as VERS can only be done if the estate is 70 years or older (another 20 more years to go!).
Property Market CommentaryHDB VERS – Good news? Here is everything you need to know
by Sean GohThe pre-war site: What does the data tell us?
I wasn’t able to find actual transactions of pre-war flat transactions, but media coverage and listings found on online portals do serve as a guide on what prices would look like.
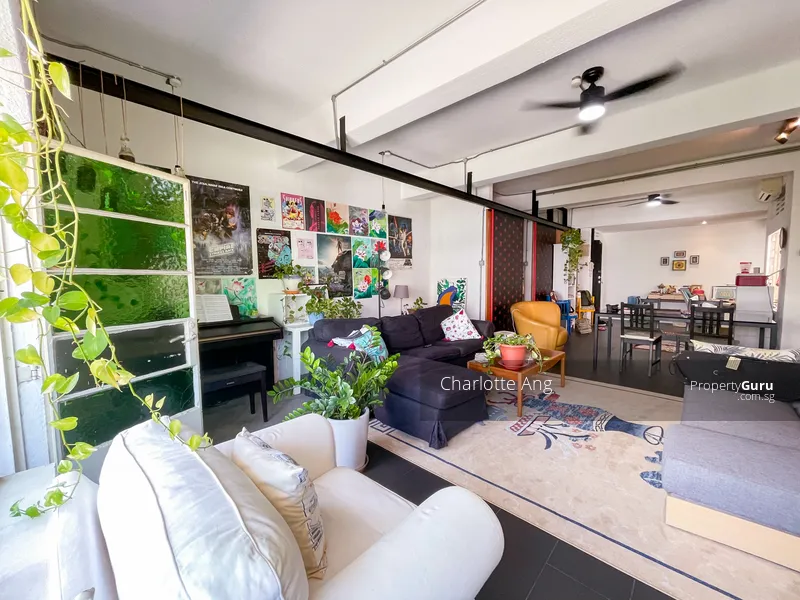
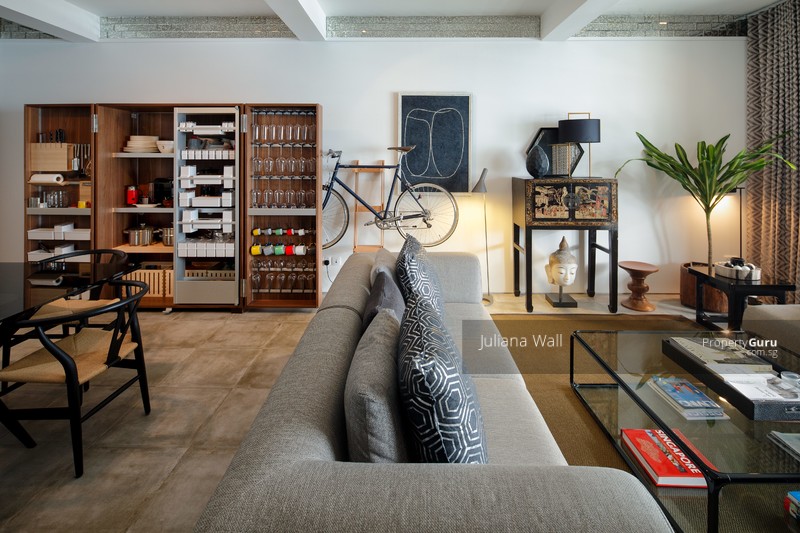
An article by Edgeprop highlighted that in December 2020, a buyer who purchased a unit at 57 Eng Hoon Street paid $928,000, and managed to secure a tenant for $4,000 a month.
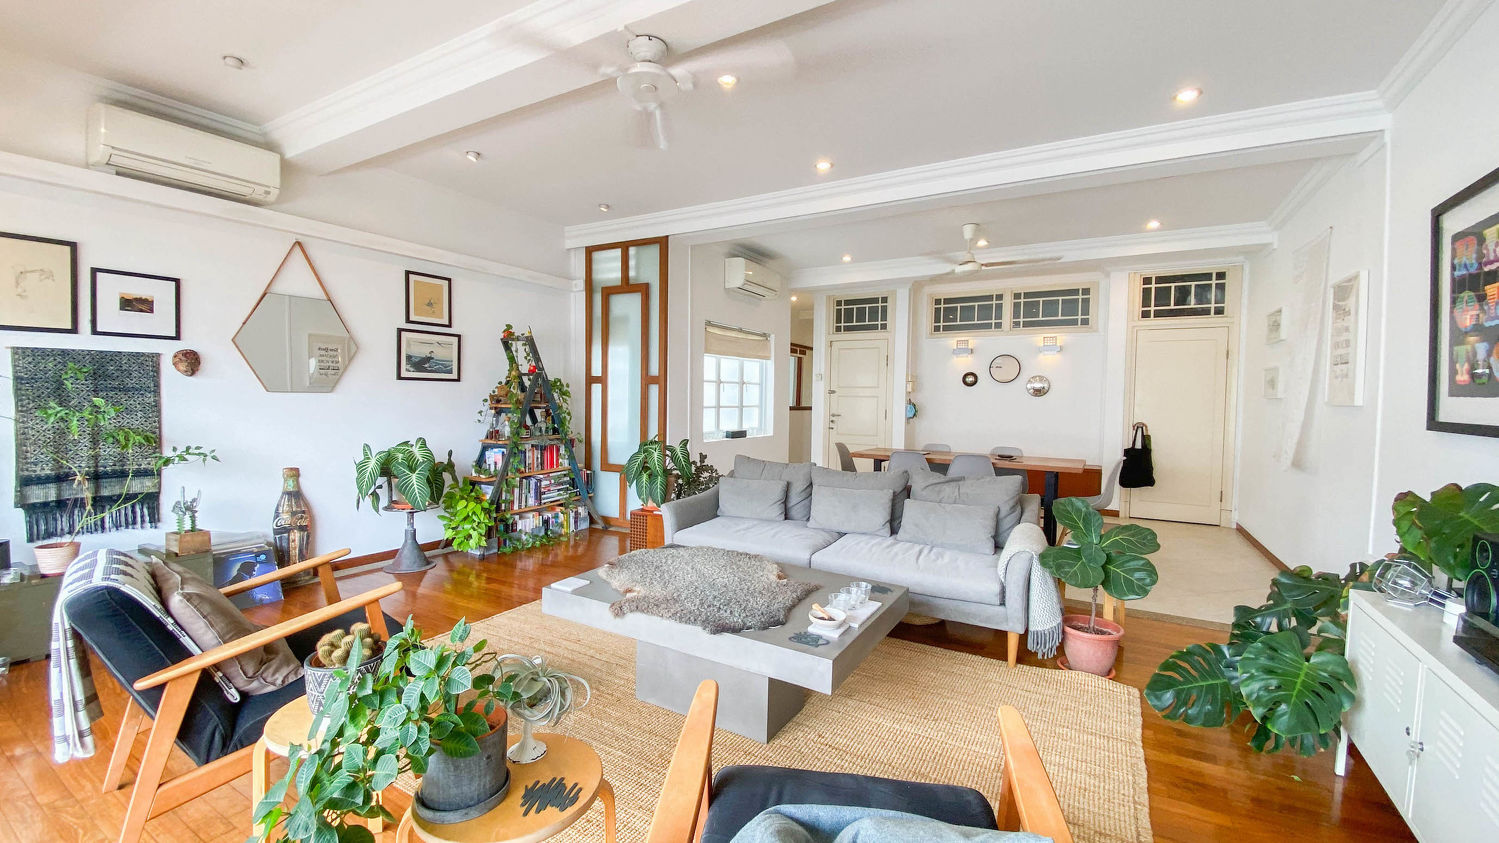
As these units are privatised, buyers would not face the same 5-year MOP restrictions, and so renting out the entire flat immediately is possible. Being privatised naturally means that prices are higher.
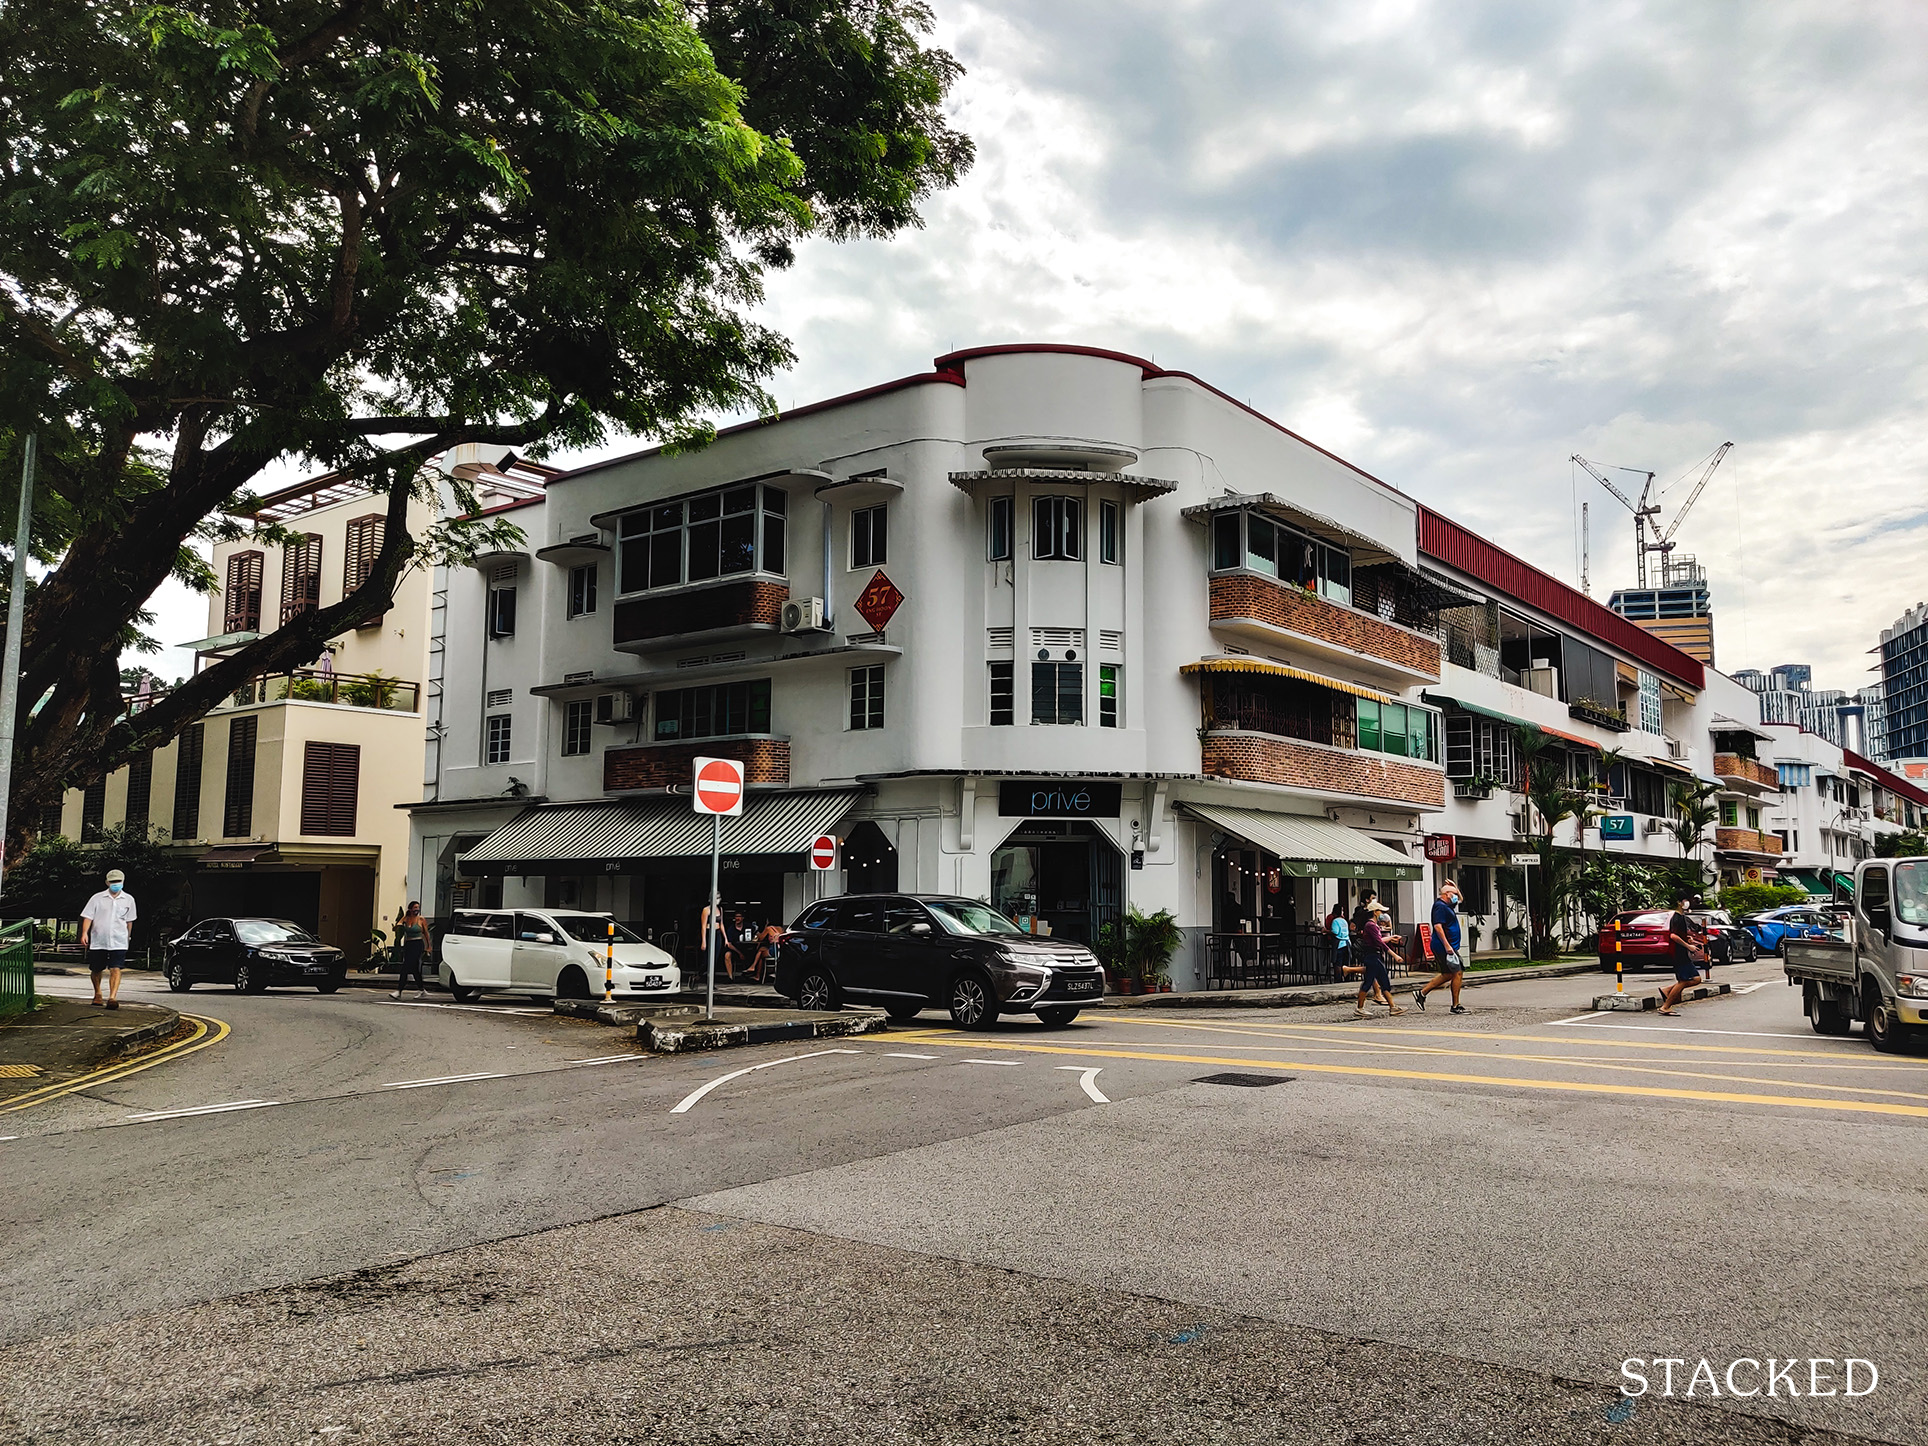
On a $PSF level, the flat at 57 Eng Hoon Street traded for $908 psf. This is a 35% premium compared to the post-war flats based on 2021 transaction data.
But unlike the post-war flats, the pre-war flats are conserved, meaning that the possibility of SERS or VERS is out of the question.
There is no redevelopment potential here. So does this pricing make sense?
Let’s examine the case for purchasing a pre-war flat for the purpose of rental investment.
For our analysis, we’ll be using the transacted price of $928,000 and the rental of $4,000 per month as indicated in the article.
A simplified calculation would be to take the 44 years left x the annual rent of $48,000 which comes up to $2,112,000. Minus the cost of purchase at $928,000 and you’ll net $1.184 million over 44 years. Sounds like a lot, right?
But we have to take into account the costs associated with property ownership.
Here’s a look at the theoretical price of the flat over these 44 years, as well as the net income and return on investment from such a purchase:
| Year | Theoretical Value | Gross Rental | Net Income | Cumulative Gains | Total Invested | Returns |
| 2021 | $928,000 | $48,000 | $2,281 | -$6,885 | $249,107 | -2.6% |
| 2022 | $918,834 | $48,000 | $25,298 | $8,926 | $266,559 | 3.1% |
| 2023 | $909,346 | $48,000 | $25,887 | $24,993 | $284,363 | 7.8% |
| 2024 | $899,527 | $48,000 | $26,488 | $41,318 | $302,527 | 11.8% |
| 2025 | $889,364 | $48,000 | $27,100 | $57,900 | $321,058 | 15.2% |
| 2026 | $878,845 | $48,000 | $27,726 | $74,738 | $339,962 | 18.1% |
| 2027 | $867,958 | $48,000 | $28,363 | $91,834 | $359,248 | 20.7% |
| 2028 | $856,690 | $48,000 | $29,014 | $109,186 | $378,923 | 22.9% |
| 2029 | $845,028 | $48,000 | $29,678 | $126,793 | $398,996 | 24.8% |
| 2030 | $832,957 | $48,000 | $30,355 | $144,655 | $419,473 | 26.5% |
| 2031 | $820,464 | $48,000 | $31,046 | $162,770 | $440,364 | 28.1% |
| 2032 | $807,534 | $48,000 | $31,751 | $181,138 | $461,677 | 29.4% |
| 2033 | $794,151 | $48,000 | $32,470 | $199,757 | $483,419 | 30.6% |
| 2034 | $780,300 | $48,000 | $33,203 | $218,624 | $505,601 | 31.7% |
| 2035 | $765,964 | $48,000 | $33,951 | $237,737 | $528,230 | 32.7% |
| 2036 | $751,126 | $48,000 | $34,715 | $257,095 | $551,316 | 33.6% |
| 2037 | $735,769 | $48,000 | $35,494 | $276,694 | $574,868 | 34.4% |
| 2038 | $719,875 | $48,000 | $36,288 | $296,532 | $598,896 | 35.1% |
| 2039 | $703,424 | $48,000 | $37,099 | $316,604 | $623,408 | 35.7% |
| 2040 | $686,397 | $48,000 | $37,926 | $336,907 | $648,415 | 36.3% |
| 2041 | $668,775 | $48,000 | $38,380 | $357,048 | $673,927 | 38.5% |
| 2042 | $650,535 | $48,000 | $38,380 | $376,550 | $699,954 | 40.6% |
| 2043 | $631,657 | $48,000 | $38,380 | $395,392 | $726,506 | 42.6% |
| 2044 | $612,119 | $48,000 | $38,380 | $413,549 | $753,594 | 44.6% |
| 2045 | $591,897 | $48,000 | $38,380 | $430,999 | $781,229 | 46.4% |
| 2046 | $570,967 | $48,000 | $38,380 | $447,717 | $809,422 | 48.2% |
| 2047 | $549,304 | $48,000 | $38,380 | $463,676 | $838,184 | 50.0% |
| 2048 | $526,883 | $48,000 | $38,380 | $478,850 | $867,526 | 51.6% |
| 2049 | $503,677 | $48,000 | $38,380 | $493,212 | $897,461 | 53.1% |
| 2050 | $479,660 | $48,000 | $38,380 | $506,734 | $928,000 | 54.6% |
| 2051 | $454,801 | $48,000 | $38,380 | $519,386 | – | 56.0% |
| 2052 | $429,073 | $48,000 | $38,380 | $531,137 | – | 57.2% |
| 2053 | $402,444 | $48,000 | $38,380 | $541,956 | – | 58.4% |
| 2054 | $374,883 | $48,000 | $38,380 | $551,810 | – | 59.5% |
| 2055 | $346,357 | $48,000 | $38,380 | $560,666 | – | 60.4% |
| 2056 | $316,833 | $48,000 | $38,380 | $568,489 | – | 61.3% |
| 2057 | $286,276 | $48,000 | $38,380 | $575,242 | – | 62.0% |
| 2058 | $254,649 | $48,000 | $38,380 | $580,888 | – | 62.6% |
| 2059 | $221,916 | $48,000 | $38,380 | $585,389 | – | 63.1% |
| 2060 | $188,036 | $48,000 | $38,380 | $588,703 | – | 63.4% |
| 2061 | $152,971 | $48,000 | $38,380 | $590,791 | – | 63.7% |
| 2062 | $116,678 | $48,000 | $38,380 | $591,608 | – | 63.8% |
| 2063 | $79,116 | $48,000 | $38,380 | $591,111 | – | 63.7% |
| 2064 | $40,238 | $48,000 | $38,380 | $589,253 | – | 63.5% |
This analysis assumes a loan of 20 years is taken with a 25% down payment made with an annual interest rate of 2%. While interest rates are low now, we’ve assumed 2% as an average over these 20 years. A lower tenure than the usual 30 years is assumed due to the low lease remaining.
The following costs are assumed:
- Buyers Stamp Duty
- Agent fees for renewing of lease (0.5 months per year)
- Interest cost
- Property tax (the Annual Value is assumed to be the rental rate though it is usually lower, so treat this as a conservative amount)
- Maintenance fees of $200 is assumed per month
- Depreciation costs (using a 3.5% discount factor)
Income is assumed to be a consistent $4,000 per month (which is conservative) and the depreciation is netted off from the cumulative gains.
This allows us to establish what the returns are at any point when the property is liquidated, since past depreciation costs have been accounted for.
Here is what the chart of the price, cumulative investment and gains less depreciation look like:
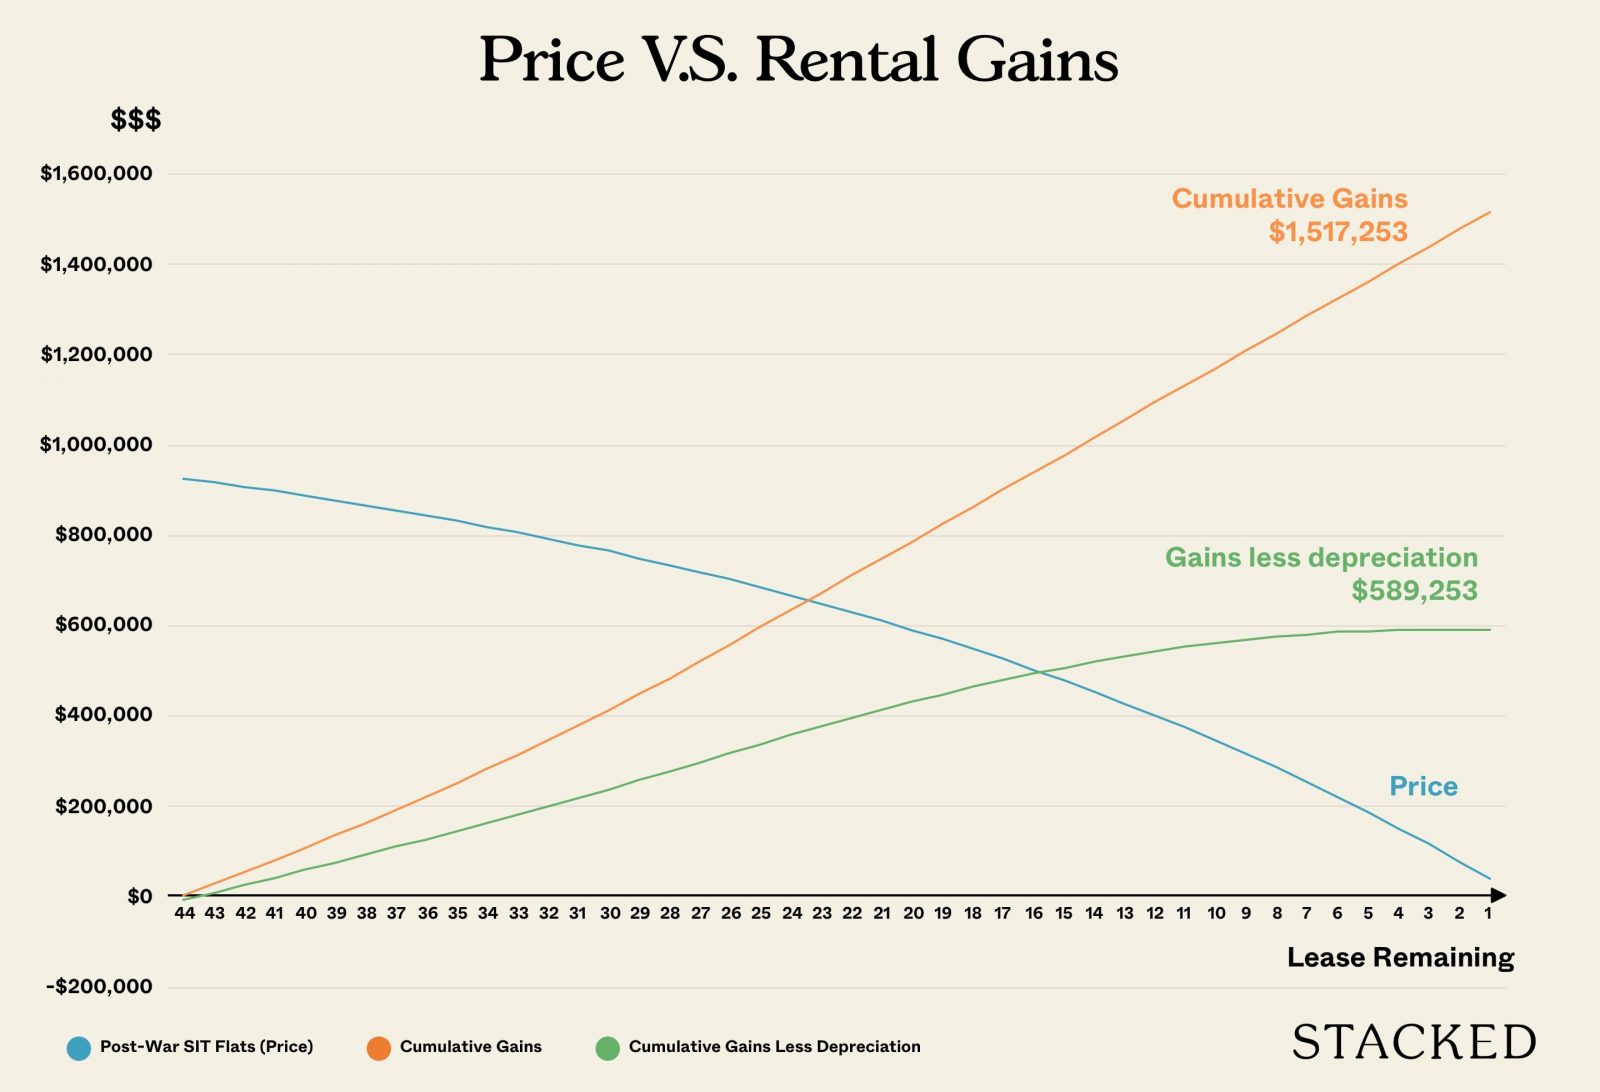
Of interest is the return on investment. This is the cumulative income earned after all costs have been accounted for as a proportion of the total monies put in so far (down payment plus subsequent principal paid).
If we can express the returns earned in a chart, it would look like this:
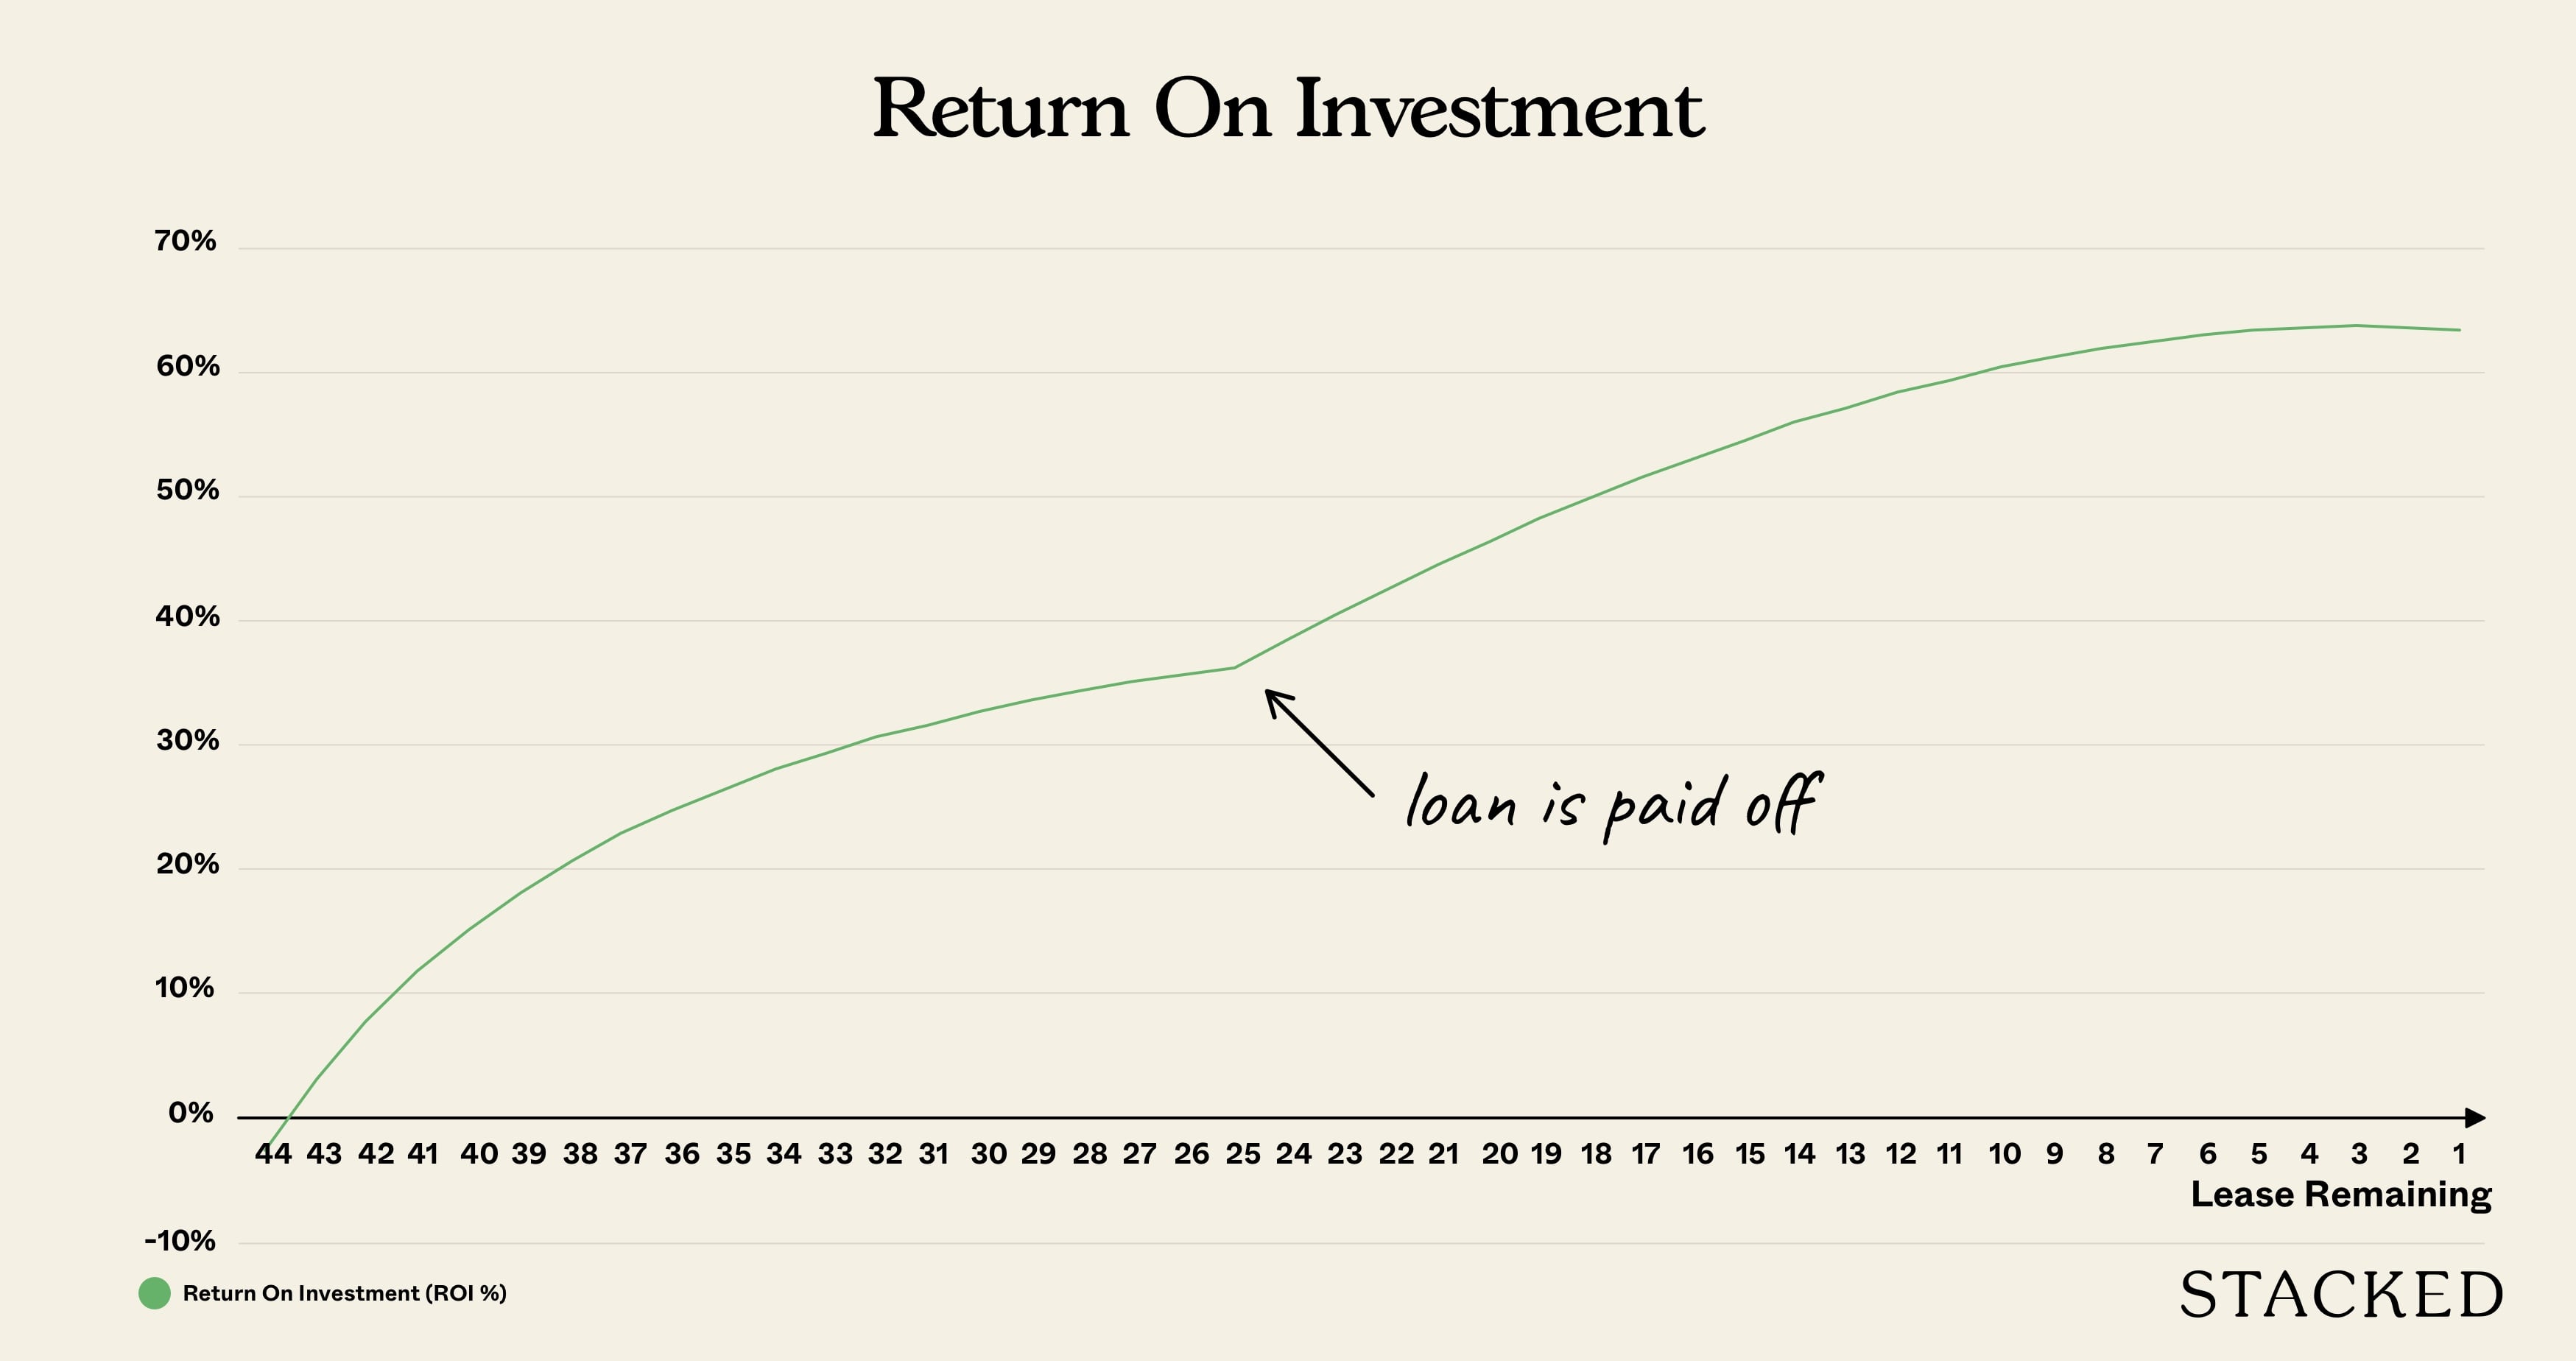
Initially, returns are negative mainly due to the stamp duty, but it increases at a decreasing rate.
By 2041, you’ll notice a bump up – this is because the bank loan is completely paid up, and principal payments are no longer made, so the total investment remains the same while rental continues to come in. The rate of return also falls as depreciation accelerates up until it actually becomes unprofitable to hold onto it in the final few years.
In 10 years, the owner would have achieved a 28% return on investment.
In 20 years, it is 38.5%, while in 30 years, it is 56%.
As you can see, the longer you hold onto this property, the lesser the return on investment given the accelerating depreciation while the rental remains the same. That is up until the loan is paid off. The returns then accelerate again, but the same pattern repeats as the depreciation continues to increase.
At the end of the 44 years, the net gain is $589,253, while the total invested is $928,000, which leaves the investor with a return of 63.5%.
63.5% over 44 years. Does this sound like a superb investment?
Absolutely not. From $1.184 million previously assumed in the simplified calculation to just under $600K. Even if you doubled your returns, 44 years is way too long a wait.
This is not such a good investment if you also consider the amount of effort you would have to put in. In fact, dumping your money in the stock market and closing your eyes for 44 years would probably earn you more plus save you the trouble of dealing with tenants each year.
Why would anyone make the purchase then?
If you look at the history of Singapore’s property market prices, the theoretical depreciation hasn’t quite been an accurate depiction of leasehold properties here. This includes very old pre-war SIT flats whose lease started in 1967.
Investors who purchase such properties for investment do not hope to hold it till the lease reaches 0. If you could sell it for just a few thousand dollars less in 5 years, your return looks to be a lot more promising.
And this is really the story of every old leasehold property (mainly HDBs) in Singapore. The question of when depreciation would really kick in.
Not even the minister knows this given how unique the Singapore property market is, and how this has never happened before.
So should you buy a pre-war/post-war flat?
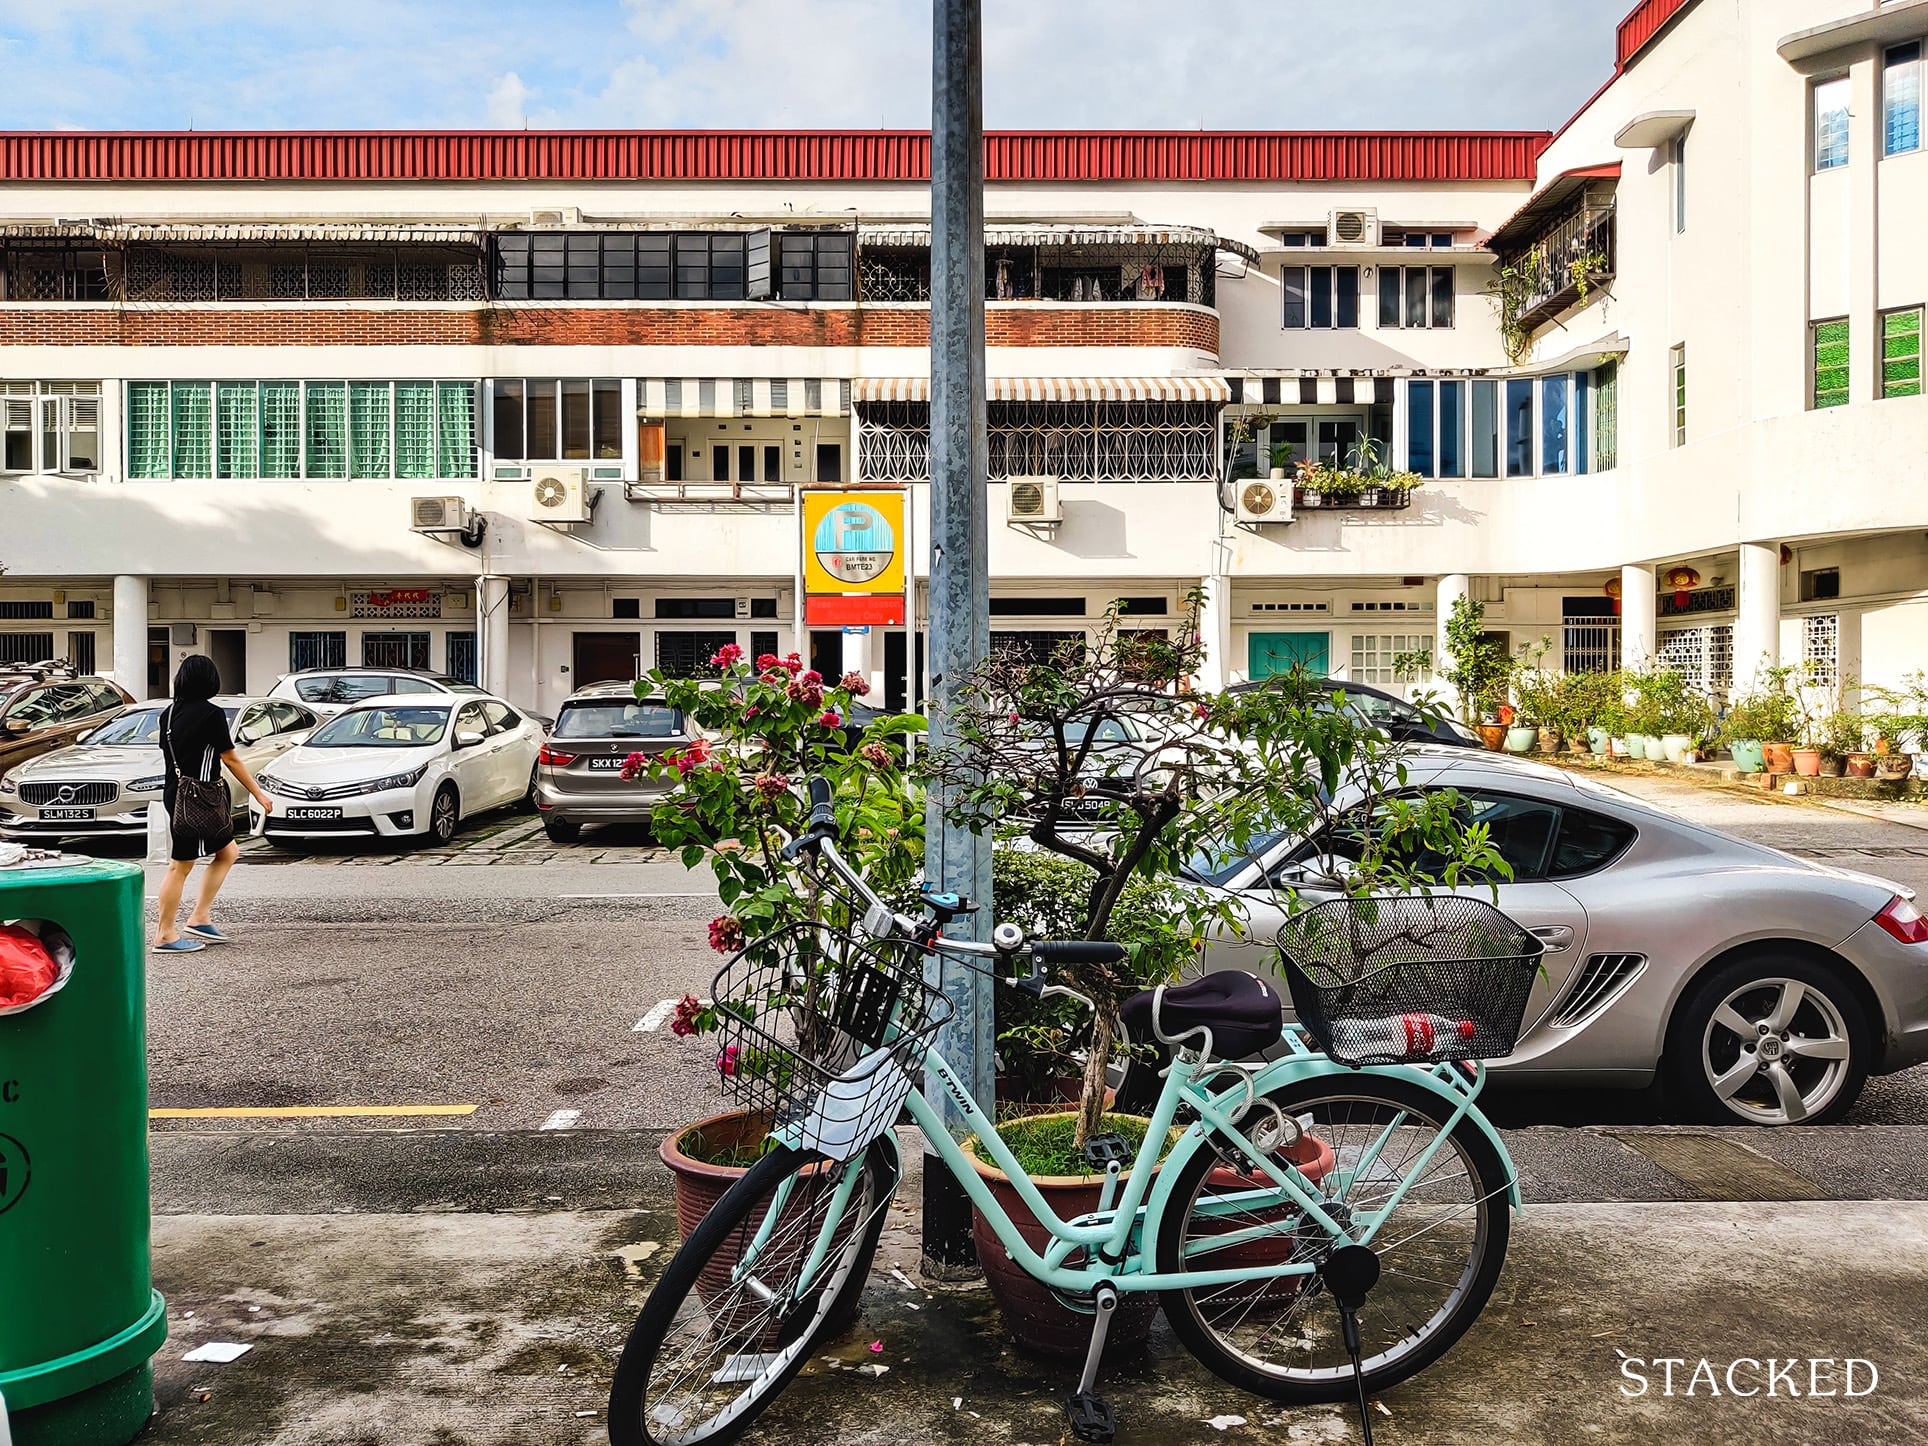
At the end of the day, I do believe that such flats are great if you really love the neighbourhood and want to purchase it for own stay reasons.
It offers something that no other estate does: a rustic charm in a neighbourhood full of heritage and steeped in history. If you’re someone who wants to stay in an idyllic central urban area, then these flats are worth considering.
In fact, I do think that many owners who pay the hefty price to stay here cite the vibes and surroundings as one reason why they are willing to pay top dollar for these flats, while treating SERS as a bonus. These owners are young families who could be making enough money not to be worried about the lease decay. You could say that Tiong Bahru is an area that’s rich in many ways.
Of course, the post-war flats could achieve SERS in a few years time, but if it doesn’t, would you be in anguish holding onto an ageing asset?
If the answer is yes, then I’d move past this area.
At Stacked, we like to look beyond the headlines and surface-level numbers, and focus on how things play out in the real world.
If you’d like to discuss how this applies to your own circumstances, you can reach out for a one-to-one consultation here.
And if you simply have a question or want to share a thought, feel free to write to us at stories@stackedhomes.com — we read every message.
Frequently asked questions
Why are some flats in Tiong Bahru so expensive despite having few years left on their lease?
What is the difference between pre-war and post-war flats in Tiong Bahru?
Are flats in Tiong Bahru good investments considering their high prices and low lease remaining?
How does the rental yield of post-war flats in Tiong Bahru compare to other flats in Bukit Merah?
What are the potential risks of buying a post-war flat in Tiong Bahru for investment?
Sean Goh
Sean has a writing experience of 3 years and is currently with Stacked Homes focused on general property research, helping to pen articles focused on condos. In his free time, he enjoys photography and coffee tasting.Need help with a property decision?
Speak to our team →Read next from Property Investment Insights
Property Investment Insights Why Buyers in the Same Condo Ended Up With Very Different Results

Property Investment Insights What Happens When a “Well-Priced” Condo Hits the Resale Market
Property Investment Insights How a 1,715-Unit Mega Development Outperformed Its Freehold Neighbours
Property Investment Insights Why This Old 99-Year Leasehold Condo Outperformed Newer Projects in Bukit Timah
Latest Posts

Property Market Commentary Why Some Old HDB Flats Hold Value Longer Than Others
Overseas Property Investing What Under $200K Buys In Malaysia Today — From Freehold Apartments to Beachfront Suites

Singapore Property News When A “Common” Property Strategy Becomes A $180K Problem











9 Comments
YOLO! I dun think the buyers care about conserving their capital and not losing money when they buy leasehold with 50 years left.
Hahaha YOLO! I think it’s worth it genuine own stay buyers, but there’s not much of a case for it being a rental investment
Hey Sean, I am curious about the method you used to determine, that the return on the 44 year lease pre war flat is 63.5%.
If you had used the downpayment of 260K and put in a fixed deposit at 4% interest. After 44 years of compounded interest, it would have $1.4 million inside.
The net rental received after 44 years is $1.5 million. Considering you get to spend that rental money every month, and the high probability the rental will increase due to inflation along the 44 years a person holds it, the returns are much higher. Based on this line of thinking the returns are 600%
Hello! Thank you for the interesting summary. Would it be possible for you to send me the link for the sources or the name of the website? That way I can look into it in more detail. Many thanks in advance.
With kind regards
Hi Stacked. Would one be able to purchase one of these privatised SIT units if you already own HDB? I’m assuming it is no longer considered Govt housing so shouldn’t be an issue owning both?