Freehold vs Leasehold: 3 Tests To Determine Which Is Better (Part 2)
March 20, 2020

Let’s try something different for Part 2 of our Freehold vs Leasehold debate.
I’ll start by asking you directly – Freehold vs Leasehold: Which do you think makes more money?
Of course I could be wrong, but I’d wager that most people would pick freehold in a heartbeat.
In Part 1 of our Freehold vs Leasehold debate, it was more of a surface look – giving you more background information on the differences between freehold and leasehold in Singapore.
Well, all that information only tells half a story, so the best way of concluding this debate once and for all is to look into the numbers.
In order to cover all bases, I’ve come up with a few different tests to see which would trump over the other.
- Average Price Appreciation Test
- New Sale Appreciation Test
- Direct Comparison Test
Let’s start with the appreciation statistics of both.
Freehold vs Leasehold Average Price Appreciation
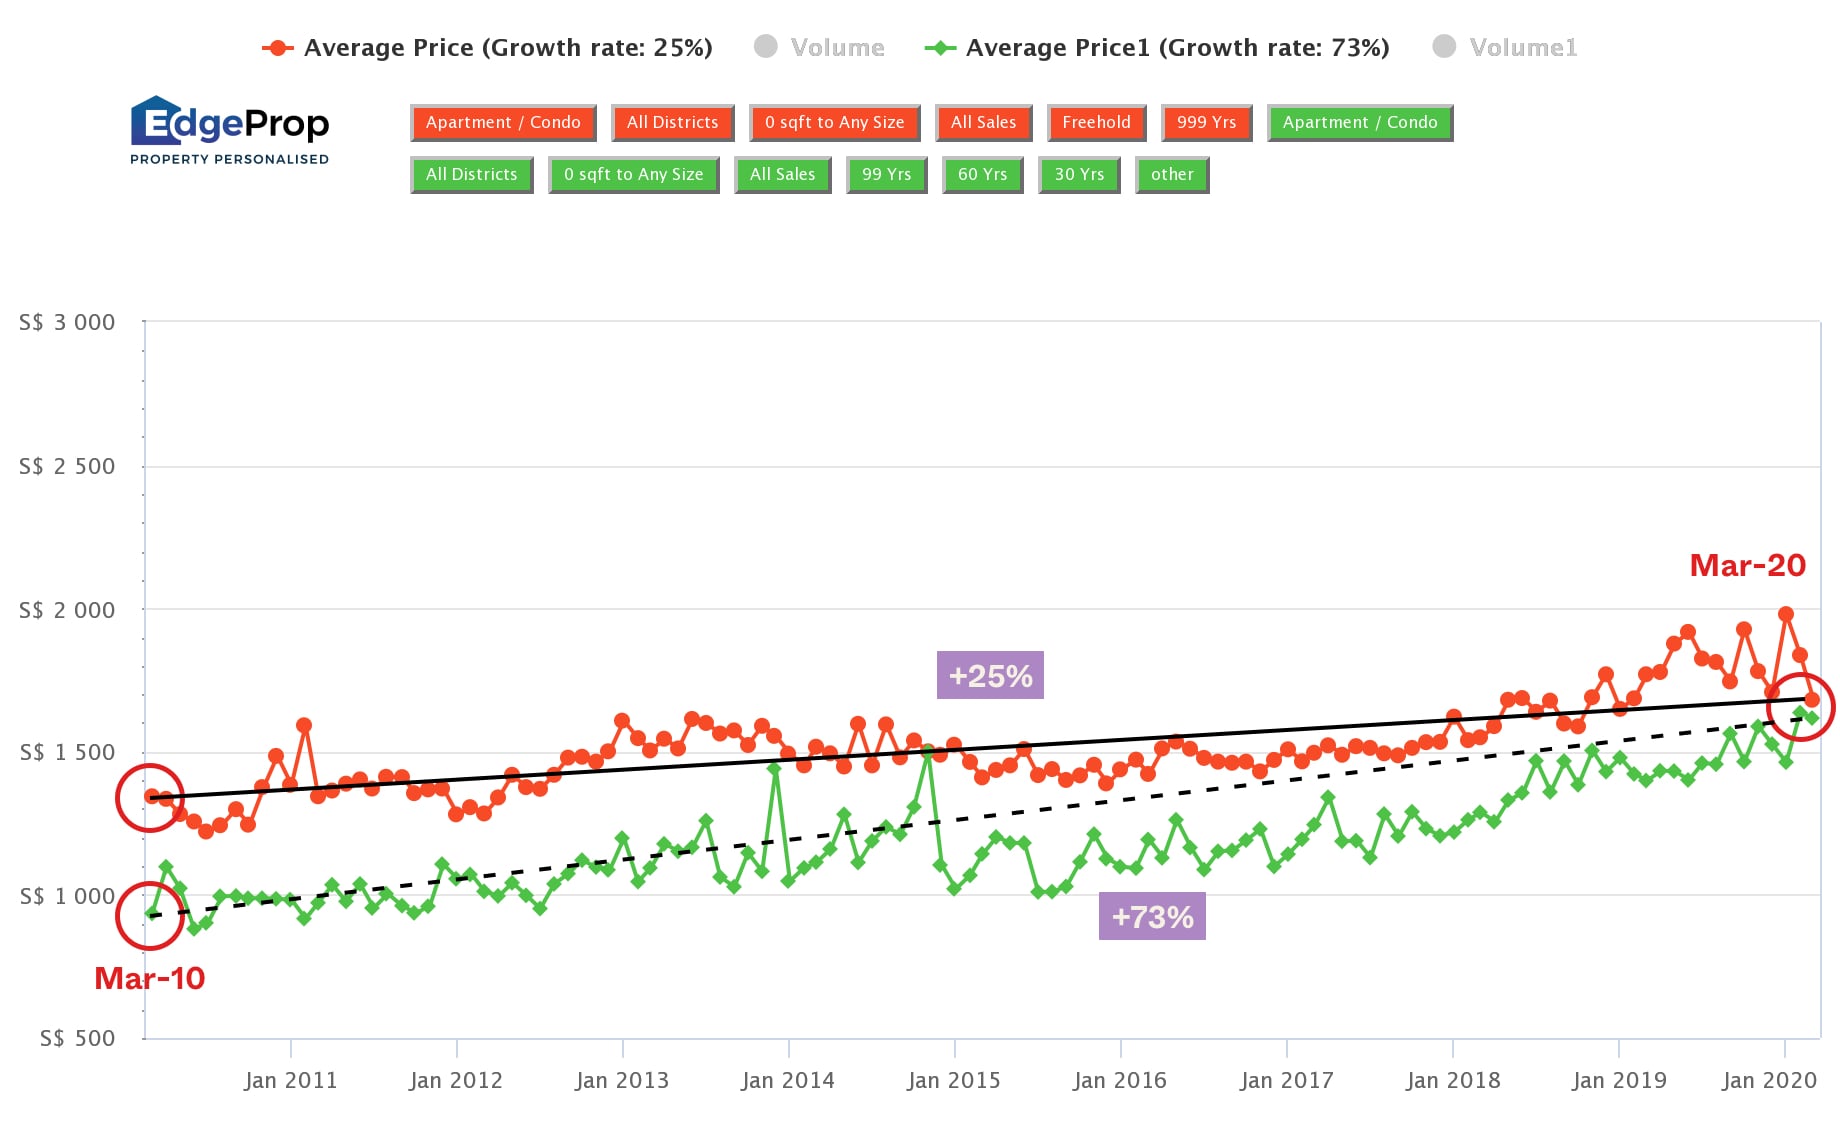
This is a graph showing the appreciation in terms of $PSF from the past 10 years (March 2010 to March 2020).
The green line represents leasehold and the red line represents freehold.
Based on the average prices, freehold condos have only increased 25% in the past 10 years.
On the other hand, leasehold condos have gone up a stunning 73% in the same time frame – that’s a near 3x increase.
Looks like we can close shop and call it a day – I mean, it’s quite clear who the winner is here, right?
Well, not entirely.
Let me show you what I mean.
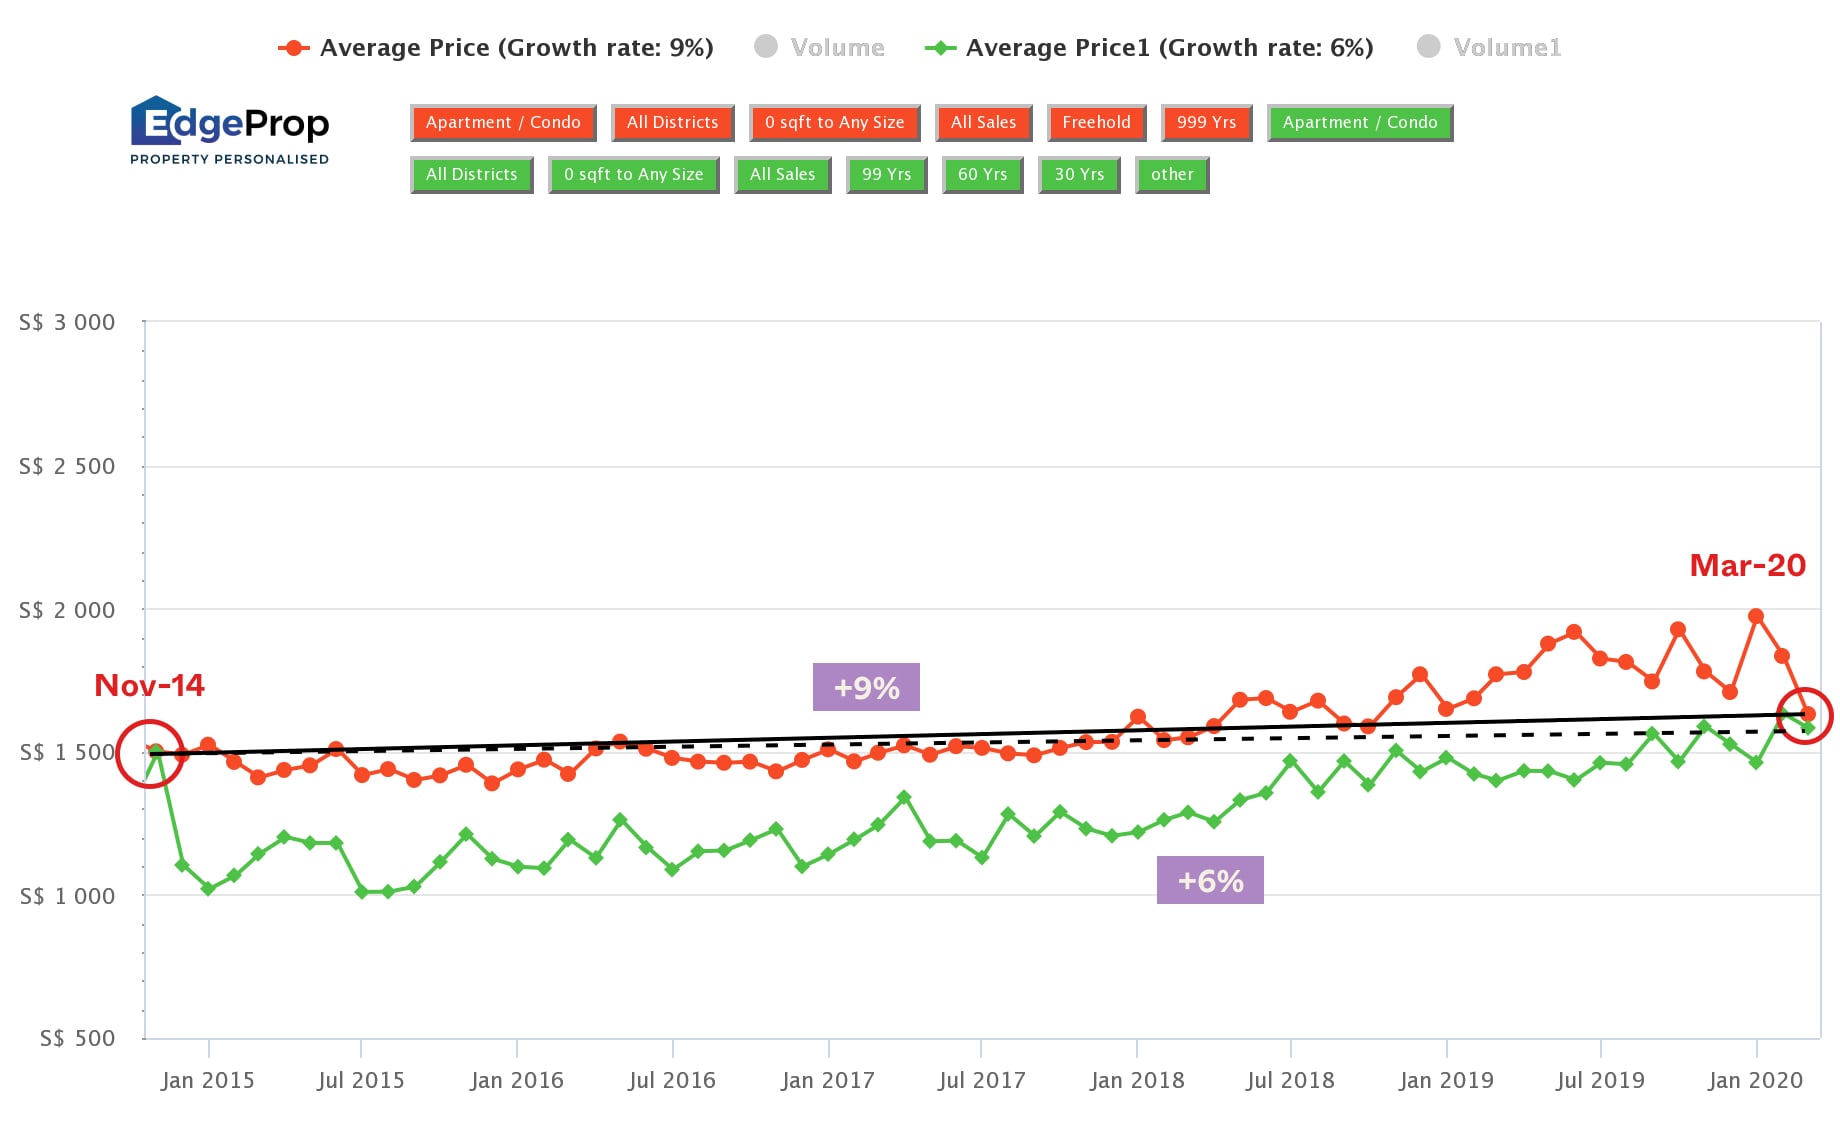
Here’s what happens when I move the dates to begin from November 2014 instead.
Just look at how the tables have turned!
You are now looking at a growth rate of 9% for freehold and 6% for leasehold instead.
So what can we conclude from this?
And what does this mean for our freehold vs leasehold debate?
For one, I reckon this is way too premature to be able to conclude anything – so let’s try a few more to see what happens.
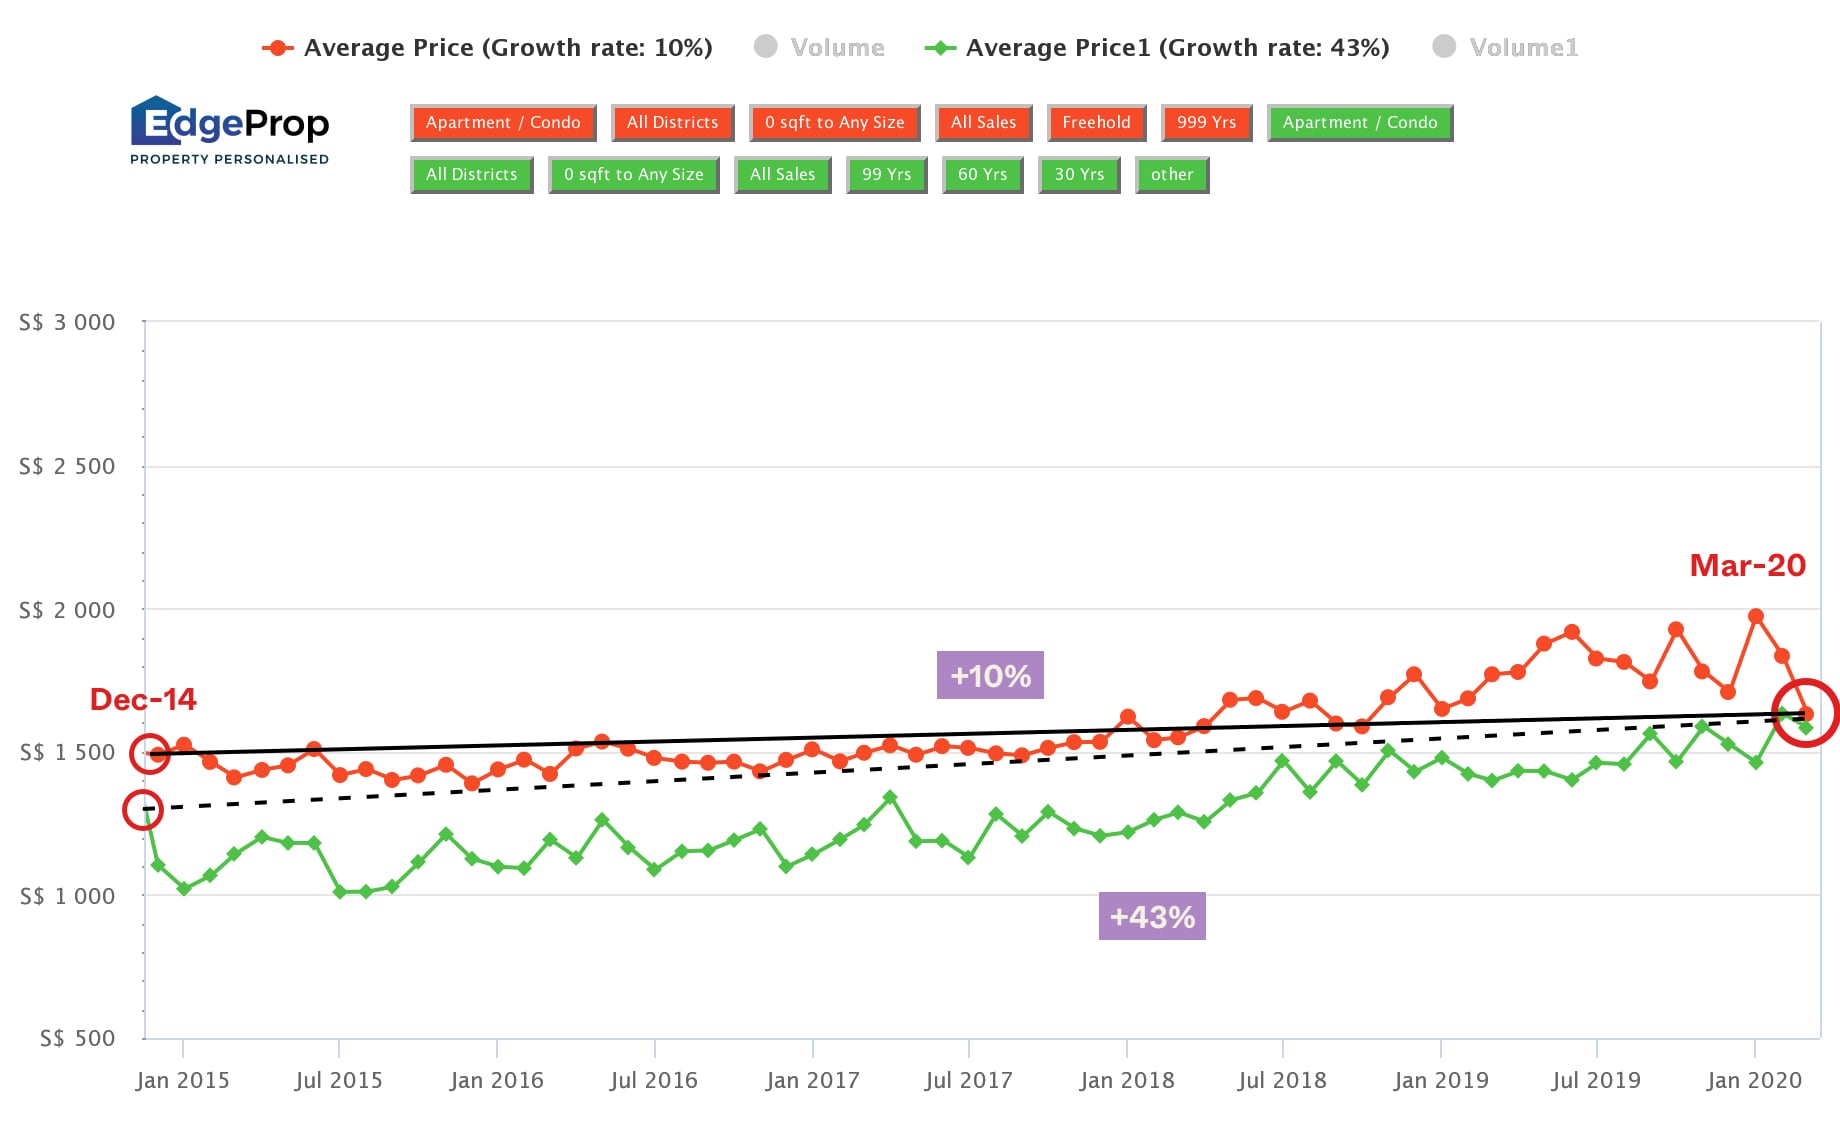
Now just take a look and see how much the results change after I shifted the beginning dates.
Mind you, this was an ever so slight change – just a month forward to December 2014.
It has now tilted massively in favour towards leasehold properties again.
This time at a crazy growth rate of 4x (Freehold – 10% and leasehold – 43%).
Are you beginning to see a trend here?
It just goes to show how important the starting time is to the growth rates.
Now let’s try and see what transpires if I shift the end dates instead.
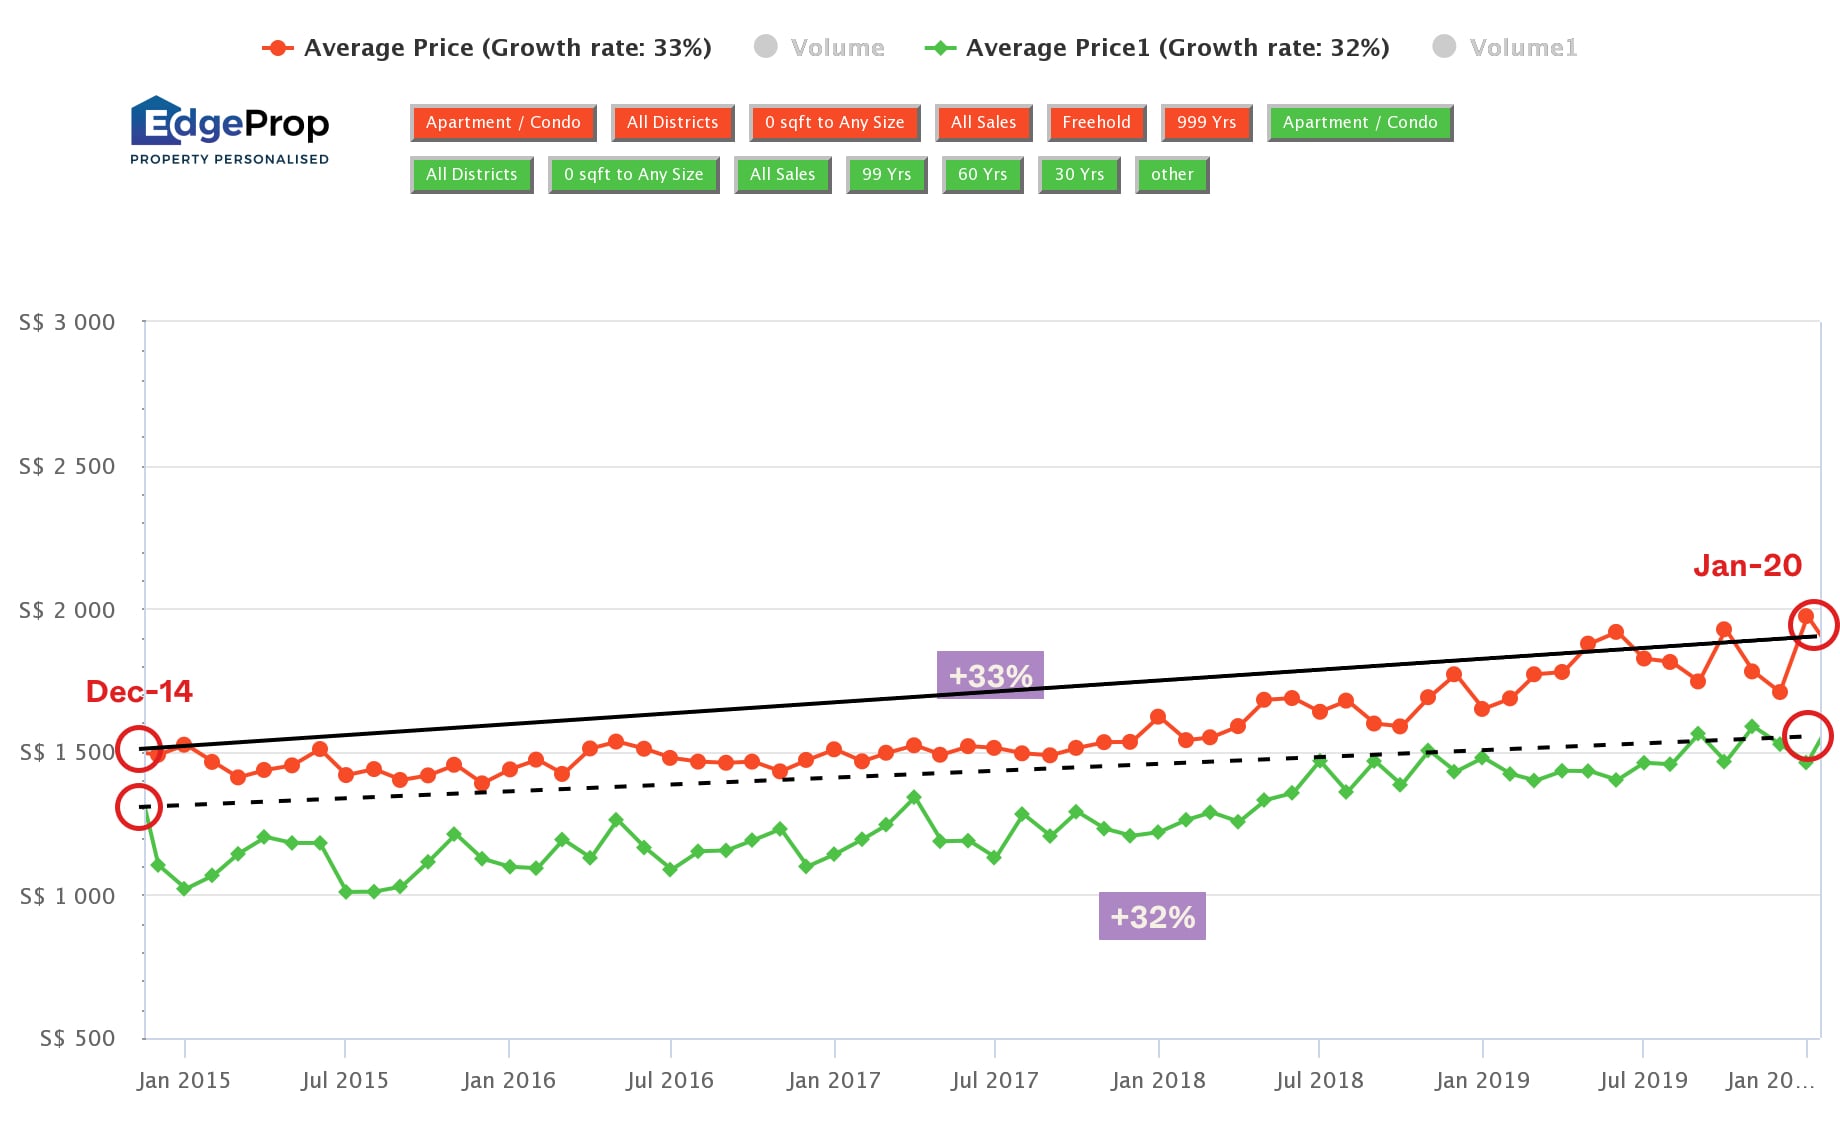
In this scenario, I’ve kept the same beginning dates as the previous case (December 2014) and moved the end dates to January 2020 instead.
The result?
It’s now moved back to an almost even game – with freehold growth at 33% and leasehold growth at 32%.
By now I’m sure you are wondering why the results can vary this much – so let me explain.
The growth rate is calculated by the average prices at the selected beginning and end points.
So for example, let’s imagine this scenario.
- The beginning month had freehold properties that were transacting for high prices, and leasehold transacting at lower than average prices.
- While the ending month had freehold properties that had transacted at low prices, and leasehold transacting at high prices.
The end result is data that is super skewed towards leasehold properties being much higher growth than freehold properties.
As you can tell by now, it is almost impossible to jump to any conclusion from this alone.
So let’s move on to the next test.
Freehold vs Leasehold New Sale Appreciation
Since I couldn’t gather anything conclusive from the first test, it was time to go more in-depth.
If you’ve been looking out for a property in the past year or so, you definitely would have considered a new launch condo.
Or at the very least have walked into a new launch showflat.
Which is why I’m sure at some point most people looking at new launches would have faced the same dilemma as always:
“Freehold vs leasehold, which is going to make me more money?”
So with that thought in mind, I decided to look at data from new sales and compare the appreciation numbers for freehold vs leasehold.
I chose 2010 as the starting point to give a reasonable basis to the comparison as there were quite a number of new sale condos then – mainly because it was not long after the last en bloc wave in 2007.
More from Stacked
Can Leasehold Condos Deliver Better Returns Than Freehold? A 10-Year Data Study Says Yes
In this Stacked Pro breakdown:
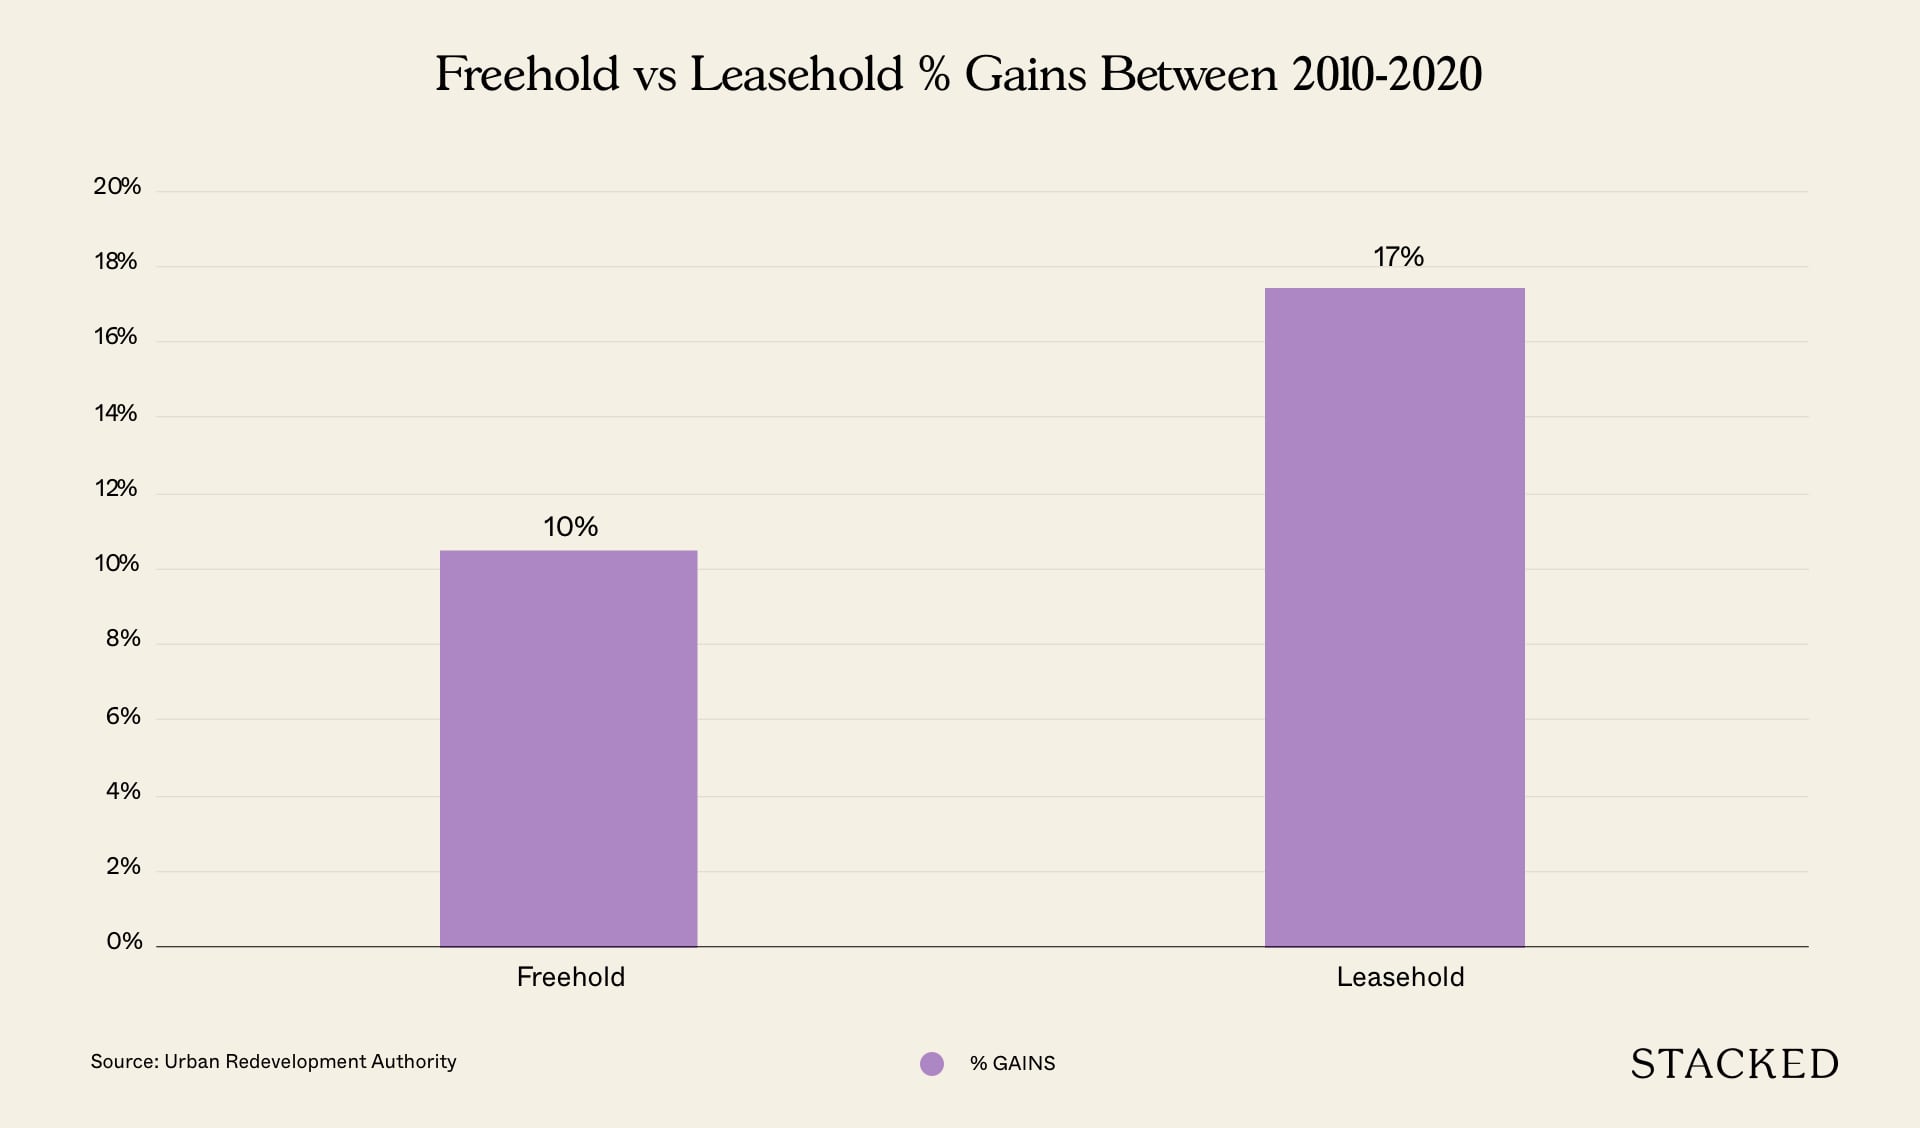
You can see from the graph that it’s a pretty straightforward case, leasehold condos are a clear winner with a 17% average appreciation as compared to 10% for freehold condos.
But is this really the concluding end all to the freehold vs leasehold debate?
No.
But you can say that this is a reasonable conjuncture to make if you are trying to find out between the periods of 2010 to 2020 which new launch tenure appreciates better.
Catch my drift?
If not, let me show you what I mean.
| 2010 Freehold Avg PSF | $1,547 |
| 2010 Leasehold Avg PSF | $1,235 |
| Difference | $312 |
| 2019 Freehold Avg PSF | $2,456 |
| 2019 Leasehold Avg PSF | $1,797 |
| Difference | $659 |
In 2010, the difference between freehold and leasehold was $312 PSF.

Property Market CommentaryHere’s What Property Prices In 2010 Can Teach You In 2020
by Sean GohJust last year in 2019, it has now become an eye popping $659 PSF difference.
This would in turn have a correspondingly huge impact on the final appreciation prices 10 years from now.
So again, because the starting comparisons are so different at each point in time (economic conditions, cooling measures, surrounding prices) it is hard to really justify that freehold vs leasehold debate.
Now for the third and final test.
Freehold vs Leasehold Direct Comparison
As you can see from the two tests above, it is really almost impossible to conclude a winner to the freehold vs leasehold debate because of the sheer amount of external factors involved.
BUT what we can still do is a direct comparison between two developments with similar characteristics.
Essentially this is done by cutting out as many variables as possible so that you can see how condos with different tenures perform over time.
As an example, let’s look at a commonly used reference – Southaven l and Southaven ll.
These 2 projects were built right next to each other, very close TOP dates (1997,1999), with Southaven l at a 99 year lease and Southaven ll at a 999 year lease (which in my books is as good as freehold).
| Southaven l | Southaven ll | |
| Starting PSF | $683 | $767 |
| Ending PSF | $914 | $1,180 |
| Appreciation | 25% | 35% |
From here you can see that Southaven ll has done better in terms of appreciation with a 35% increase since the beginning.
The freehold property is the winner here.
Here’s another comparison for you.
| Soleil @ Sinaran | Lincoln Suites | |
| Location | Sinaran Drive | Khian Guan Avenue |
| Tenure | 99 year | Freehold |
| No of units | 417 | 175 |
| Starting Price | $1,633 | $1,961 |
| Ending Price | $1,695 | $1,718 |
| Appreciation | 3.80% | -12.39% |
While it isn’t as close as the Southaven example, it’s certainly close enough.
In this case, you can see that the leasehold development outperforms the freehold in terms of appreciation.
So going by an appreciation perspective, it’s safe to say that the leasehold property is the winner here.
Final Words
You might feel like I’ve brought you on a wild goose chase on this one – only to conclude at the end that there is no clear winner for the debate.
As much as I’d like to finish with a sensationalist bang, the more important issue at hand is to show why you can never come to a common consensus on this debate.
Some people like to explain that leasehold performs better because those that buy freehold usually have the intention to live in it – they have better holding power so price appreciates slower.
Others say that freehold performs better in prime districts because the majority of properties are freehold – so the leasehold tends to perform poorly.
In reality, we are not really explaining which is the better tenure: we are just rationalising it.
You see, lease status is not the only determining factor – there are just too many other factors that have an influence at the end of the day.
What is important to take away is this:
Don’t let perceptions from the ground about freehold and leasehold cloud your decision making.
Buy a property that caters to your needs, whether it be for future capital appreciation, liveability, or rental income.
Because unless you have a decision to make with two properties that are side by side with different tenures – it is unlikely that you can ever come to a concrete decision just on the status of the lease.
At Stacked, we like to look beyond the headlines and surface-level numbers, and focus on how things play out in the real world.
If you’d like to discuss how this applies to your own circumstances, you can reach out for a one-to-one consultation here.
And if you simply have a question or want to share a thought, feel free to write to us at stories@stackedhomes.com — we read every message.
Frequently asked questions
Does freehold or leasehold property appreciate more over time?
Which type of property, freehold or leasehold, tends to generate more profit?
Is a direct comparison between similar freehold and leasehold developments useful?
Why is it difficult to determine whether freehold or leasehold is better for investment?
What should I consider when choosing between freehold and leasehold properties?
Sean Goh
Sean has a writing experience of 3 years and is currently with Stacked Homes focused on general property research, helping to pen articles focused on condos. In his free time, he enjoys photography and coffee tasting.Need help with a property decision?
Speak to our team →Read next from Property Investment Insights

Property Investment Insights We Compared Lease Decay Across HDB Towns — The Differences Are Significant

Property Investment Insights This Singapore Condo Skipped 1-Bedders And Focused On Space — Here’s What Happened 8 Years Later
Property Investment Insights Why Buyers in the Same Condo Ended Up With Very Different Results

Property Investment Insights What Happens When a “Well-Priced” Condo Hits the Resale Market
Latest Posts

Singapore Property News Nearly 1,000 New Homes Were Sold Last Month — What Does It Say About the 2026 New Launch Market?

Property Market Commentary How I’d Invest $12 Million On Property If I Won The 2026 Toto Hongbao Draw

Overseas Property Investing Savills Just Revealed Where China And Singapore Property Markets Are Headed In 2026


6 Comments
Leasehold would do well in the shortrun in terms of appreciation and rental, but long run (10 – 20 yrs) freehold wins.
Hi, any take on leasehold (balance about 75-79 years) landed terrace or semi-d houses as compare to freehold ones?
Perhaps it would be helpful in the first test to draw the best fit line for both types, then compare their respective slopes and growth rate, rather than simply comparing two months, since that wouldn’t account for seasonalities