“Freehold Condos Had More Losses Than Leasehold” 7 Surprising Lessons From Unprofitable Condos Transactions Since 2011
August 22, 2023

Stories about sky-high profits are common in the property market – but fewer people talk about losing transactions. The fact is, some people do lose money when selling their homes, or make so little that they’d have been better off tucking the money in their CPF accounts. This week, we reviewed losing transactions of those who bought and sold between 2011 to the present to see if there are any useful lessons to be gleaned:
Many readers write in because they're unsure what to do next, and don't know who to trust.
If this sounds familiar, we offer structured 1-to-1 consultations where we walk through your finances, goals, and market options objectively.
No obligation. Just clarity.
Learn more here.
1. Freehold projects saw more losers than leasehold
If there’s anything that Singaporeans love beyond their hawker food and queuing up for the latest fads, it’s freehold properties. Perhaps it is just the idea of owning their home “forever”, but the data from transactions show that the common belief that freehold properties are superior may be misguided.
If we look at tenure alone, freehold properties registered a bigger proportion of losing transactions as compared to leasehold properties:
| Tenure | Breakeven | Gain | Loss | Total | % Loss |
| Freehold* | 90 | 10,228 | 2,847 | 13,165 | 21.6% |
| Leasehold | 136 | 22,103 | 3,499 | 25,738 | 13.6% |
About one in five freehold units will see a loss, as opposed to one in seven for leasehold properties.
There are a number of reasons that could possibly explain this. The first is that buyers in Singapore may be overpaying for freehold properties. This could be true, especially for younger properties. After all, the real advantage that freehold properties have over leasehold ones is their ability to hold due to the infinite land value.
However, given that generally, many of the better-located condos are redeveloped before they get that old (be they leasehold or freehold), a freehold project may just end up being pricier with no real advantage.
That said, just going by lease alone is not fair. The data also reveals that a greater proportion of freehold properties have fewer units compared to leasehold ones – which brings us to our next point.
2. Freehold transactions tend to happen in smaller condos
When it comes to freehold and leasehold transactions, a greater proportion of freehold properties seem to fall under smaller developments. Here’s a chart that visually expresses what we mean:
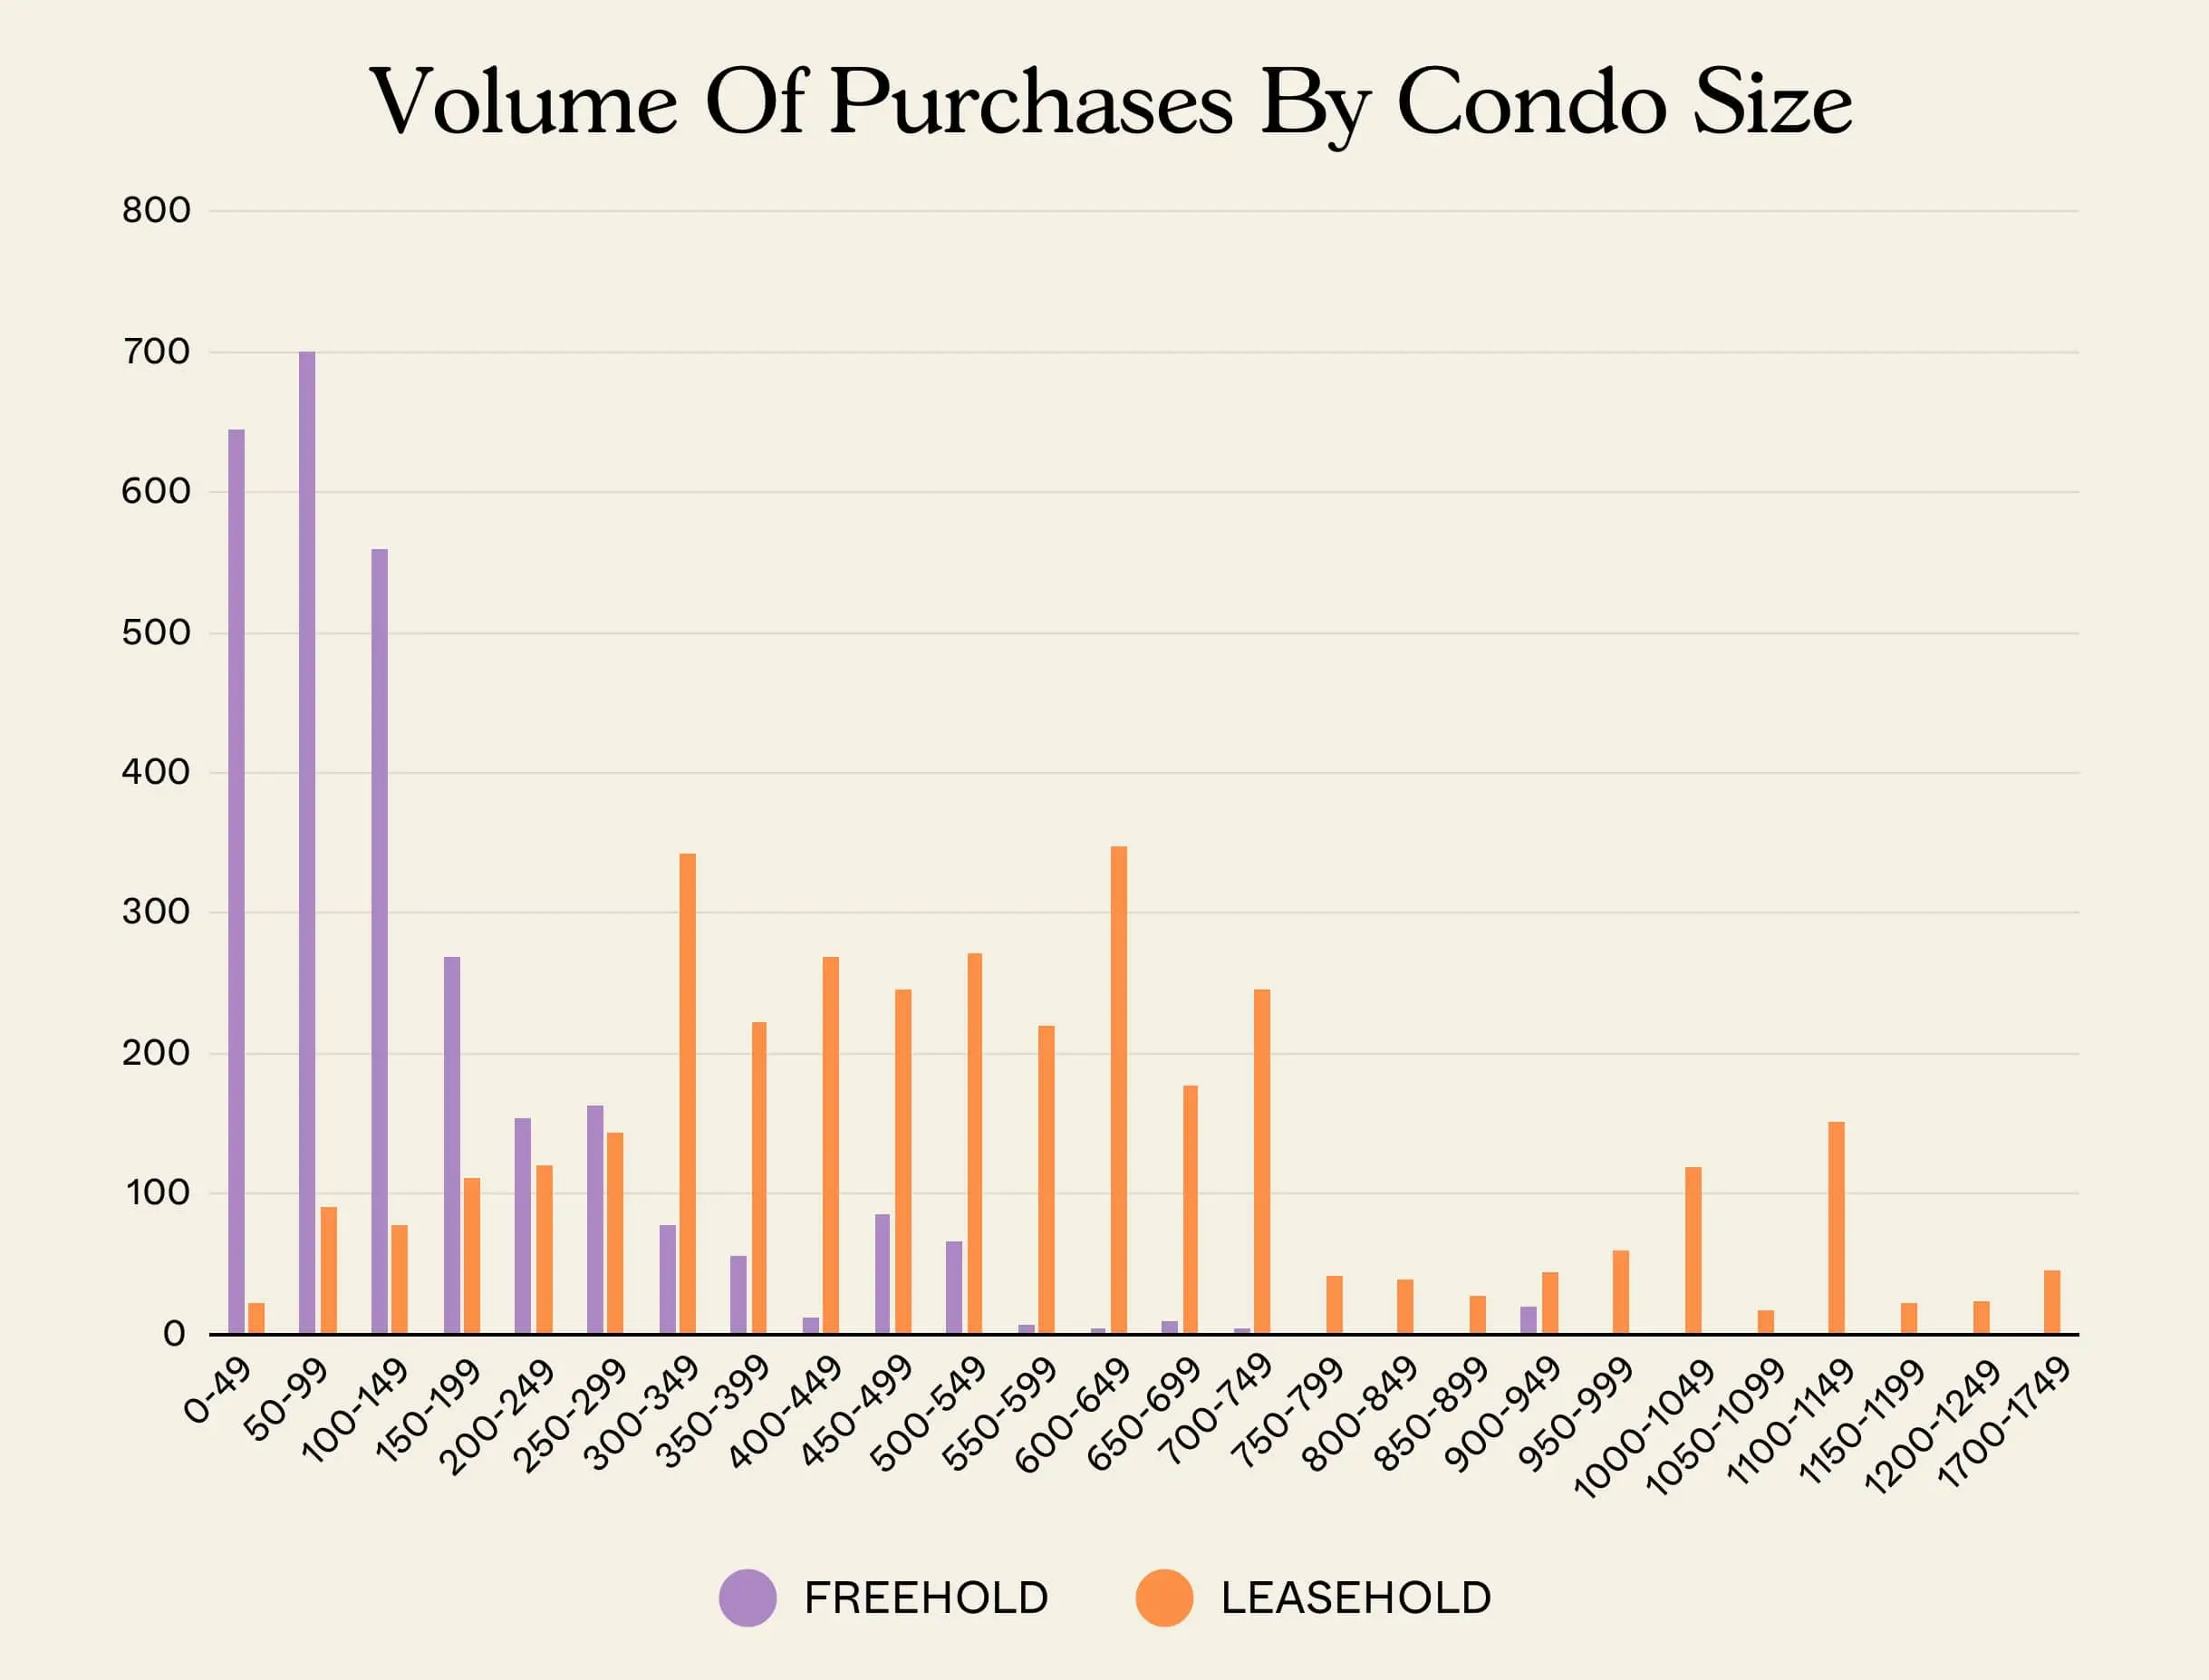
The horizontal axis represents the number of units in the condo, while the vertical axis represents the volume of transactions.
As you can see, most freehold transactions occur in condos with fewer than 100 units. By contrast, leasehold transactions are represented mostly in condos with between 300 to 750 units.
Therefore, the comparison between freehold and leasehold may actually have little to do with tenure on its own, but with the nature of the development that transacted.
This is unsurprising. We’ve highlighted before that boutique developments tend to underperform. There are two reasons why.
First, boutique developments are less known as fewer units transact there. As such, fewer buyers are even aware of its existence which makes it harder to market the property.
Secondly, determining the value of a unit in a boutique development is harder. The easiest way to value a home is to look at transactions within the development itself. Lower volumes means that the reference price would likely date back longer.
Given the property market is generally in an uptrend, that could mean a lower valuation. Even if more recent transactions in neighbouring properties are used to determine its value, the accuracy would be lower – thus it’s more likely that a discount is applied as a conservative measure which only works against the owner.
3. Losses tended to be higher for new sale to resale, for freehold units
| Type of purchase | Freehold | Leasehold |
| New Sale | -7.6% | -6.5% |
| Resale | -7.5% | -7.6% |
| Sub Sale | -7.7% | -7.1% |
What if we broke down the transactions by type of purchase?
For sub sale to resale, or resale to resale transactions, the degree of losses tends to be quite similar (0.1% and 0.6% difference).
The most substantial difference comes from new to resale transactions, involving freehold properties – a 1.1% difference.
This could be related to the premium placed on freehold properties, as it’s a huge marketing angle (especially if a project happens to be surrounded by leasehold counterparts). The higher initial cost also means worse potential losses, if a losing transaction occurs. This is also likely due to the holding period, as generally a shorter holding period for a more expensive freehold property would also incur a higher loss.
4. Leasehold projects can see worse losses than freehold, but it tends to happen with boutique projects
When it comes to boutique (50 or fewer units) projects, freehold losses starts to hold up better. In a losing transaction, we found that the freehold boutique units tend to lose less:
| Condo Type | Freehold | Leasehold |
| Large (500 or more) | -6.2% | -6.4% |
| Medium (150 – 499) | -7.0% | -7.6% |
| Small (50 – 149) | -8.2% | -9.6% |
| Very Small (<50) | -7.4% | -10.1% |
Note that all bigger projects – be they leasehold or freehold – tend to fare better in a losing transaction. This is because large projects, especially mega-projects, tend to be priced lower (due to economy of scale). Boutique projects are often pricier, and marketed on their privacy and exclusivity, and the higher price point means losses can also be higher.
Also, bigger developments have the advantage of more frequent transactions, which can help with price staging.
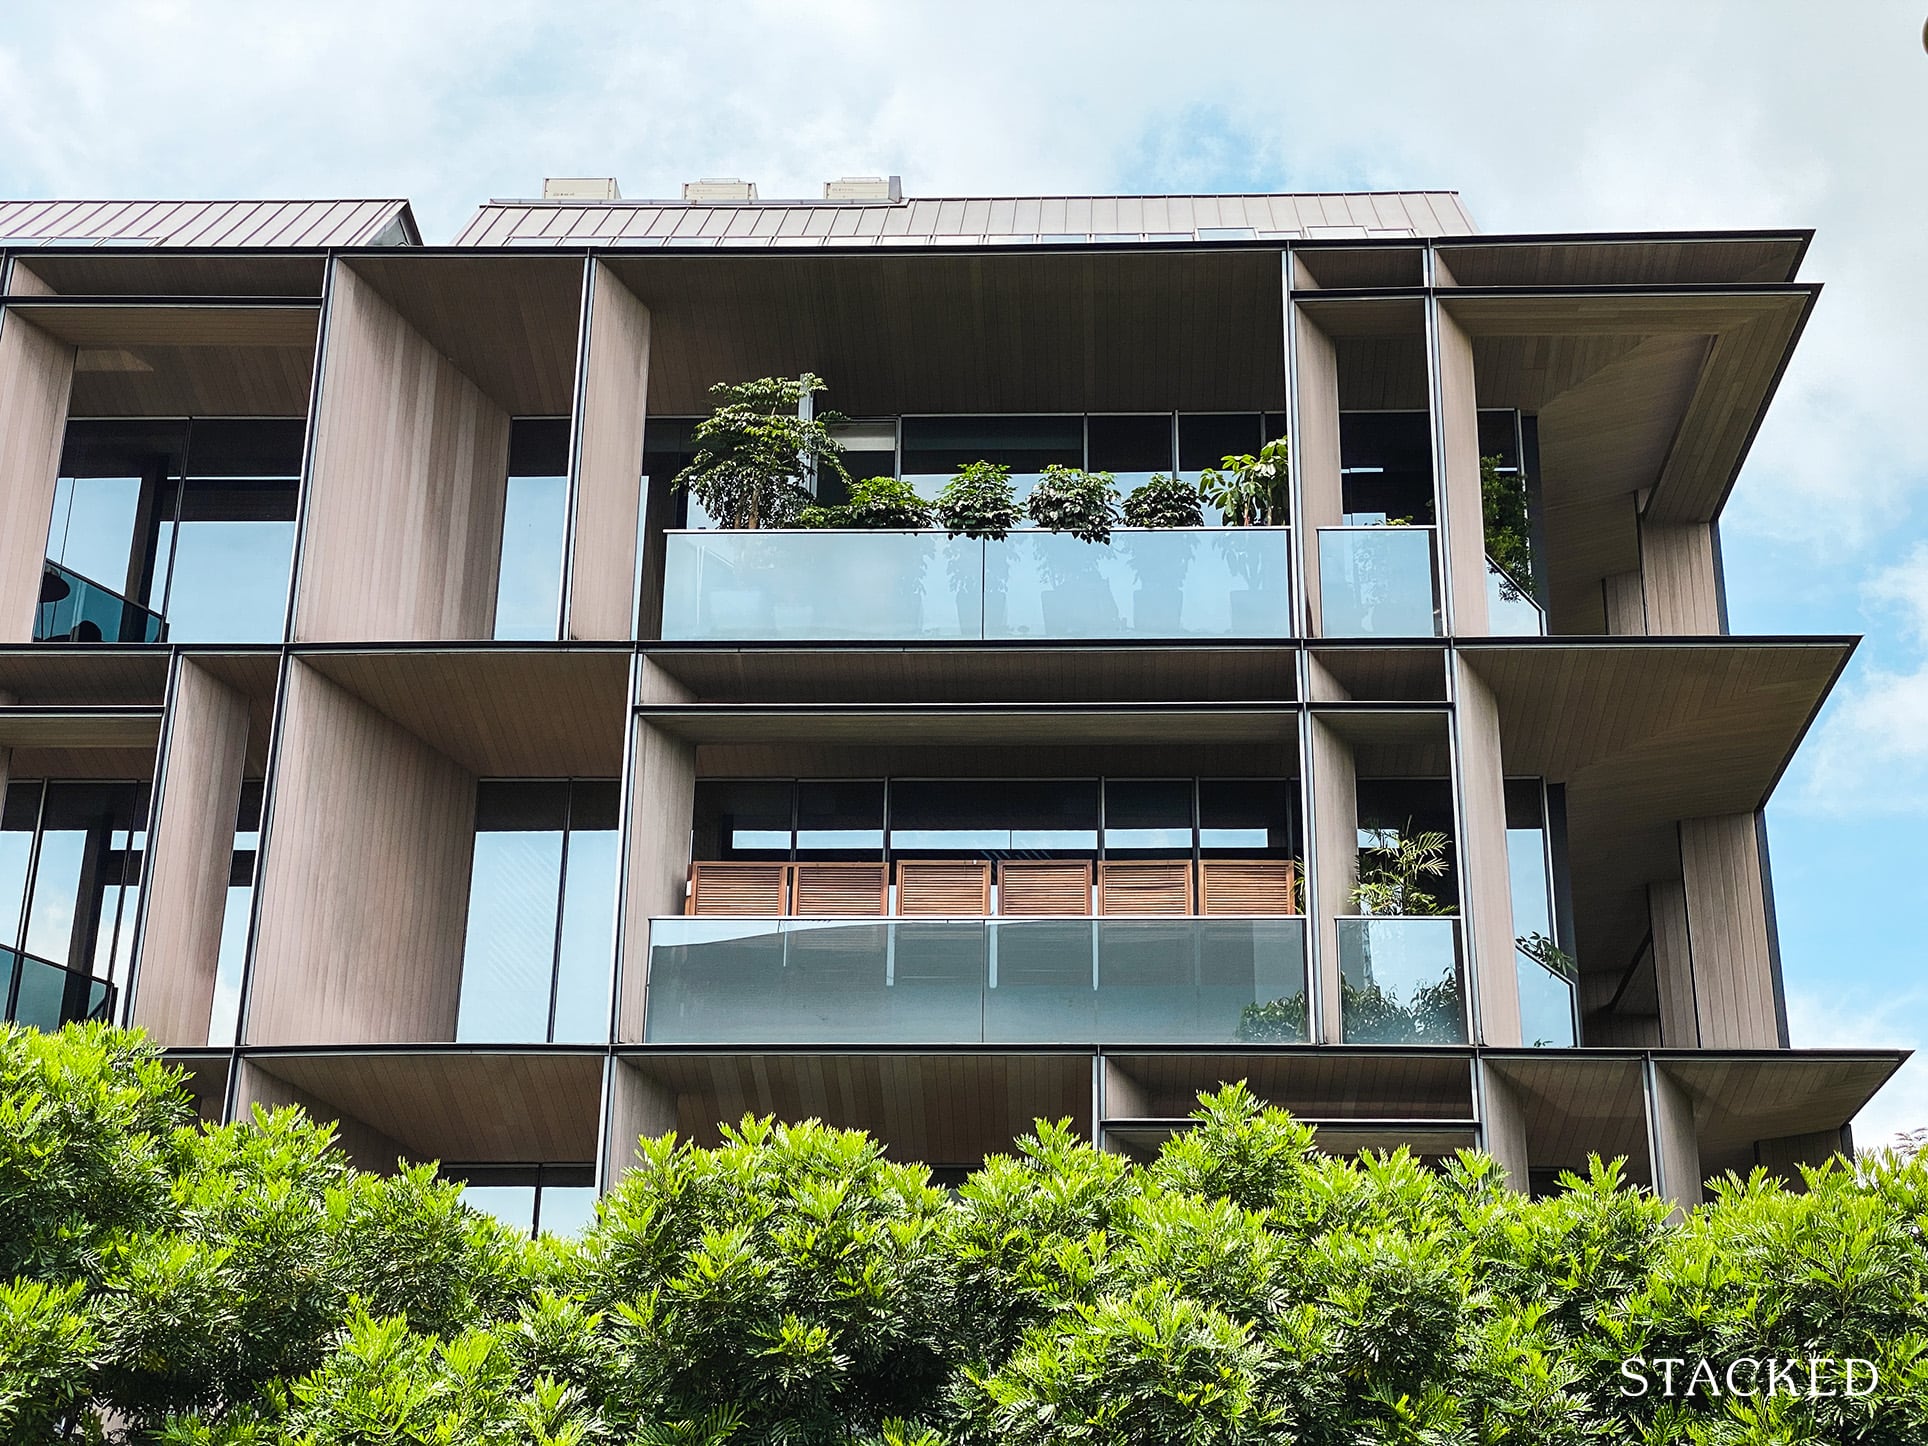
Interestingly, boutique leasehold projects tend to fare worse than their freehold counterparts. This makes sense as boutique developments have fewer offerings compared to larger condos with more facilities and economies of scale. Being leasehold also puts the condo at a disadvantage, so as time passes, we can reasonably expect these developments to lose out the most.
Property Investment InsightsFreehold VS Leasehold Landed Property: Exploring The Gap And How Prices Have Moved Over The Years
by Ryan J. OngIn any case, the message seems clear: if you’re going to buy a boutique project, the freehold option may be the safer bet.
5. 2012 seems to have been the worst year to buy, up to the present date
More from Stacked
Why We Bought A $1.9xm Unit At The Continuum: A Buyer’s Case Study With Stacked
Project Case Study: The Continuum
One big reason for loss-making transactions also is due to timing, when the property was bought or sold. Based on the same tables above, we looked at which years these various losing units were purchased:
| Year Bought | New Sale | Resale | Sub Sale | Grand Total |
| 2011 | 707 | 720 | 209 | 1,636 |
| 2012 | 1008 | 898 | 232 | 2,138 |
| 2013 | 714 | 540 | 165 | 1,419 |
| 2014 | 160 | 214 | 66 | 440 |
| 2015 | 89 | 105 | 37 | 231 |
| 2016 | 68 | 81 | 14 | 163 |
| 2017 | 52 | 91 | 7 | 150 |
| 2018 | 36 | 86 | 4 | 126 |
| 2019 | 9 | 20 | 29 | |
| 2020 | 2 | 5 | 7 | |
| 2021 | 7 | 7 |
Here’s when those who lost purchased visually:
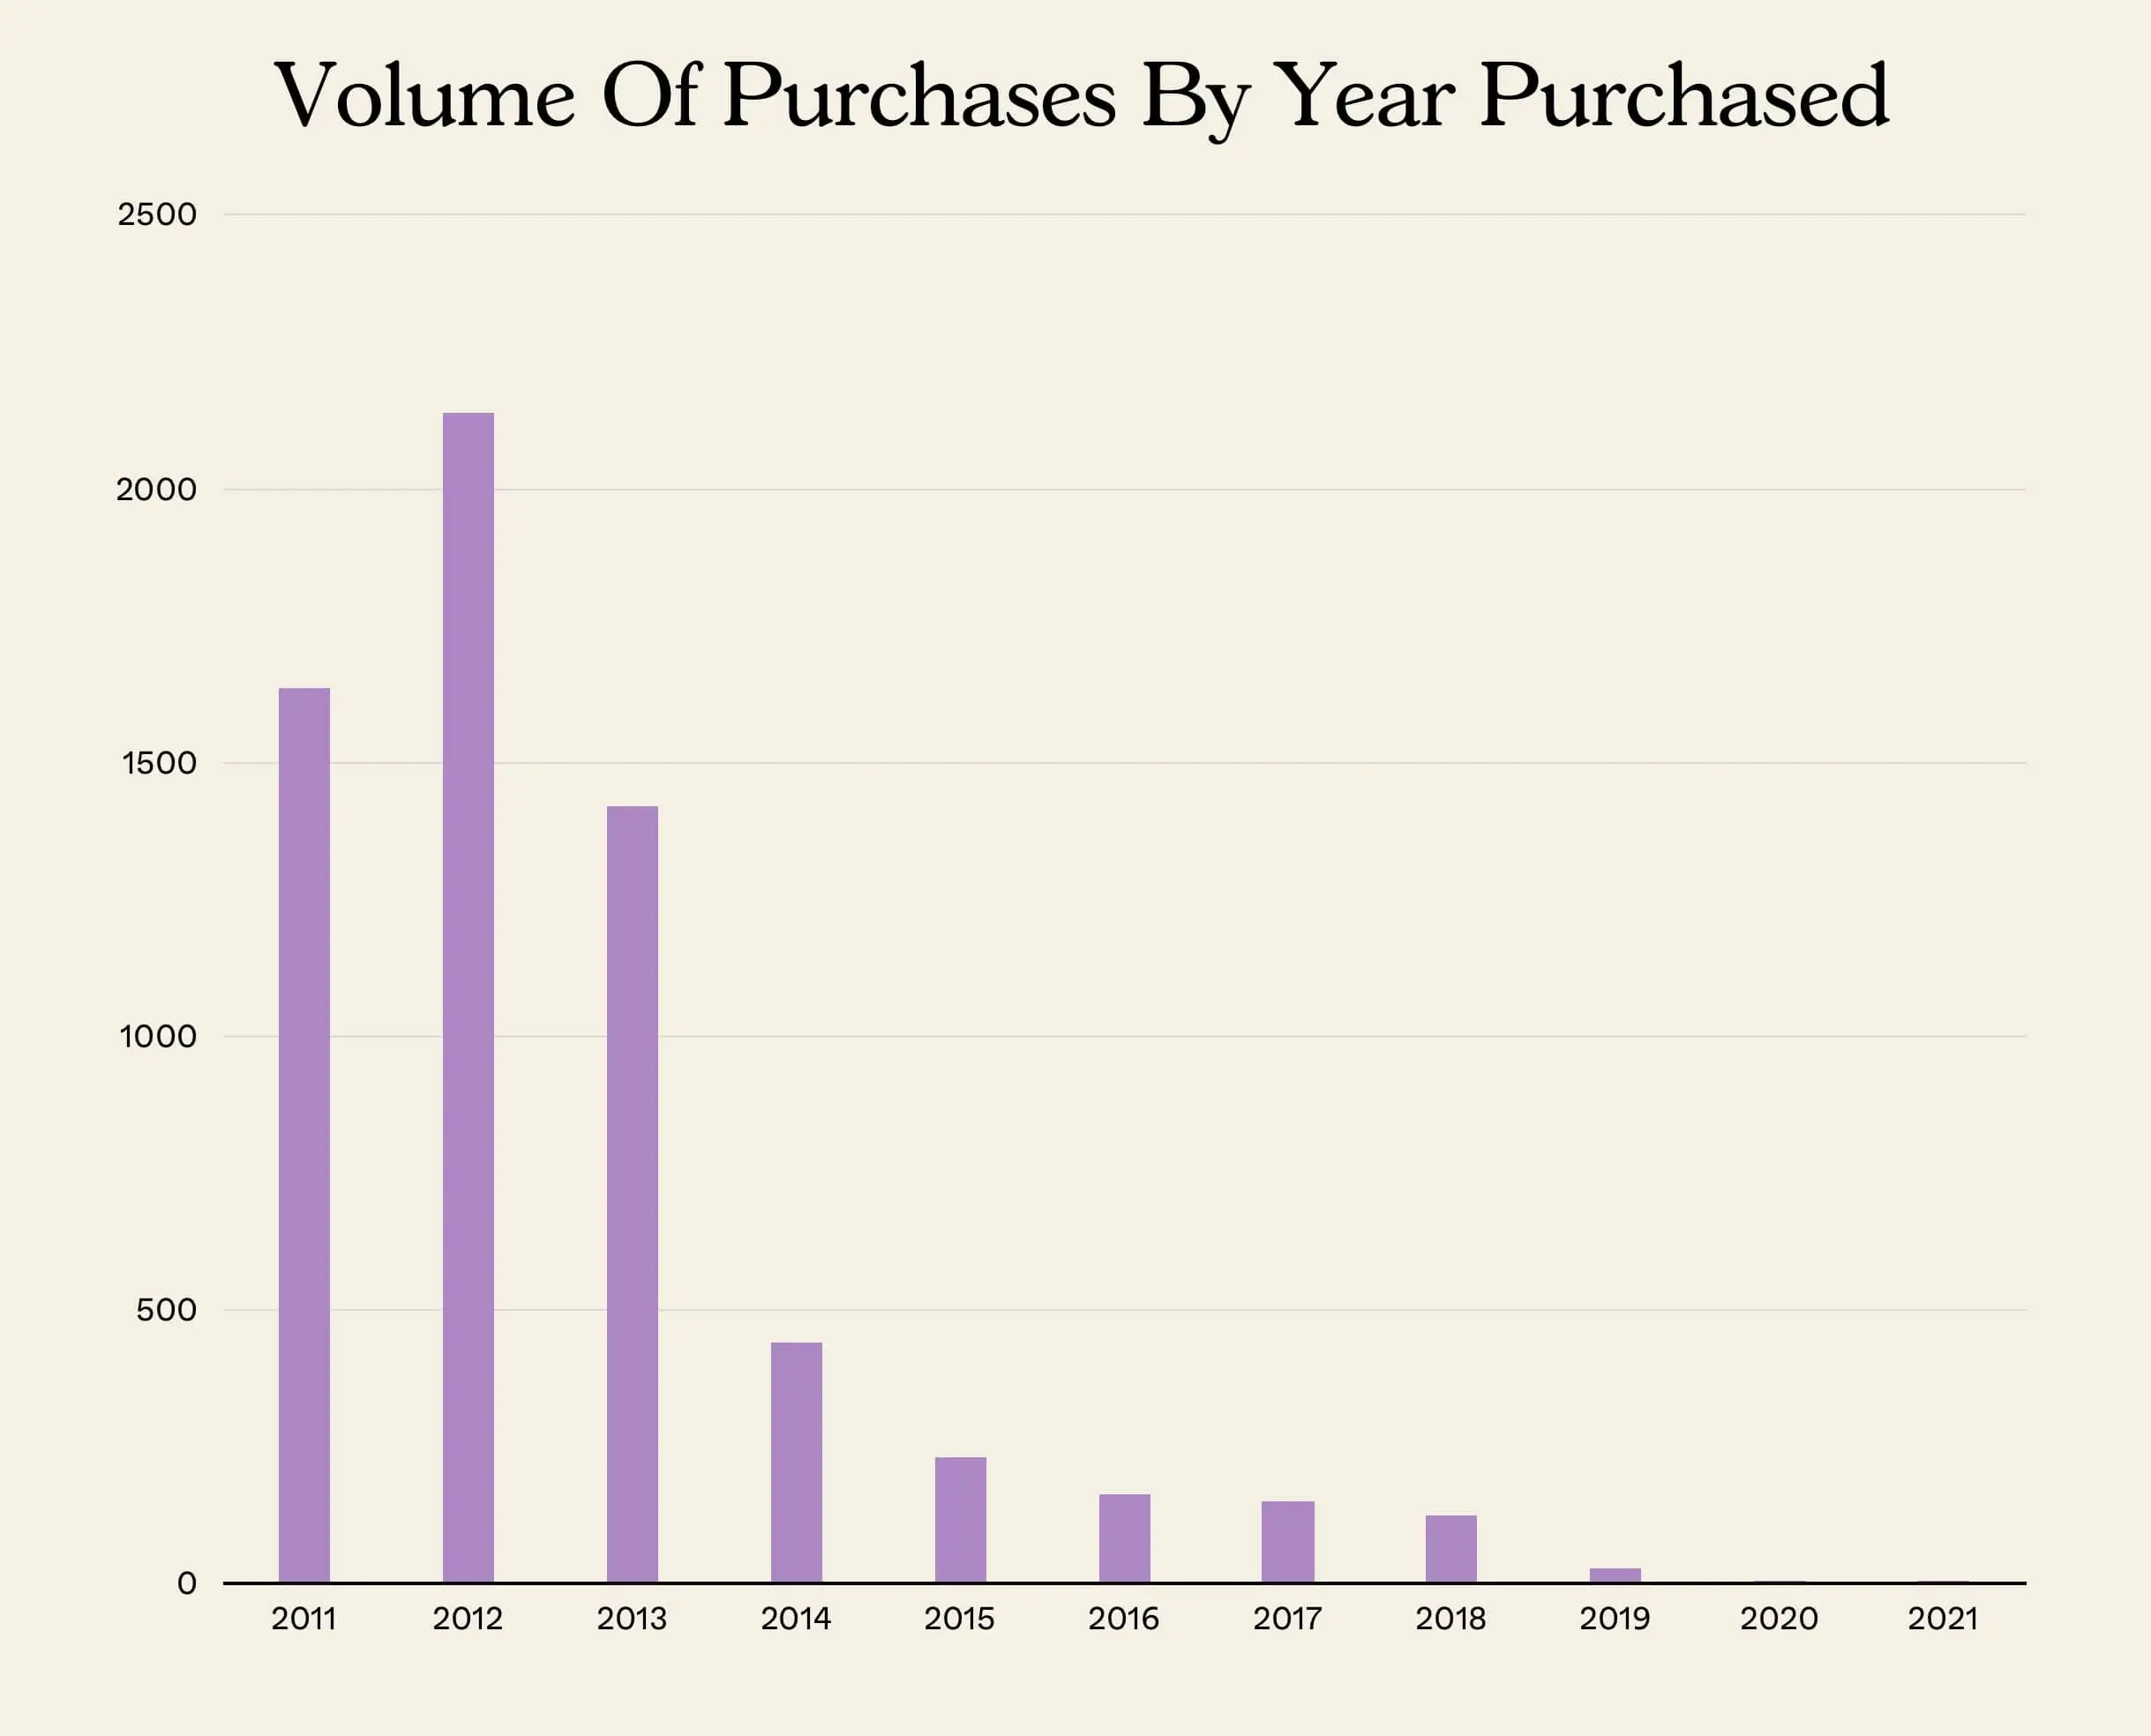
We initially believed that 2013 would fare the worst, as that was the last property peak. Surprisingly, buyers from 2012 seem to have gotten a less favourable deal. However, it’s crucial to consider that many 2013 buyers may have not yet put their properties on the market.
6. When it comes to losing transactions, CCR and RCR properties may fare worse
| District | Avg % Loss | Avg $ Loss | No. of Buy-Sell Tnx |
| 1 | -12.5% | -$311,571 | 196 |
| 9 | -11.5% | -$424,732 | 516 |
| 4 | -9.6% | -$347,452 | 255 |
| 11 | -8.7% | -$194,873 | 252 |
| 2 | -7.9% | -$128,204 | 142 |
| 21 | -7.6% | -$155,060 | 164 |
| 10 | -7.6% | -$267,094 | 383 |
| 5 | -7.4% | -$109,022 | 224 |
| 28 | -7.4% | -$71,207 | 78 |
| 13 | -7.3% | -$92,586 | 90 |
| 17 | -7.0% | -$76,263 | 205 |
| 26 | -7.0% | -$87,794 | 25 |
| 15 | -6.7% | -$110,394 | 524 |
| 8 | -6.6% | -$75,098 | 160 |
| 18 | -6.5% | -$69,989 | 354 |
| 7 | -6.4% | -$111,836 | 52 |
| 14 | -6.4% | -$53,791 | 368 |
| 27 | -6.3% | -$66,860 | 200 |
| 16 | -6.3% | -$76,653 | 393 |
| 12 | -6.1% | -$64,780 | 270 |
| 23 | -6.0% | -$64,781 | 460 |
| 3 | -5.8% | -$113,220 | 149 |
| 19 | -5.6% | -$63,682 | 573 |
| 22 | -5.6% | -$67,614 | 75 |
| 25 | -5.5% | -$48,388 | 123 |
| 20 | -5.4% | -$100,492 | 114 |
| 6 | -2.8% | -$300,000 | 1 |
Losses tended to be steeper in these districts:
1 – Boat Quay, Chinatown, Marina Bay (CCR)
2 – Shenton Way, Tanjong Pagar (CCR)
4 – Sentosa, Mt. Faber (RCR)
9 – Cairnhill, Orchard (CCR)
10 – Bukit Timah, Holland V, Tanglin (CCR)
11 – Newton, Dunearn (RCR)
Certain districts, such as Districts 9 and 10, are dominated by more freehold than leasehold properties. Bigger losses in these areas go hand-in-hand with our earlier observation (see above), that freehold units lose more on average.
CCR and RCR properties also tend to see a higher proportion of investors and foreigners. There are more buyers who could have paid the Additional Buyers Stamp Duty (ABSD), which amplified the scale of their loss in a losing transaction.
Also note that ABSD rates have only ever risen since 2011, and have been a continued disincentive against investment properties or foreign ownership. With ABSD rates now at 60% for foreigners, for example, we doubt if many are still interested in, say, an Orchard area property. As such, policy measures have shrunk the pool of prospective buyers for prime region properties.
Finally, there’s the simple fact that fringe region properties have lower prices to begin with; so even the losing transactions see smaller losses.
For those who don’t think in terms of district, it might be clearer if we did the breakdown by planning area instead:
| Planning Area | Average of % | Average of quantum | Count of project_name |
| Southern Islands | -20.2% | -$1,118,116 | 46 |
| Newton | -16.6% | -$743,135 | 176 |
| Orchard | -13.4% | -$678,700 | 15 |
| Outram | -11.5% | -$157,239 | 11 |
| Downtown Core | -11.0% | -$260,081 | 294 |
| River Valley | -10.0% | -$372,857 | 227 |
| Tanglin | -8.1% | -$264,715 | 220 |
| Marine Parade | -8.0% | -$193,350 | 169 |
| Clementi | -7.8% | -$105,571 | 128 |
| Novena | -7.5% | -$128,331 | 357 |
| Bukit Timah | -7.4% | -$166,521 | 326 |
| Rochor | -7.3% | -$112,476 | 102 |
| Museum | -6.9% | -$138,275 | 16 |
| Pasir Ris | -6.8% | -$74,725 | 370 |
| Queenstown | -6.8% | -$101,563 | 131 |
| Jurong East | -6.8% | -$71,788 | 17 |
| Bukit Merah | -6.7% | -$151,579 | 364 |
| Mandai | -6.5% | -$76,880 | 19 |
| Yishun | -6.5% | -$67,018 | 158 |
| Geylang | -6.5% | -$55,265 | 323 |
| Serangoon | -6.4% | -$74,638 | 193 |
| Tampines | -6.4% | -$67,183 | 201 |
| Kallang | -6.2% | -$74,058 | 311 |
| Choa Chu Kang | -6.2% | -$57,686 | 114 |
| Bedok | -6.2% | -$70,330 | 739 |
| Toa Payoh | -6.1% | -$94,415 | 103 |
| Singapore River | -6.1% | -$196,632 | 47 |
| Bukit Panjang | -6.0% | -$75,719 | 85 |
| Hougang | -6.0% | -$64,899 | 334 |
| Ang Mo Kio | -5.9% | -$81,531 | 64 |
| Bukit Batok | -5.8% | -$64,283 | 272 |
| Punggol | -5.8% | -$77,431 | 43 |
| Bishan | -5.6% | -$111,942 | 77 |
| Woodlands | -5.5% | -$48,388 | 123 |
| Jurong West | -5.2% | -$66,391 | 58 |
| Sembawang | -5.2% | -$57,532 | 28 |
| Sengkang | -4.6% | -$45,268 | 85 |
Notice that the top losses are concentrated in areas where landlords try to rent to affluent expatriates, or where foreigners like to buy luxury condos (Newton, Orchard, River Valley, Marine Parade, etc.)
Conversely, the lowest losses come from fringe heartland areas; places already known for affordable housing, and where you don’t see large expat enclaves (Jurong West, Sembawang, Sengkang, etc.). This makes sense when you think about where most of the population would look to upgrade to from HDB, rather than the central areas.
7. Bigger units tend to see bigger losses
| Size | Average of % | Average of quantum |
| <500 sq ft | -5.70% | -$42,862 |
| 500 – 999 sq ft | -7.00% | -$84,318 |
| 1,000 – 1,499 sq ft | -7.04% | -$118,264 |
| 1,500 sqft or more | -9.93% | -$436,320 |
| Grand Total | -7.30% | -$142,953 |
This is probably the most obvious conclusion, given that bigger units are also more expensive.
Bigger units do draw more prospective buyers than smaller ones, according to almost every realtor we’ve spoken to. However, that attractiveness doesn’t always translate to sales, due to the overall quantum.
Cooling measures haven’t just imposed ABSD rates – they’ve also imposed loan curbs, such as restrictions on the Loan To Value (LTV) ratio, and the Total Debt Servicing Ratio (TDSR). As with stamp duty rates, these have only intensified since 2011.
As such, large units may have drifted beyond the purchasing power of HDB upgraders, who would struggle to find financing; and that assumes they would want to take on such a large mortgage, even if they could.
Back in 2011, home loan rates below two per cent were possible. Today, mortgage brokers have told us rates reaching five per cent are plausible by the end of 2023, or early next year. Coupled with loan curbs, this makes large, high-quantum units even less affordable than before.
It’s time to question certain assumptions about the market
The Singaporean love of freehold properties is one of these. Besides what you see in this article, we’ve seen numbers and incidents that, over time, have prompted us to question the value of a freehold property.
Just to be clear, we have nothing against freehold properties. Their value can truly be seen over time compared to leasehold properties. Our main point is that buyers should not base their decision heavily on a property’s tenure only. It’s important to consider its premium, condo offerings, resale competitors, unit layout, past performance, potential growth in the area and so on.
The other consideration is the oft-used sales pitch that CCR properties are “resilient,” or “proven” assets. We distinctly recall that, back during the shoebox craze of the 2010s, there were agents asserting that only shoebox units in the CCR are “true” moneymakers. But Singapore’s ongoing decentralisation calls all this into question; and we may need to take a deeper look at what exactly “central location” means.
Paya Lebar, Tampines, and Jurong East, for instance, increasingly have the accessibility and amenities to challenge areas like Novena/Newton. And we increasingly hear buyers assert that the Bugis/Rochor midtown area can give Orchard a run for its money, when it comes to convenience.
The 2020s have been a decade of substantial change and there’s more to come; so it’s important that we start thinking outside of the old cliches and stereotypes. For more updates on the situation going forward, follow us on Stacked. We’ll also provide you with reviews of new and resale properties alike.
At Stacked, we like to look beyond the headlines and surface-level numbers, and focus on how things play out in the real world.
If you’d like to discuss how this applies to your own circumstances, you can reach out for a one-to-one consultation here.
And if you simply have a question or want to share a thought, feel free to write to us at stories@stackedhomes.com — we read every message.
Ryan J. Ong
A seasoned content strategist with over 17 years in the real estate and financial journalism sectors, Ryan has built a reputation for transforming complex industry jargon into accessible knowledge. With a track record of writing and editing for leading financial platforms and publications, Ryan's expertise has been recognised across various media outlets. His role as a former content editor for 99.co and a co-host for CNA 938's Open House programme underscores his commitment to providing valuable insights into the property market.Need help with a property decision?
Speak to our team →Read next from Editor's Pick
Property Investment Insights River Modern Starts From $1.548M For A Two-Bedder — How Its Pricing Compares In River Valley

Property Investment Insights This Singapore Condo Has Bigger Units Near The MRT — But Timing Decided Who Made Money

Editor's Pick Happy Chinese New Year from Stacked

Property Market Commentary How I’d Invest $12 Million On Property If I Won The 2026 Toto Hongbao Draw
Latest Posts

Singapore Property News Why Some Singaporean Parents Are Considering Selling Their Flats — For Their Children’s Sake
New Launch Condo Reviews River Modern Condo Review: A River-facing New Launch with Direct Access to Great World MRT Station
On The Market Here Are The Cheapest 5-Room HDB Flats Near An MRT You Can Still Buy From $550K




0 Comments