


In the Singapore property market, most people would gravitate towards a higher floor unit. This is even clearly reflected in developer pricing, where we expect that the higher floor units will come at a premium. But we’ve also discovered that some contrarian buyers prefer ground floor units – and besides benefits like a lower quantum, many have cited experiences where their ground floor units have performed better than the top floor neighbours. While this may be true for certain developments (there are projects where the ground floor units have special features like high ceilings, etc), this may not be representative across the board. Let’s take a closer look to see what the numbers tell us:
So many readers write in because they're unsure what to do next, and don't know who to trust.
If this sounds familiar, we offer structured 1-to-1 consultations where we walk through your finances, goals, and market options objectively.
No obligation. Just clarity.
Learn more here.
First, let’s look at the number of ground-floor unit transactions
We started by picking out all the transactions for level 1 units, between 2014 to 2024. We should clarify there may be some inaccuracies in this approach, as level 1 is not always the ground floor for every condo; but it’s true enough for the vast majority.
We found that over the past 10 years, ground floor units make up a small number of transactions; just around five per cent of the total:
| Row Labels | Average of quantum | Average of % | Count of project_name |
| Not Ground | $280,620 | 24.49% | 27,806 |
| Ground | $282,745 | 24.72% | 1,477 |
| Average | $280,727 | 24.50% | 29,283 |
Although such a large general comparison doesn’t help much, do note that the average quantum of ground floor units is actually a little bit higher.
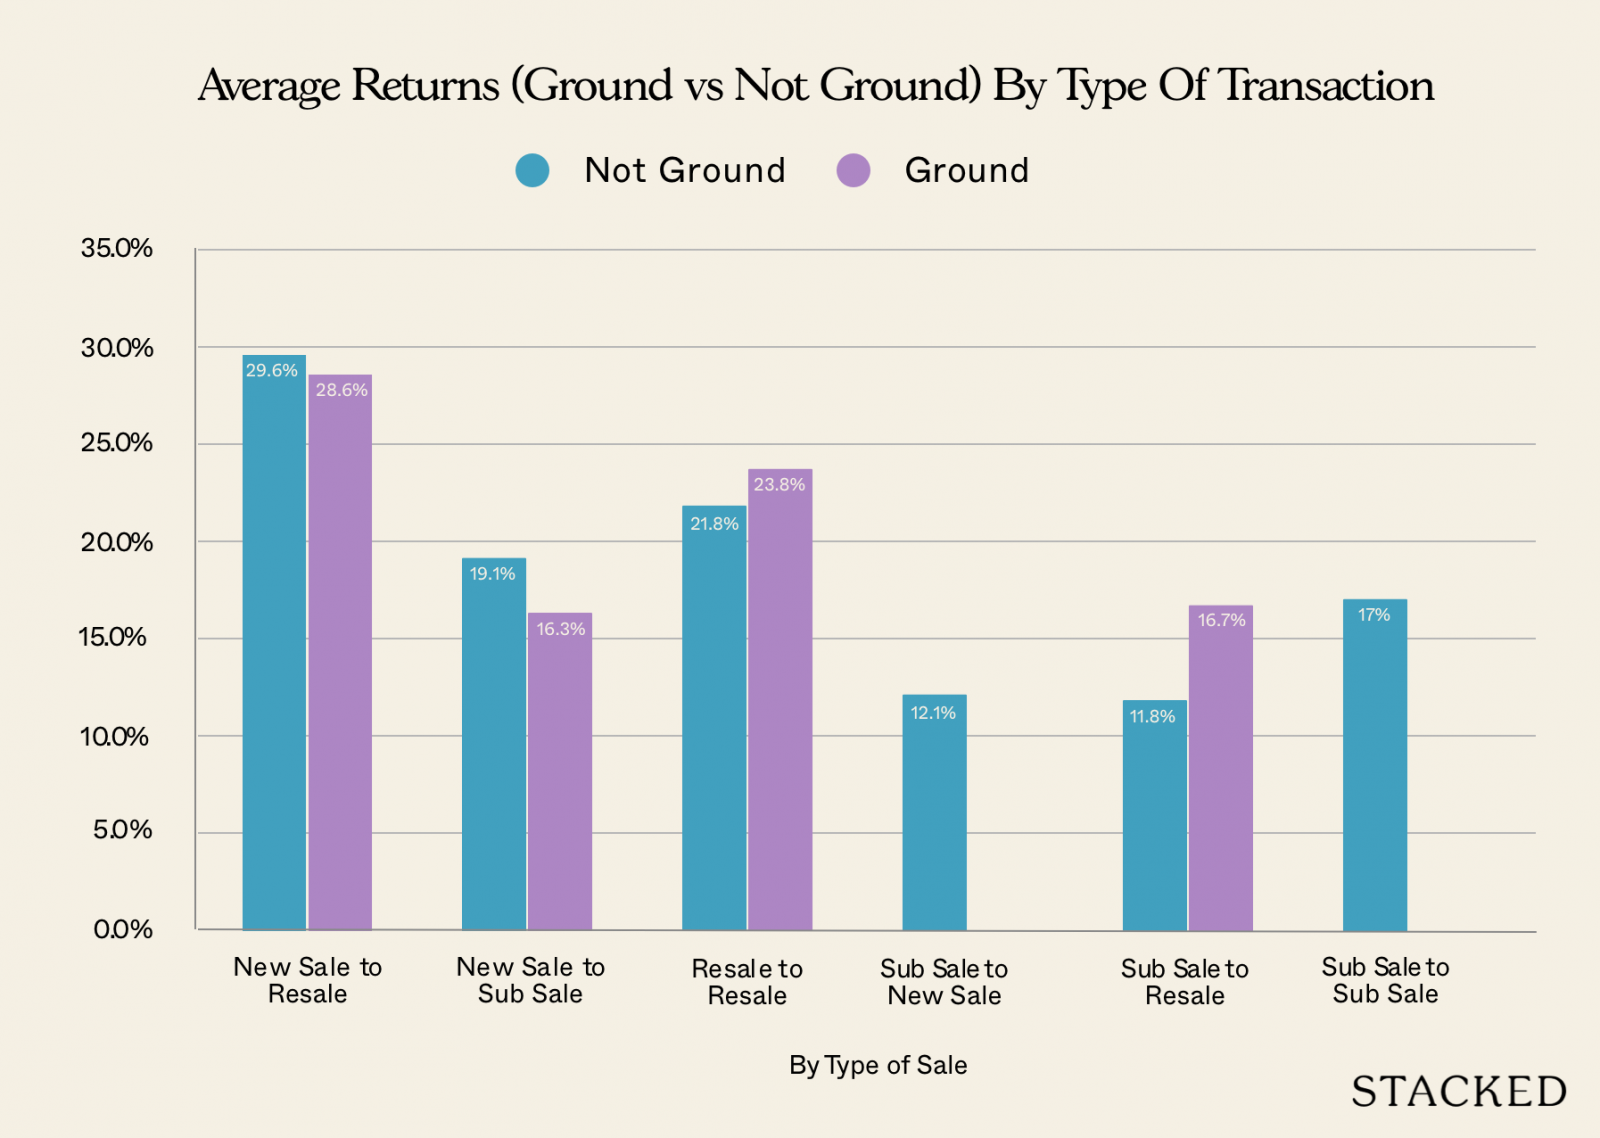
Next, we did a comparison between the types of sales.
There may, for instance, be a difference between ground floor units that are bought during developer sales and then resold (new-to-resale), versus those bought from other owners and sold again (resale-to-resale). One of the factors here is that, quite often, developers charge less for ground floor than higher floor units, which could lead to greater room for appreciation.
| Avg Gains ($) | Avg Gains (%) | Volume | ||||
| Type of Sale | NOT GROUND | GROUND | NOT GROUND | GROUND | NOT GROUND | GROUND |
| New Sale to Resale | $290,135 | $265,242 | 29.6% | 28.6% | 11,964 | 531 |
| New Sale to Sub Sale | $234,402 | $190,318 | 19.1% | 16.3% | 4,054 | 113 |
| Resale to Resale | $297,629 | $314,219 | 21.8% | 23.8% | 11,028 | 786 |
| Sub Sale to New Sale | $331,560 | 12.1% | 1 | |||
| Sub Sale to Resale | $129,841 | $176,355 | 11.8% | 16.7% | 749 | 47 |
| Sub Sale to Sub Sale | $164,931 | 17.0% | 10 | |||
| Average | $280,001 | $281,787 | 24.4% | 24.6% | 27,806 | 1,477 |
Indeed, there’s a slight improvement to gains for ground floor units, in new-to-resale (28.6 per cent), versus resale-to-resale (23.8 per cent).
What we didn’t expect, however, was for the difference to be so marginal. This suggests that, regardless of whether you buy new or resale, there’s very little difference in gains between the ground floor and higher units.
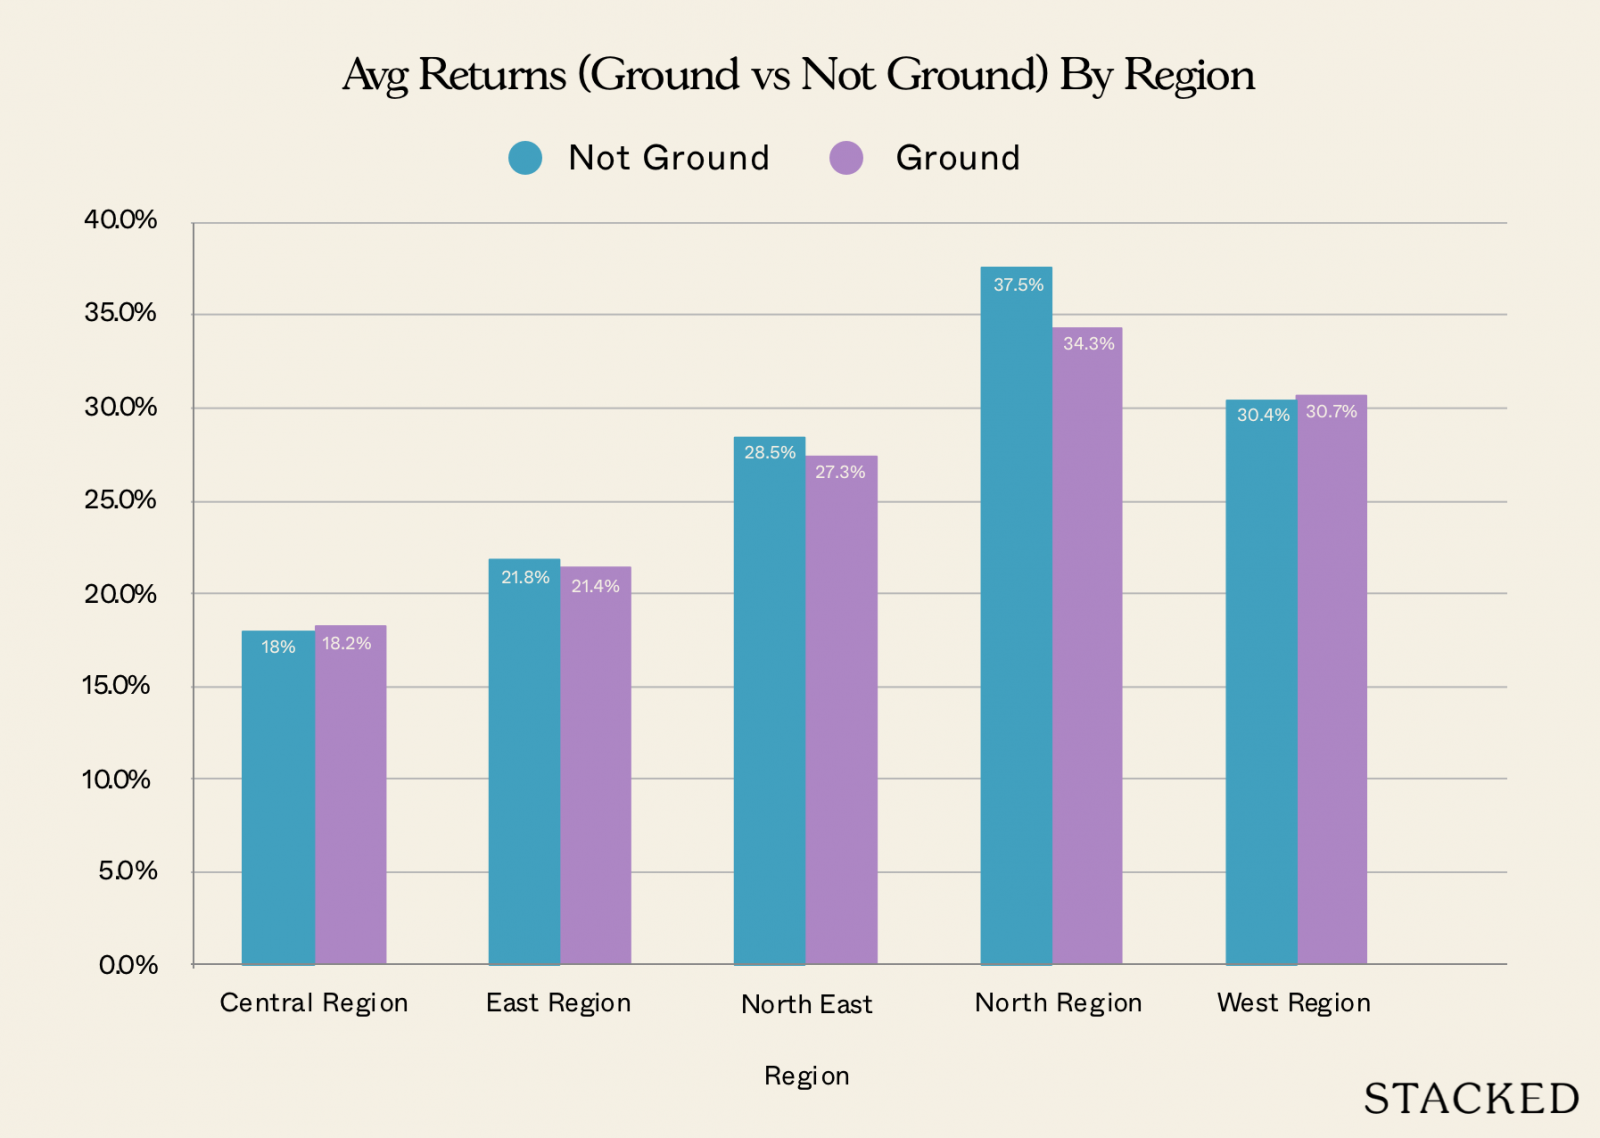
Next, it could be that the region makes a difference. Would a ground floor unit in a prime central region, such as District 9 or 10, perform differently from ground floor units in more mass-market and fringe regions?
We took a look, and again, we maintained the comparison between new-to-resale and resale-to-resale for each region:
| Avg Gains ($) | Avg Gains (%) | Volume | ||||
| Region | NOT GROUND | GROUND | NOT GROUND | GROUND | NOT GROUND | GROUND |
| Central Region | $281,910 | $301,147 | 18.0% | 18.2% | 10,623 | 423 |
| East Region | $238,851 | $238,165 | 21.8% | 21.4% | 4,404 | 342 |
| North East Region | $279,608 | $278,513 | 28.5% | 27.3% | 6,357 | 323 |
| North Region | $320,495 | $288,143 | 37.5% | 34.3% | 2,395 | 210 |
| West Region | $300,777 | $325,736 | 30.4% | 30.7% | 4,027 | 179 |
| Average | $280,620 | $282,745 | 24.5% | 24.7% | 27,806 | 1,477 |
Again, there’s very minimal difference in most regions. The only notable gap was in North region properties, where higher floor units outperformed the ground floor by 3.2 percentage points. The North East region also saw higher floor units outperform by 1.2 percentage points.
Everywhere else, the difference was less than a single percentage point; so perhaps you’ll want to be more picky about higher floors, the further north or north east you go.
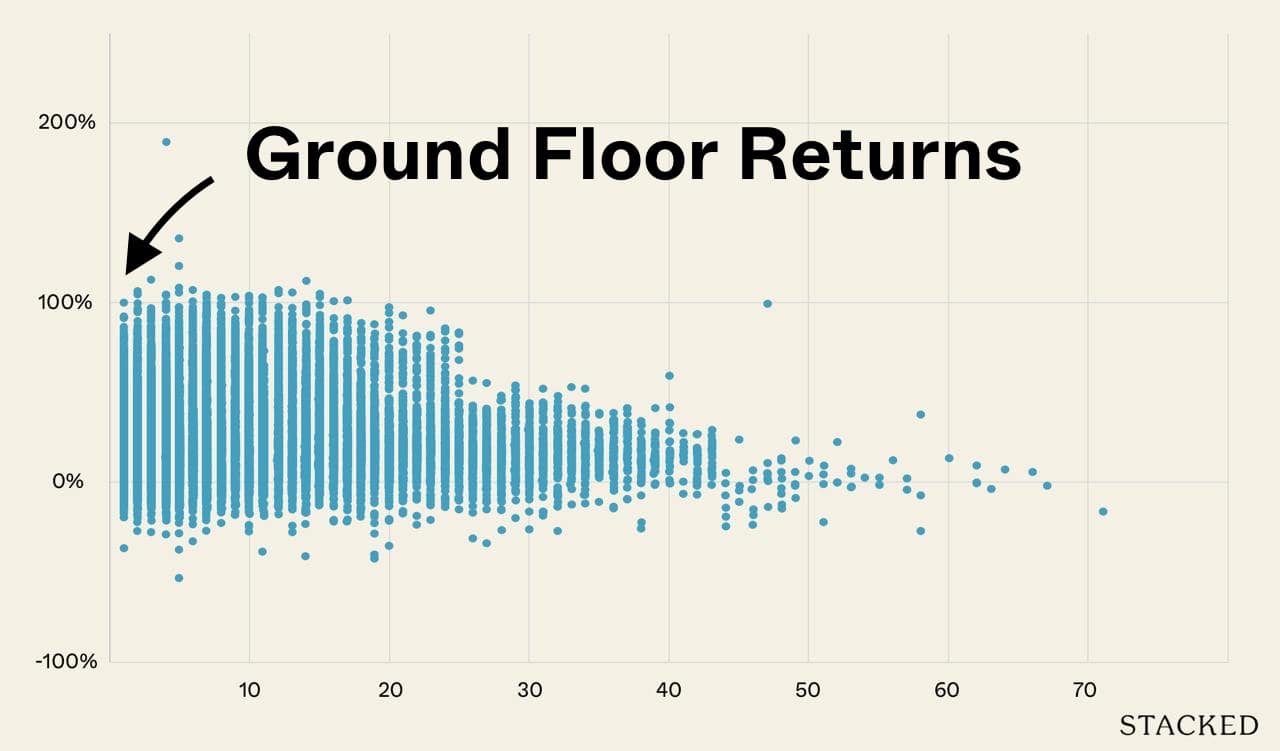
The most interesting results came when we compared by levels/floors
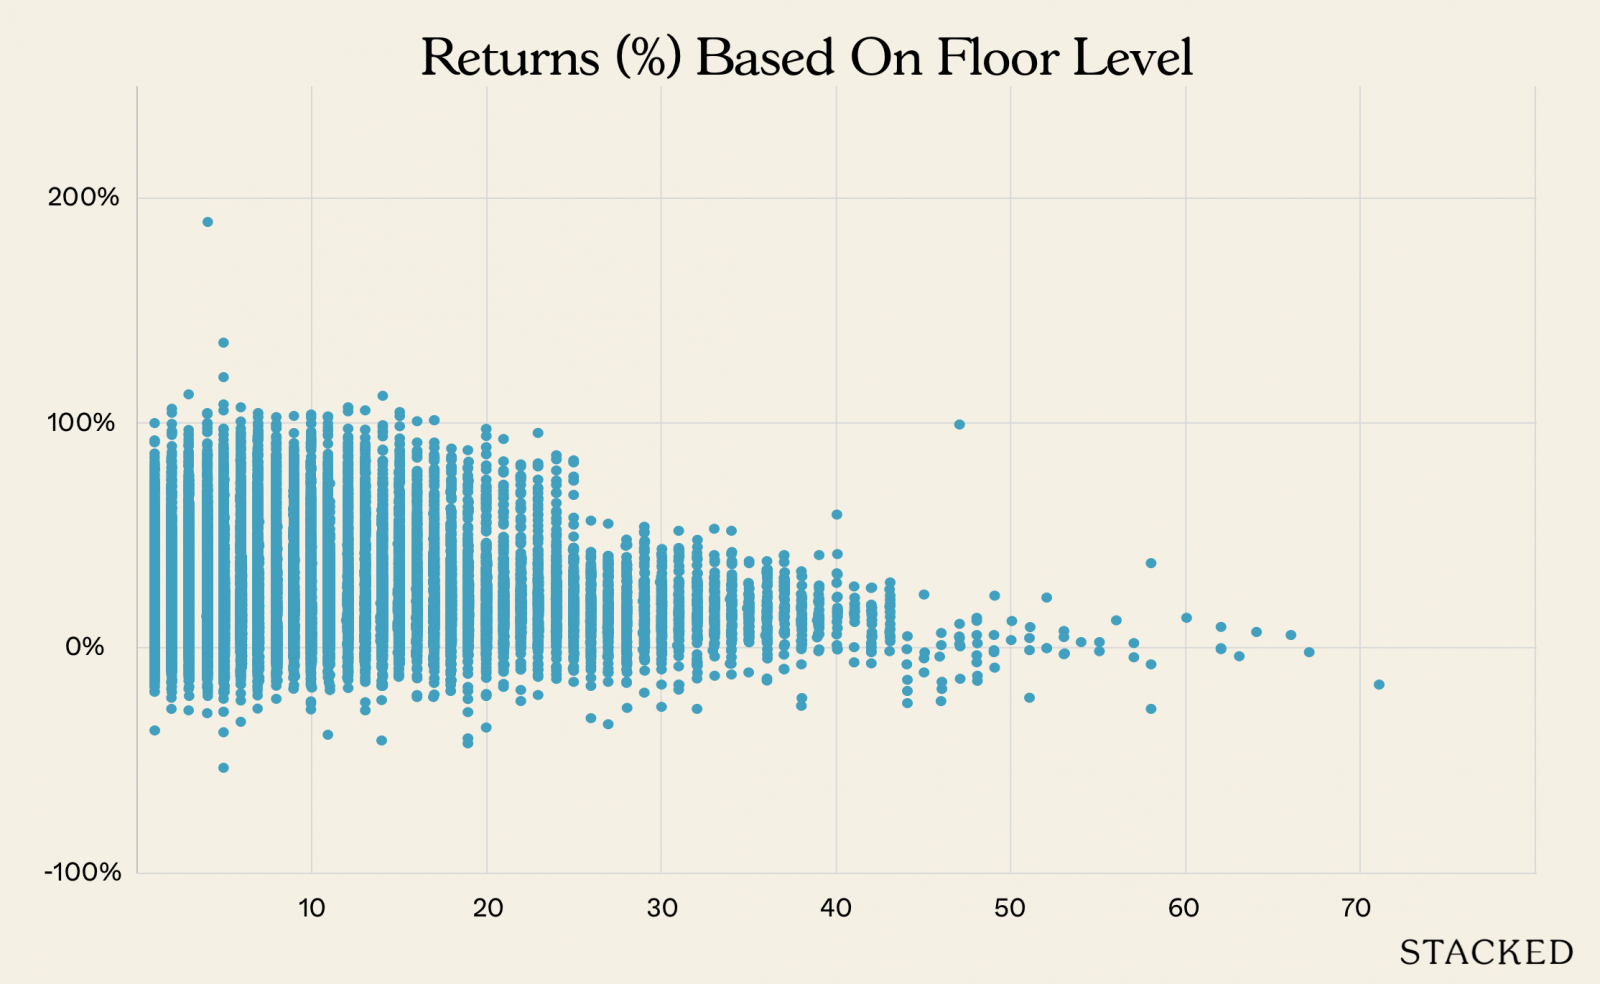
The horizontal axis shows the height (i.e., the further left on the graph, the higher the floor). The vertical axis shows the range of returns, as a percentage.
Note that transaction volumes are very low on the highest floors. Very few condos reach up to 50 storeys or more; and when you get to these topmost floors, you tend to end up with penthouse or premium units. These tend to be rare, one-off transactions, hence the lack of any range in the pricing.
Among the lower floors, the price ranges are wider. But these gains are more uniformly distributed, and not clustered around a tiny handful of transactions. In general though, from the 25th floor and up, gains tend to be much more narrow.
Looking at the top and bottom 25 levels, there’s a visible difference in gains
| Row Labels | New Sale to Resale | New Sale to Sub Sale | Resale to Resale | Sub Sale to New Sale | Sub Sale to Resale | Sub Sale to Sub Sale | Grand Total |
| 25 And Above | 16.6% | 17.3% | 13.9% | 12.1% | 9.1% | 24.1% | 15.7% |
| Below 25 | 30.4% | 19.1% | 22.2% | 12.2% | 15.2% | 25.0% | |
| Average | 29.5% | 19.0% | 21.9% | 12.1% | 12.1% | 17.0% | 24.5% |
With the exception of rare transaction types (e.g., sub-sale-to-sub-sale), those who bought below the 25th floor tended to see higher returns! An average gain of 25 per cent, compared to those who purchased on higher floors (15.7 per cent).
Why would this happen?
When we showed this to realtors, a common reason was that the topmost units in many condos are often penthouses, or other such premium units. These units are intended as indulgences for wealthy buyers, rather than investable assets. Coupled with the low transaction volume, it results in diminished gains.
We suppose that’s plausible. But to stick with the numbers we’ve found, we can draw the following conclusion:
Ground floor units do not see a substantially worse return than higher floor units. Any difference in gains is likely to be marginal and of little real impact. However, you may be interested in units below the 25th floor. Based on what we’ve found, units in this range tended to bring in higher returns.
Speculatively, we’d reference our same theory from earlier: higher floor units tend to cost more from the start, and may just have less room for appreciation.
At Stacked, we like to look beyond the headlines and surface-level numbers, and focus on how things play out in the real world.
If you’d like to discuss how this applies to your own circumstances, you can reach out for a one-to-one consultation here.
And if you simply have a question or want to share a thought, feel free to write to us at stories@stackedhomes.com — we read every message.


0 Comments