


It’s not a surprise that we’re often drawn to stories of the biggest winners/most profitable transactions when it comes to property market news.
But did you know? Our recent compilation on units sold over a 10-year gap showed us that for every 4 successfully appreciated units, 1 unit will fail to make it into the green!
Which means…somewhere out there, a homeowner/investor would have lost a substantial amount of his/her hard-earned cash in the property market.
Factor in an accumulation of interest, maintenance, tax and even renovation fees that most property owners will face during the property ownership years (amongst an outrageous number of other factors) – and things seem to get graver by the second.
Ever wondered what happens when the unthinkable occurs and owners are forced to sell their properties in a property market crash?
Well you’re in the right place.
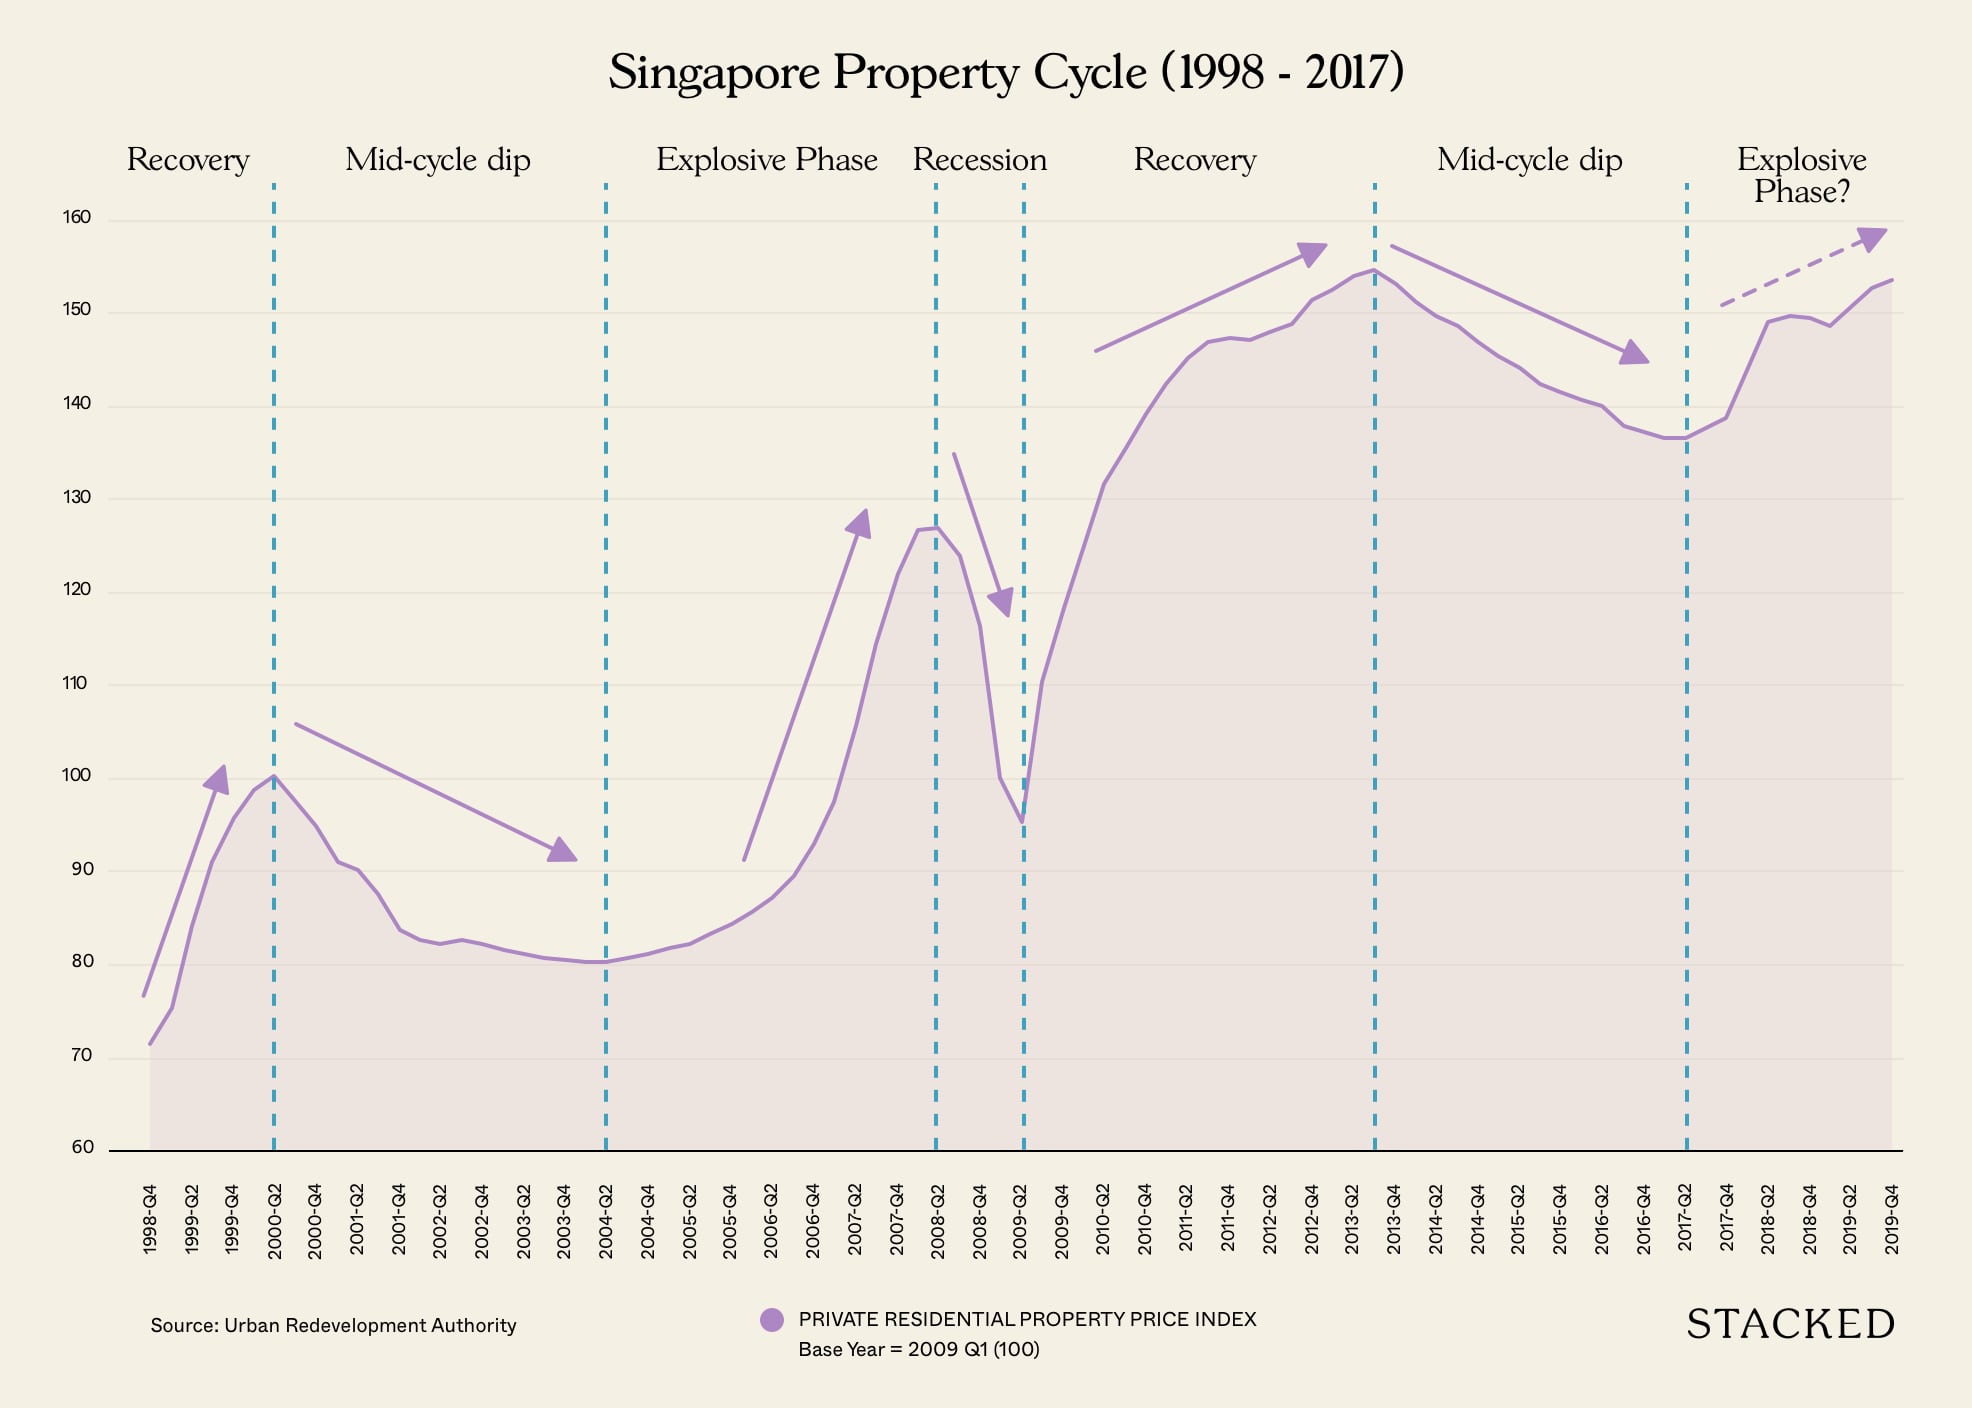
Today’s showreel brings to light the most unfavourable unit sales during the 08/09 property market crash that till today is something most Singaporeans would want to erase from memory.
Sit back and watch as millions of dollars and countless efforts go undone in the face of unprecedented nationwide panic that swept the Singapore property market over a decade ago.
Top 10 Residential Unit Depreciators (Ranked by Absolute $ Drop)
#10 – Ardmore II – #35-03 (Freehold)
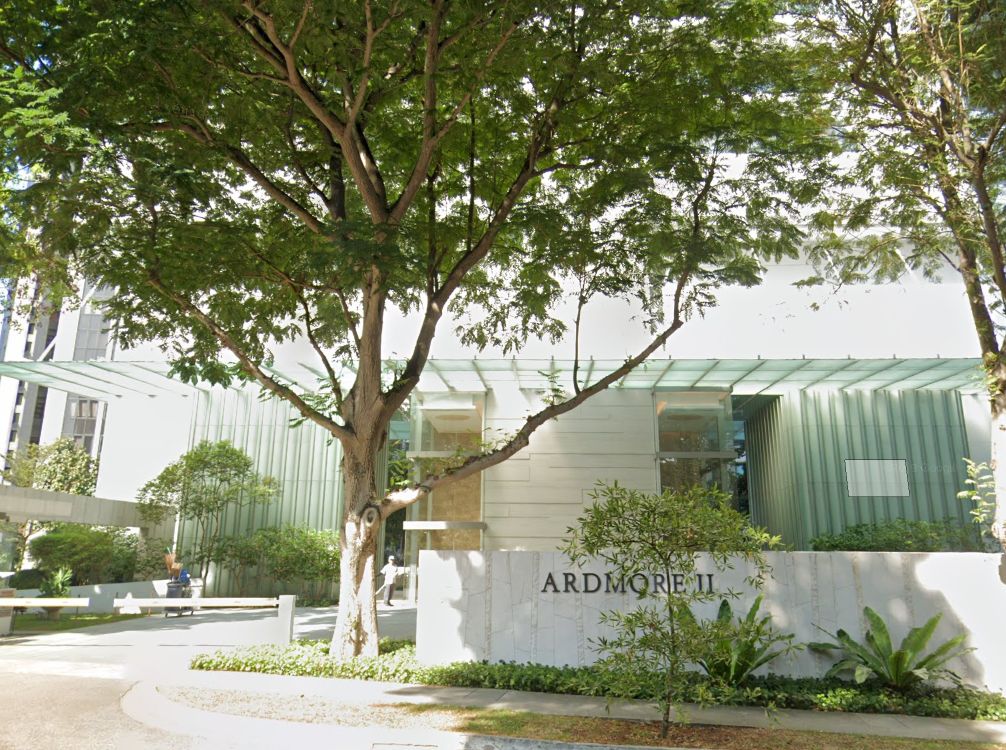
This 2,023 sqft Ardmore II unit along Ardmore Park recorded a -29.5% ($1.62m) appreciation drop from $2,718 psf to $1,917 psf during its sale on 8 April 2009.
Bought For: $5.5million
Sold For: $3.88million
#9 – Ardmore II – #34-03 (Freehold)
In uncanny similarity to #10, this other 2,023 sqft Ardmore II unit along Ardmore Park recorded a -30.75% ($1.66m) appreciation drop from $2,670 psf to $1,849 psf during its sale on 13 April 2009.
Bought For: $5.4million
Sold For: $3.74million
#8 – St. Regis Residences Singapore – #17-02 (999-Year Leasehold)
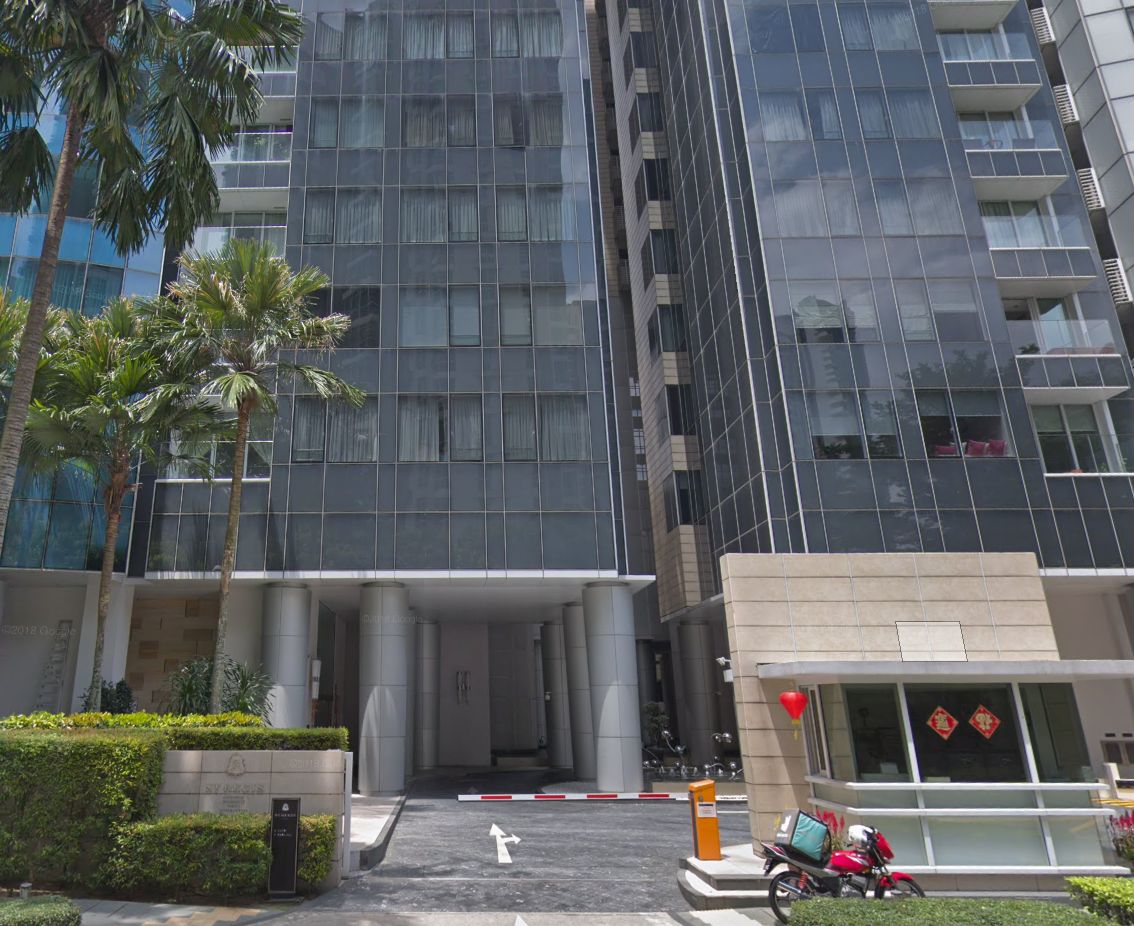
This 2,486 sqft St. Regis Residences unit along Tanglin Road recorded a -26.06% ($1.86m) appreciation drop from $2,882 psf to $2,131 psf during its sale on 12 March 2009.
Bought For: $7.16million
Sold For: $5.3million
#7 – Regency Park – #09-02 (Freehold)
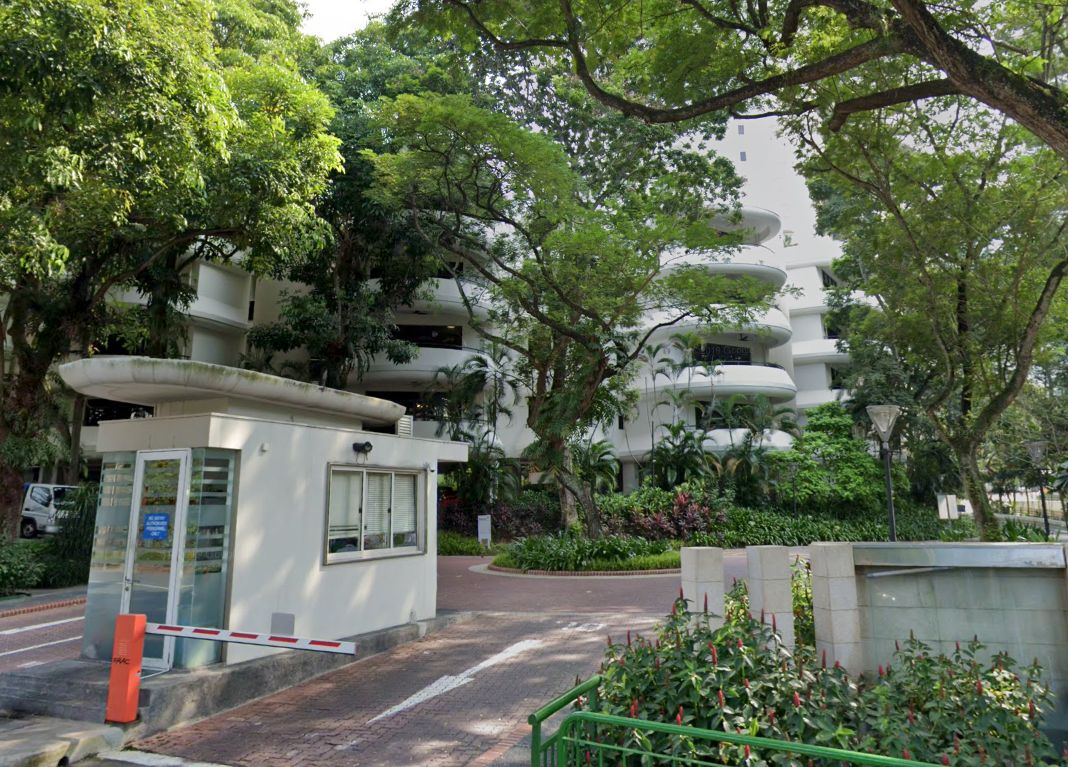
This 3,175 sqft Regency Park unit along Nathan Road recorded a -37.25% ($1.9m) appreciation drop from $1,606 psf to $1,007 psf during its sale on 26 February 2009.
Bought For: $5.1million
Sold For: $3.2million
#6 – The Sail @ Marina Bay – #63-01 (99-Year Leasehold)
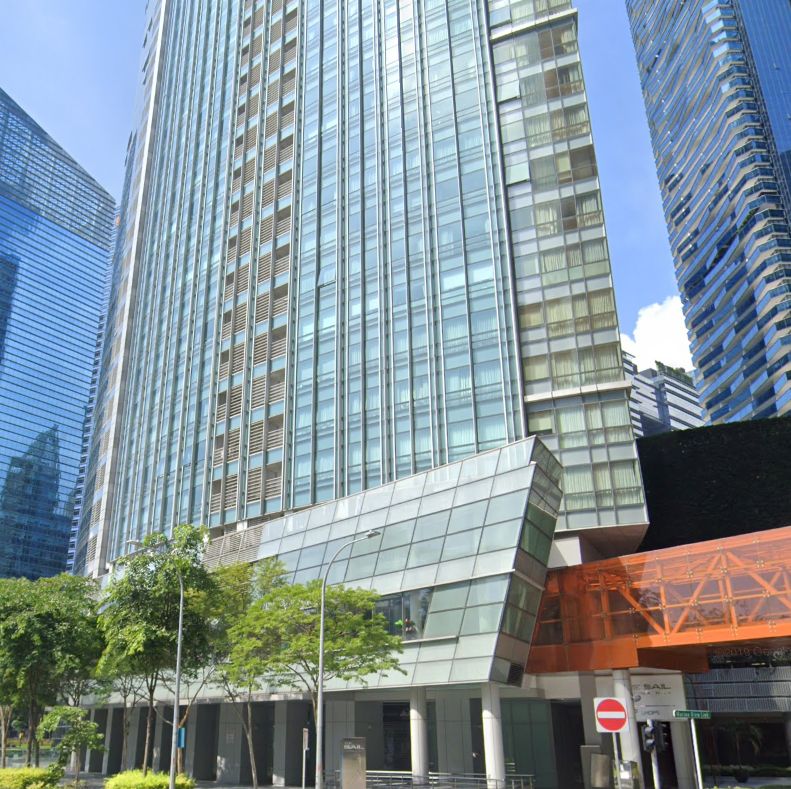
This 1,754 sqft Sail @ Marina Bay unit along Marina Boulevard recorded a -38.65% ($1.91m) appreciation drop from $2,820 psf to $1,730 psf during its sale on 7 May 2009.
Bought For: $4.94million
Sold For: $3.03million
#5 – Regency Park – #07-02 (Freehold)
This other 3,175 sqft Regency Park unit along Nathan Road recorded a -38.25% ($1.97m) appreciation drop from $1,621 psf to $1,001 psf during its sale on 9 March 2009.
Bought For: $5.15million
Sold For: $3.18million
#4 – St. Regis Residences Singapore – #15-07 (999-Year Leasehold)
This second St. Regis Residences unit (1506 sqft) along Tanglin Road recorded a -37.33% ($2.24m) appreciation drop from $3,989 psf to $2,500 psf during its sale on 2 June 2009.
Bought For: $6.01million
Sold For: $3.76million
#3 – Setia Residences – #11-01 (Freehold)
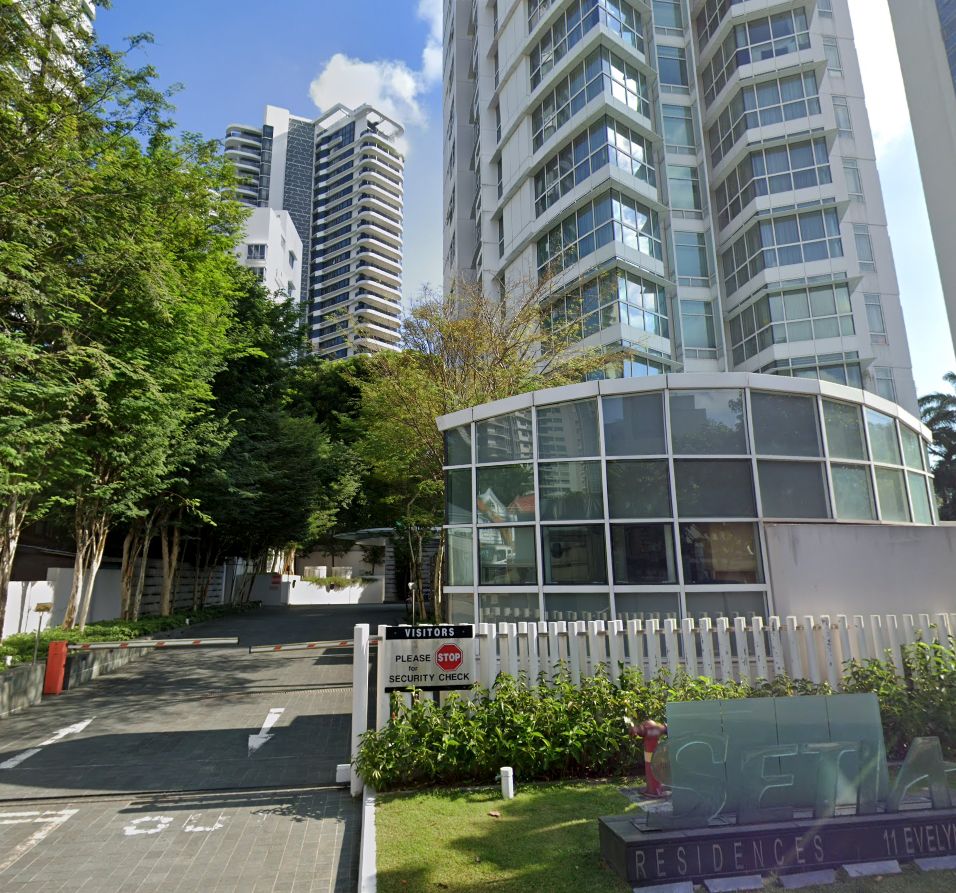
Kicking-off the top 3 ‘biggest losers’, this 3,347 sqft Setia Residences unit along Evelyn Road recorded a -32.48% ($2.55m) appreciation drop from $2,344 psf to $1,583 psf during its sale on 25 May 2009.
Bought For: $7.85million
Sold For: $5.3million
#2 – St. Regis Residences Singapore – #11-05 (999-Year Leasehold)
In second place, the all-too familiar St. Regis Residences, with a 3,896 sqft unit recording a -25.78% ($2.7m) appreciation drop from $2,696 psf to $2,001 psf during its sale on 30 June 2009.
Bought For: $10.5million
Sold For: $7.8million
#1 – St. Regis Residences Singapore – #06-03 (999-Year Leasehold)
Who would’ve guessed.
In first place, our ‘biggest loser’ for the 08/09 property crash period, yet another St. Regis Residences unit.
This time, recording an outrageous -38.62% ($5.01m) appreciation drop from $3,460 psf to $2,124 psf during its sale on 8 May 2009.
Bought For: $12.99million
Sold For: $7.98million
Top 10 Districts that Lost the Most (Ranked by Absolute $ Drop)
(Note: This list only takes into account unit transactions that recorded losses during the 2008/2009 period. Furthermore, due to the similarity of average appreciation loss percentages between the districts (1 decimal point comparison in multiple cases) we’ve decided once again to rank this list in terms of the average total money lost per district.)
#10 – D17, Loyang/Changi

D17 kicks off the top 10 with a $134,120 average total loss.
Developments transacted in the area during the 08/09’ crisis recorded a -14.47% loss on average, ranking it 5th in terms of total average depreciation percentage.
Total District Loss: $5.76million
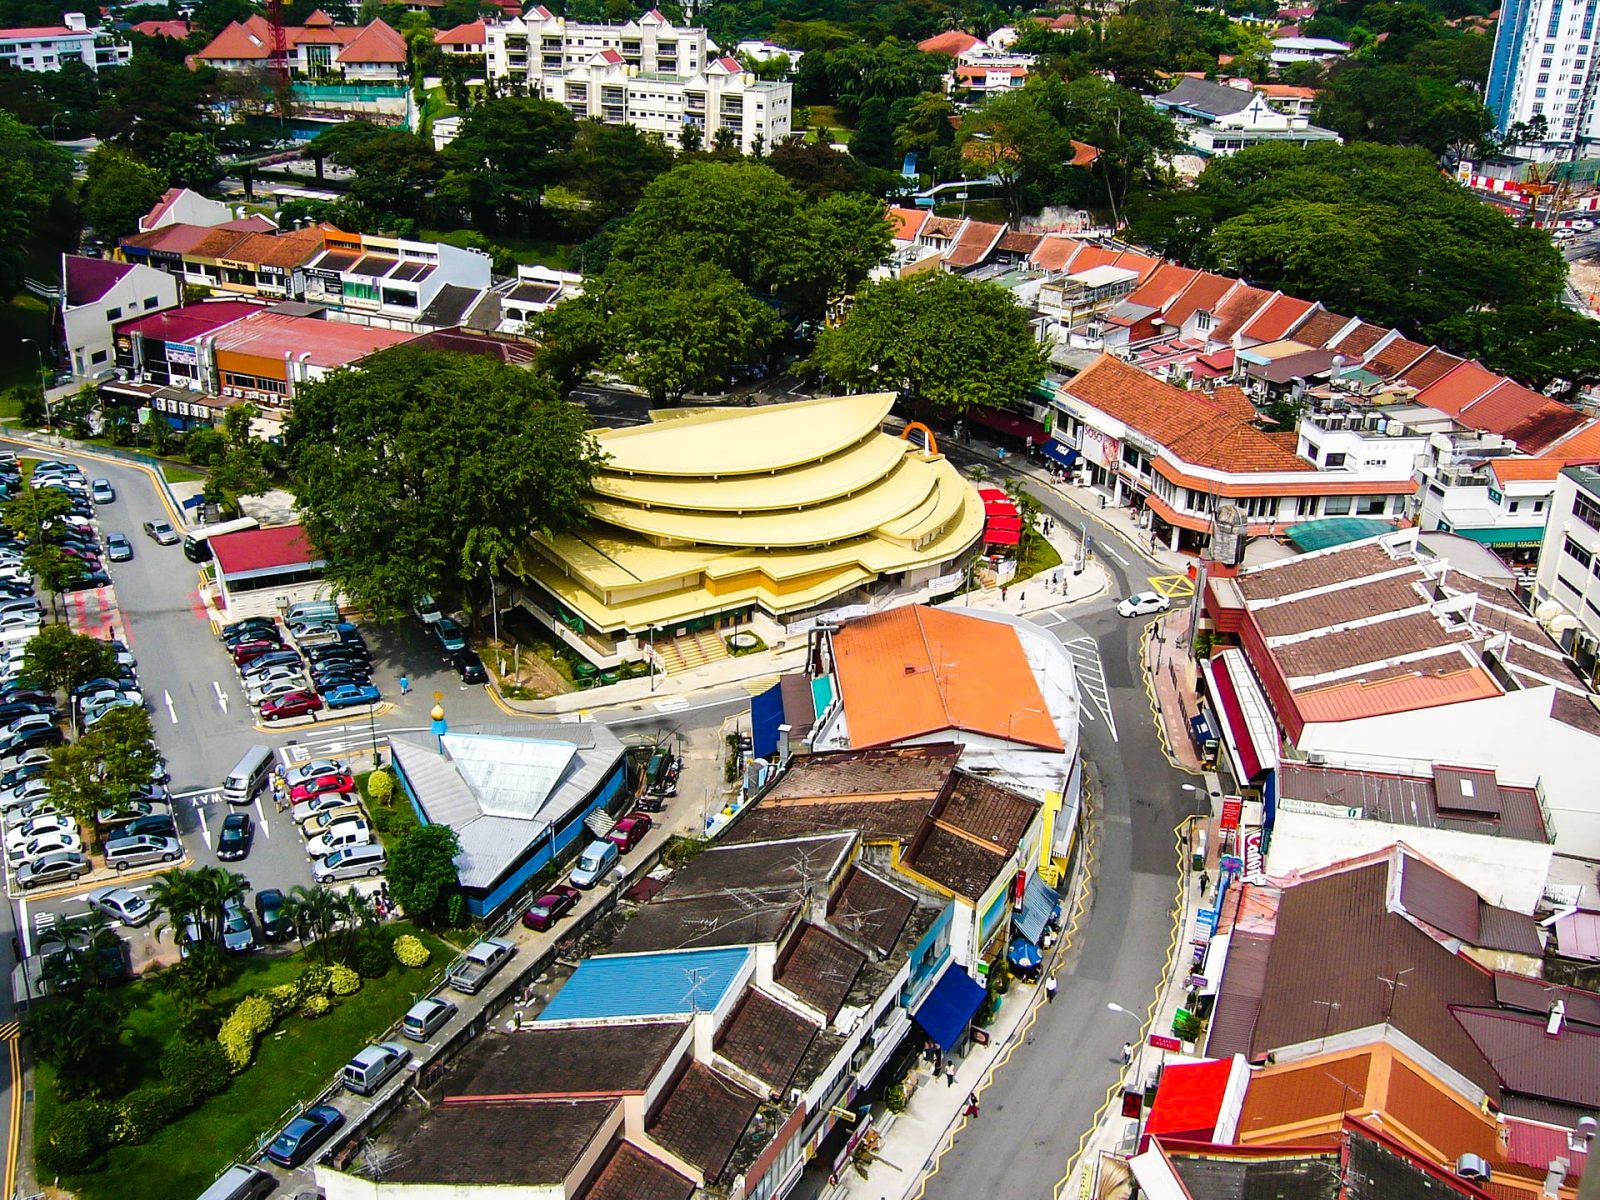
#9 – D15, Katong/Joo Chiat/Amber Road
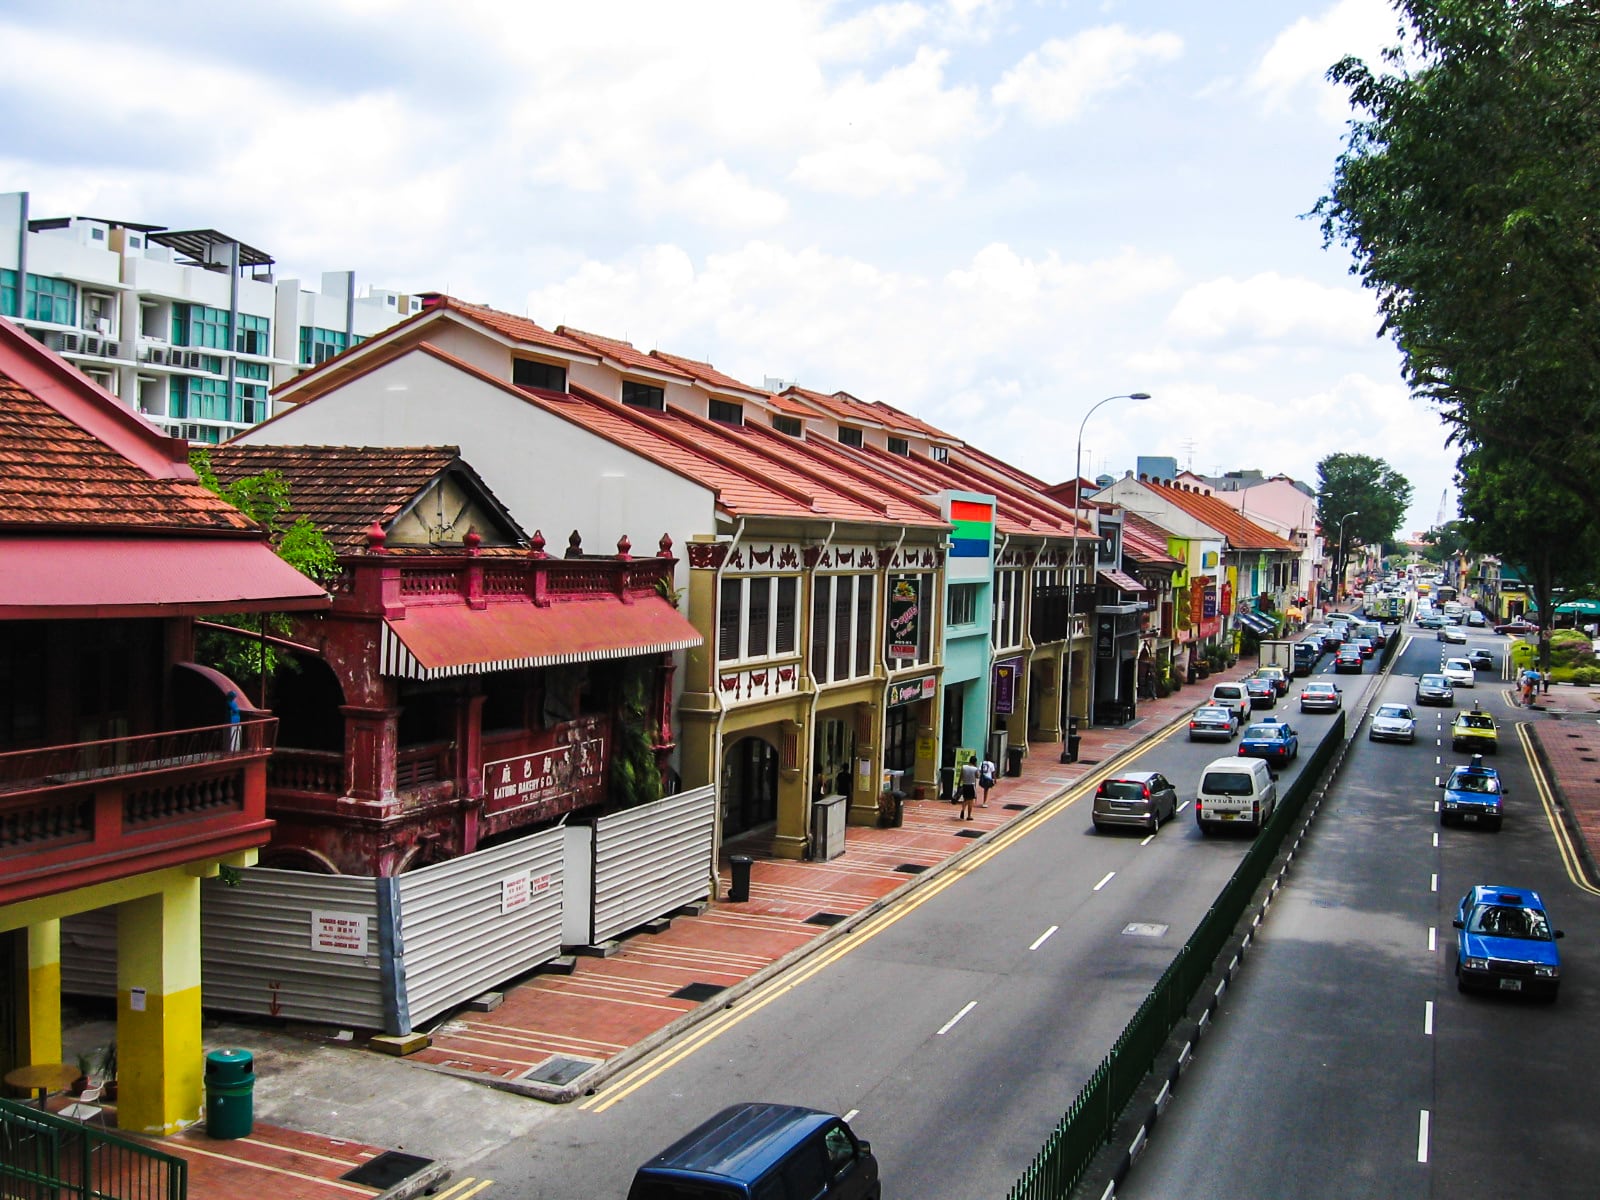
D15 is next on the list with a $135,945 average total loss.
Developments transacted in the area during the 08/09’ crisis recorded a -10.67% loss on average, ranking it 17th in terms of total average depreciation percentage.
Total District Loss: $16,993
#8 – D13, Macpherson/Braddell
D13’s losses recorded $145,656 on average.
Developments transacted in the area during the 08/09’ crisis recorded a -15.59% loss on average, ranking it 2nd in terms of total average depreciation percentage.
Total District Loss: $728,280
#7 – D20, Bishan/Ang Mo Kio
D20’s losses recorded $148,546 on average.
Developments transacted in the area during the 08/09’ crisis recorded a -14.49% loss on average, ranking it 4th in terms of total average depreciation percentage.
Total District Loss: $4.45million
#6 – D3, Queenstown/Tiong Bahru
D3’s losses recorded $153,488 on average.
Developments transacted in the area during the 08/09’ crisis recorded a -11.37% loss on average, ranking it 15th in terms of total average depreciation percentage.
Total District Loss: $5.06million
#5 – D11, Novena/Thomson

D11’s losses recorded $188,617 on average.
Developments transacted in the area during the 08/09’ crisis recorded a -10.29% loss on average, ranking it 19th in terms of total average depreciation percentage.
Total District Loss: $19.23million
#4 – D9, Orchard/River Valley

D9’s losses recorded $253,565 on average.
Developments transacted in the area during the 08/09’ crisis recorded a -11.36% loss on average, ranking it 16th in terms of total average depreciation percentage.
Total District Loss: $30.42million
#3 – D4, Harbourfront/Telok Blangah
Going into the top 3 now, D4’s losses recorded $380,095 on average.
Developments transacted in the area during the 08/09’ crisis recorded a -12.90% loss on average, ranking it 8th in terms of total average depreciation percentage.
Total District Loss: $11.4million
#2 – D1, Marina Bay/Raffles Place
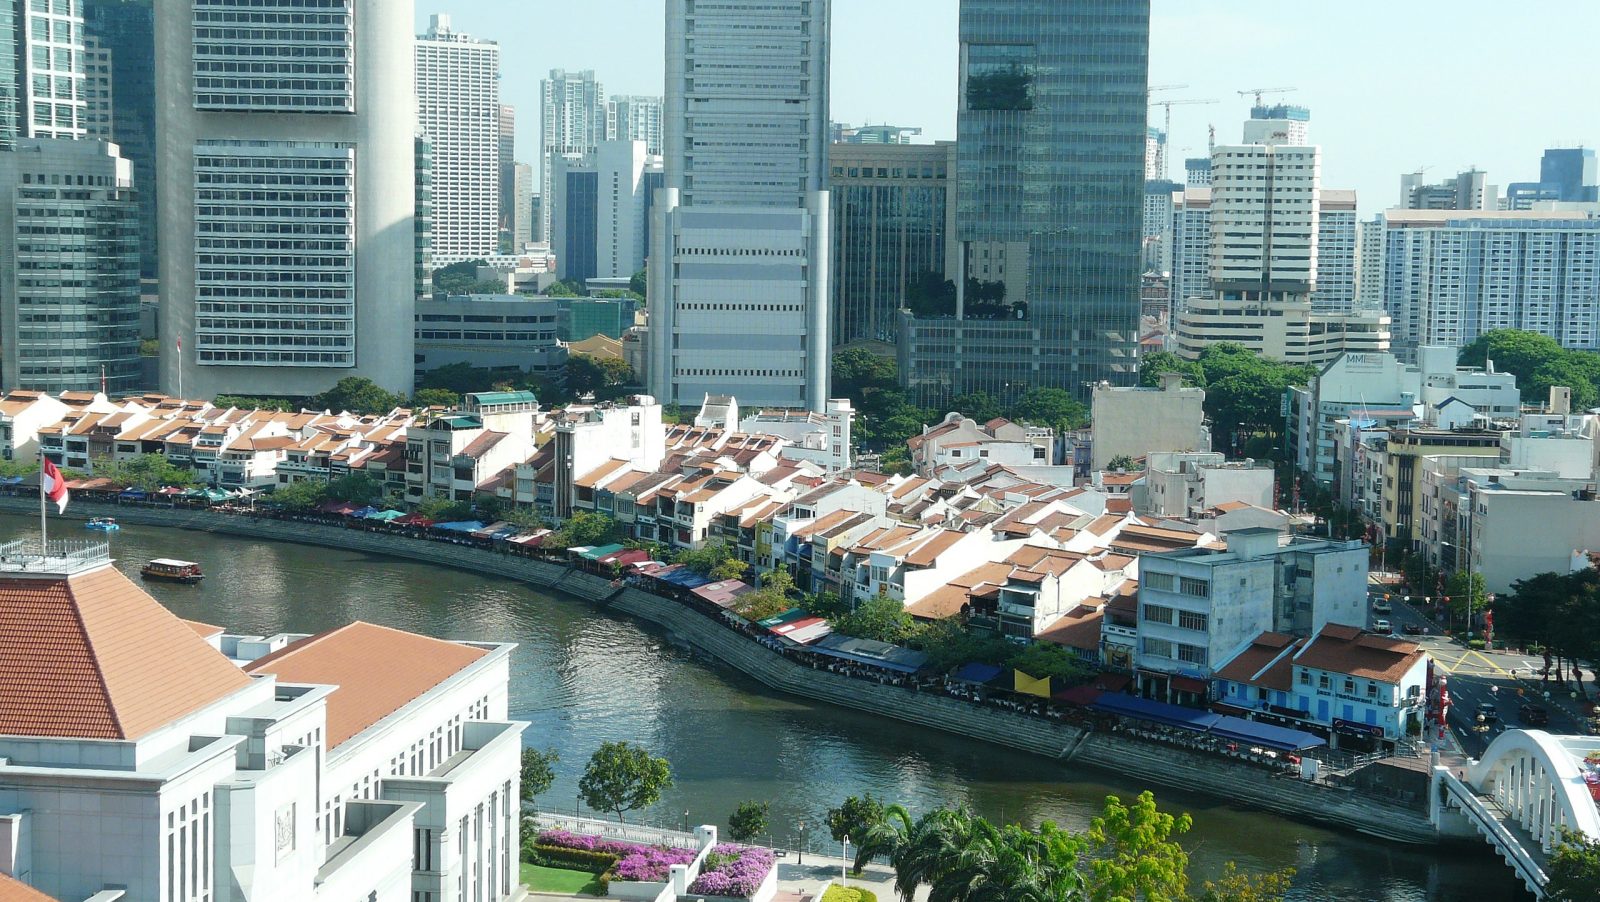
Coming in a close 2nd, we have D1 with losses of $445,811 on average.
Developments transacted in the area during the 08/09’ crisis recorded a -15.67% loss on average, ranking it 1st in terms of total average depreciation percentage.
Total District Loss: $10.69million
#1 – D10, Tanglin/Holland
As for our biggest loser, D10’s losses amounted to a substantial $477,436 on average.
Developments transacted in the area during the 08/09’ crisis recorded a -14.69% loss on average, ranking it 3rd in terms of total average depreciation percentage.
Total District Loss: $63.97million (Highest in all Districts)
Honourable Mentions
- District 25 recorded the highest number of depreciated transactions – 240 of them in total.
- District 2 recorded the lowest average total loss of -4.93% and the second lowest total district loss of $365,782.
- Finally, District 7 noted the lowest total district loss of $37,000 and the second lowest average total loss of -5.61%.
When all is said and done, the end results were quite predictable – the more premium districts were significantly hit harder because of higher quantum and dollar values.
Judging the districts by a percentage average loss yields different results.
| District | Avg Loss |
| 1 | -15.67% |
| 13 | -15.59% |
| 10 | -14.69% |
| 20 | -14.49% |
| 17 | -14.47% |
| 18 | -13.67% |
| 28 | -13.49% |
| 4 | -12.90% |
| 14 | -12.78% |
| 21 | -12.72% |
Final Word (A Key Takeaway)
Some of you might have noticed that we left the stats analysis out this time round.
In essence, that owes to the sheer number of differing policies, district developments and property market sentiments between the 08/09 period and today – making a credible, full-blown analysis nearly impossible without first generating numerous other data points from that time.
Despite that however, there are a number of key takeaways for us from today’s stats.
Firstly, you’d be surprised that in many of these past transactions, staggering losses could have been easily avoided/mitigated – simply by conducting proper market research before buying into the particular unit in the first place, and avoiding panic exit-sales thereafter when the market went sour.
That being said, we should also understand that the best of us could and will still find ourselves in unexpected financial emergencies during dire/unfavourable periods – meaning (on some occasions) the need to immediately sell-off our current unit despite the imminence of rising property market sentiment.
It’s rough, yes. But it’s definitely a possibility for every homeowner.
Now this brings me to my next point. Reserves.
When we have a burning goal/passion (eg. monetary gains) and everything seems to be going smoothly (ie. good economy, stable job etc.), we are often tempted to assert greater ‘gambles’ with our investments – and in doing so heavily deplete our reserves/savings.
Now in these moments, you have to ask yourself this:
‘Is the gamble that I am about to take worth the risk? ie. How certain am I of my returns, and do I have the capacity to deal with unexpected failure? More importantly, how much should I set aside for emergency scenarios?’
The answers to all these questions differ from case to case.
Well-planned short term property investments, for example, would naturally result in smaller margin of errors from any unprecedented financial emergencies.
They would also suit younger individuals with fewer financial commitments – so that in the event of unexpected failure, a likely bounceback could still be on the cards.
If you are a family man/woman however, and your exit strategy involves a wait that spans years from now, it would be wise to think about how much funds (considering you might no longer have access to bank loans post purchase) you should be setting aside for the long haul (emergencies included).
Now regardless of the situation you might find yourself in, I would strongly advise employment of the 6-month rule.
What is the 6-month rule?
In crux, you make sure that you have at least 6 months-worth of salary on hand at all times.
Simple right?
Now this savings might not seem like a ton, but I guarantee you that it will be a lifesaver in times of crisis. 6-months worth of wages that will ensure that your financial responsibilities go answered (loans, daily life etc.)… even if you do lose the payroll.
It will also give you the necessary buffer time for either you or your agent to source a sale for your unit without leading to an extreme amount of cash loss, or worse, bankruptcy.
It’s an unlikely scenario, yes.
But it is something that every investor and homeowner should prepare for, without a shadow of a doubt.
In light of the current Covid-19 period, we’d like to use this piece as a timely reminder to advise the public against panic selling without first adopting a mid-long term view. Please feel free to reach out to us at hello@stackedhomes should you have a property-related concern or query that you’d like to discuss!
At Stacked, we like to look beyond the headlines and surface-level numbers, and focus on how things play out in the real world.
If you’d like to discuss how this applies to your own circumstances, you can reach out for a one-to-one consultation here.
And if you simply have a question or want to share a thought, feel free to write to us at stories@stackedhomes.com — we read every message.

2 Comments
Market crash is hard to see happening in Singapore now with so many cooling measures in place. Like the fed’s ability to lower interest rates in a crisis, the government of Singapore has a lot of options through the cooling measures. It’s a great way to moderate property prices hence unlikely that prices would fall this far.