We Have $850k In Cash: Should We Invest In A Condo In The OCR/RCR Or T-Bills/Bonds/Fixed-Deposits?
-
 Stacked
- July 19, 2024
- 9 min read
- 4 4 Comments
 9 min read
Dear Stacked,
Hope you and the team at Stacked has had a wonderful weekend.
With reference to the response formulated by Stacked in Nov 2023, you will be pleased to know that we have finally settled our purchase of a 4BR, using one name, and will be getting the keys next week! Own stay unit, lots to consider and Mrs took a long time to decide.
Now, I might be pushing my luck for another consult either in print or short response but here goes.
Part 2 of our journey.
- Early 50s (in 2024) (my Mrs)
- Tentative Loan approval from our banker = $450,000
- up to 75 years old
- loan quantum must not be more than 55% of the purchase price
Based on the above financials, we are considering between
(a) Purchasing a 3BR in OCR
- Sengkang, Punggol, Choa Chu Kang, Yishun
- Walking distance to MRT i.e. less than 700m
- Then renting the unit out
(b) Purchasing a 2BR+2B in RCR
- Along the Circle line or Downtown line
- Walking distance to MRT i.e. less than 700m
- Then renting the unit out
(c) Investing Cash + OA
- Mixture of T-Bills, Bonds, Fixed Despots
- probably averaging just under 4%
Additional Notes:
- Yes, we already have emergency cash put aside that would cover at least 36 months of the loan prepayment if we do a 2nd unit purchase
- We are looking to maximize the potential of the idle funds
What would be your preference and thought process? Other than the 3 options presented, we are open to considering any suggestions!
Many thanks in advance!
Editor’s Note: Some financial details were removed for privacy reasons
Hi there,
Congratulations on the purchase of your new home! It’s great that you’ve been able to find something suitable for you and your family to stay.
Now that that’s out of the picture, looking to invest in property is an entirely different thing. As usual, let’s start by assessing your wife’s affordability before going into more detail on the different options.
Affordability
| Estimated loan quantum given by the banker | $450,000 |
| CPF funds | $400,000 |
| Cash | $850,000 |
| Total loan + CPF + cash | $1,700,000 |
| BSD based on $1,700,000 | $54,600 |
| Estimated affordability | $1,645,400 |
Considering the amount of CPF and cash your wife has, it is unlikely her loan quantum will exceed 55% of the purchase price.
Next, let’s look through the options that you’ve provided. Given this is an investment, we would refrain from providing advice based on the options you have provided as those are limiting constraints if your main objective is the financials and not as an own stay option.
Let’s take a look why:
The performance of condos in OCR and RCR
We will be looking specifically at the resale transactions of non-landed private properties.
| Year | OCR | YoY | RCR | YoY | CCR | YoY |
| 2013 | $1,055 | – | $1,509 | – | $2,054 | – |
| 2014 | $1,074 | 1.80% | $1,449 | -3.98% | $1,975 | -3.85% |
| 2015 | $1,078 | 0.37% | $1,383 | -4.55% | $1,972 | -0.15% |
| 2016 | $1,054 | -2.23% | $1,368 | -1.08% | $2,063 | 4.61% |
| 2017 | $1,072 | 1.71% | $1,437 | 5.04% | $2,059 | -0.19% |
| 2018 | $1,111 | 3.64% | $1,505 | 4.73% | $2,208 | 7.24% |
| 2019 | $1,099 | -1.08% | $1,520 | 1.00% | $2,278 | 3.17% |
| 2020 | $1,087 | -1.09% | $1,495 | -1.64% | $2,119 | -6.98% |
| 2021 | $1,167 | 7.36% | $1,568 | 4.88% | $2,111 | -0.38% |
| 2022 | $1,292 | 10.71% | $1,690 | 7.78% | $2,187 | 3.60% |
| 2023 | $1,410 | 9.13% | $1,823 | 7.87% | $2,204 | 0.78% |
| Average | – | 3.03% | – | 2.00% | – | 0.78% |
Between 2013 and 2018, the property market was tapering off from a high and the market never really picked up until some time from 2017/18. The subsequent years through COVID were when the property market boomed again, with the OCR experiencing the highest growth, followed by the RCR and CCR.
There are many reasons as to why this was the case.
- Decentralisation efforts with more hubs in the RCR and OCR. This reduces the demand to stay in the central area. Given the similar convenience at a more affordable price point, it’s natural that these two regions saw a higher growth rate.
- The OCR and RCR primarily cater to homeowners rather than investors, specifically foreign investors. With an increased tightening in regulations to curb the property boom from 2013 and even from 2020, foreign money that traditionally flows into CCR properties ran dry. Additionally, the current 60% ABSD payable by foreign buyers may further restrain property prices in this area.
- On the other hand, housing affordability became a greater issue, prompting buyers to look further out. This created a stronger demand for OCR and RCR properties, particularly HDB upgraders who are more inclined to stay within the same estate and needed to find properties that were not priced too highly so they could make the upgrade.
Now, let’s delve into the specific estates you’re considering, starting with those in the OCR. We want to do this because we should see if any specific estates lag behind in growth.
| Year | Sengkang | YoY | Choa Chu Kang | YoY | Yishun | YoY | All SGP | YoY |
| 2013 | $917 | – | $833 | – | $787 | – | $1,245 | – |
| 2014 | $839 | -8.51% | $804 | -3.48% | $779 | -1.02% | $1,190 | -4.42% |
| 2015 | $795 | -5.24% | $760 | -5.47% | $798 | 2.44% | $1,191 | 0.08% |
| 2016 | $835 | 5.03% | $748 | -1.58% | $819 | 2.63% | $1,248 | 4.79% |
| 2017 | $877 | 5.03% | $769 | 2.81% | $838 | 2.32% | $1,292 | 3.53% |
| 2018 | $997 | 13.68% | $762 | -0.91% | $878 | 4.77% | $1,325 | 2.55% |
| 2019 | $998 | 0.10% | $779 | 2.23% | $870 | -0.91% | $1,344 | 1.43% |
| 2020 | $1,043 | 4.51% | $843 | 8.22% | $864 | -0.69% | $1,294 | -3.72% |
| 2021 | $1,095 | 4.99% | $877 | 4.03% | $987 | 14.24% | $1,345 | 3.94% |
| 2022 | $1,227 | 12.05% | $990 | 12.88% | $1,114 | 12.87% | $1,455 | 8.18% |
| 2023 | $1,350 | 10.02% | $1,212 | 22.42% | $1,225 | 9.96% | $1,562 | 7.35% |
| Average | – | 4.17% | – | 4.12% | – | 4.66% | – | 2.37% |
Here, we are focusing solely on resale transactions of non-landed private properties. Over the past 10 years, all three estates have exhibited a higher average growth rate compared to other properties across the island. Not a surprise here.
While all estates saw the highest YoY change during and after the pandemic, properties in Sengkang demonstrated relatively consistent appreciation over the years. This could be due to the constant supply of new projects in the area, which, as they enter the resale market, help to drive up the average price per square foot (PSF) since new launch condos tend to cost more on a per square foot basis than older resale condos.
Let’s also consider Punggol where the first resale transaction for a non-landed private property happened only in 2016:
| Year | Sengkang | YoY | Punggol | YoY | Choa Chu Kang | YoY | Yishun | YoY | All SGP | YoY |
| 2016 | $835 | – | $890 | – | $748 | – | $819 | – | $1,248 | – |
| 2017 | $877 | 5.03% | $946 | 6.29% | $769 | 2.81% | $838 | 2.32% | $1,292 | 3.53% |
| 2018 | $997 | 13.68% | $1,007 | 6.45% | $762 | -0.91% | $878 | 4.77% | $1,325 | 2.55% |
| 2019 | $998 | 0.10% | $1,014 | 0.70% | $779 | 2.23% | $870 | -0.91% | $1,344 | 1.43% |
| 2020 | $1,043 | 4.51% | $1,003 | -1.08% | $843 | 8.22% | $864 | -0.69% | $1,294 | -3.72% |
| 2021 | $1,095 | 4.99% | $1,071 | 6.78% | $877 | 4.03% | $987 | 14.24% | $1,345 | 3.94% |
| 2022 | $1,227 | 12.05% | $1,227 | 14.57% | $990 | 12.88% | $1,114 | 12.87% | $1,455 | 8.18% |
| 2023 | $1,350 | 10.02% | $1,323 | 7.82% | $1,212 | 22.42% | $1,225 | 9.96% | $1,562 | 7.35% |
| Average | – | 7.20% | – | 5.93% | – | 7.38% | – | 6.08% | – | 3.32% |
Despite Punggol slightly lagging behind the other three estates, its performance is still considerably better than the average growth rate of all other properties in Singapore during the same period.
With a budget of $1.6M, let’s explore some options within your affordability in these specific areas. Since we don’t know your intended holding period, we’ve filtered for newer properties that are within a 10-minute walk to the MRT station.
| Project | District | Tenure | TOP year | Average 3b transacted price (Jan 2024 till date) | Average 3b rental(Jan 2024 till date) | Average rental yield* |
| Wandervale | 23 | 99 years | 2019 | $1,461,429 | $4,000 | 3.28% |
| La Fiesta | 19 | 99 years | 2016 | $1,461,125 | $4,035 | 3.31% |
| Parc Centros | 19 | 99 years | 2016 | $1,612,000 | $4,133 | 3.08% |
| A Treasure Trove | 19 | 99 years | 2015 | $1,627,815 | $4,440 | 3.27% |
| The Luxurie | 19 | 99 years | 2015 | $1,525,000 | $4,279 | 3.37% |
| The Rainforest | 23 | 99 years | 2015 | $1,434,299 | $4,550 | 3.81% |
*Rental yield will vary depending on the purchase price and rental
These projects merely serve as a reference but they may or may not be suitable for you. We strongly advise that you consult a property agent for further analysis.
The table indicates that the average rental yield of these projects is quite decent and comparable.
Is buying close to an MRT necessarily better for investment purposes?
It’s commonly believed that proximity to an MRT station guarantees better rental yield, but this is not always the case. While such properties might be easier to rent due to added convenience, they also tend to be priced higher.
Regardless, condos within walking distance to an MRT would have greater visibility to the general homebuyer, and with private transport costs going up, you may see increased demand of properties near an MRT. We can already see that translating toward the popularity of integrated projects in Singapore from the last few years.
That said, there may also be “undervalued” properties that aren’t close to an MRT that could generate decent capital appreciation.
Here are some other projects in the same estates with more affordable prices and comparable rental yields, but not near the MRT station.
| Project | District | Tenure | TOP year | Average 3b transacted price (Jan 2024 till date) | Average 3b rental(Jan 2024 till date) | Average rental yield |
| High Park Residences | 28 | 99 years | 2019 | $1,246,648 | $3,633 | 3.50% |
| Treasure Crest | 19 | 99 years | 2018 | $1,525,754 | $4,300 | 3.38% |
| Sol Acres | 23 | 99 years | 2018 | $1,403,759 | $4,075 | 3.48% |
| The Terrace | 19 | 99 years | 2017 | $1,419,095 | $4,380 | 3.70% |
High Park Residences comes to mind here, as it is one of those more well known developments that isn’t near the main MRT. Residents here have to board the LRT and ride 4 stops to Sengkang MRT. Including walking time, it takes residents around 15 minutes to get to the main MRT. By bus, it’s slightly longer.
If you were an investor walking into the showflat and told that it would take 15 – 20 minutes for residents of this project to reach the MRT, would you turn it down right away? We wouldn’t be surprised if you would, but here’s how profitable this project became:
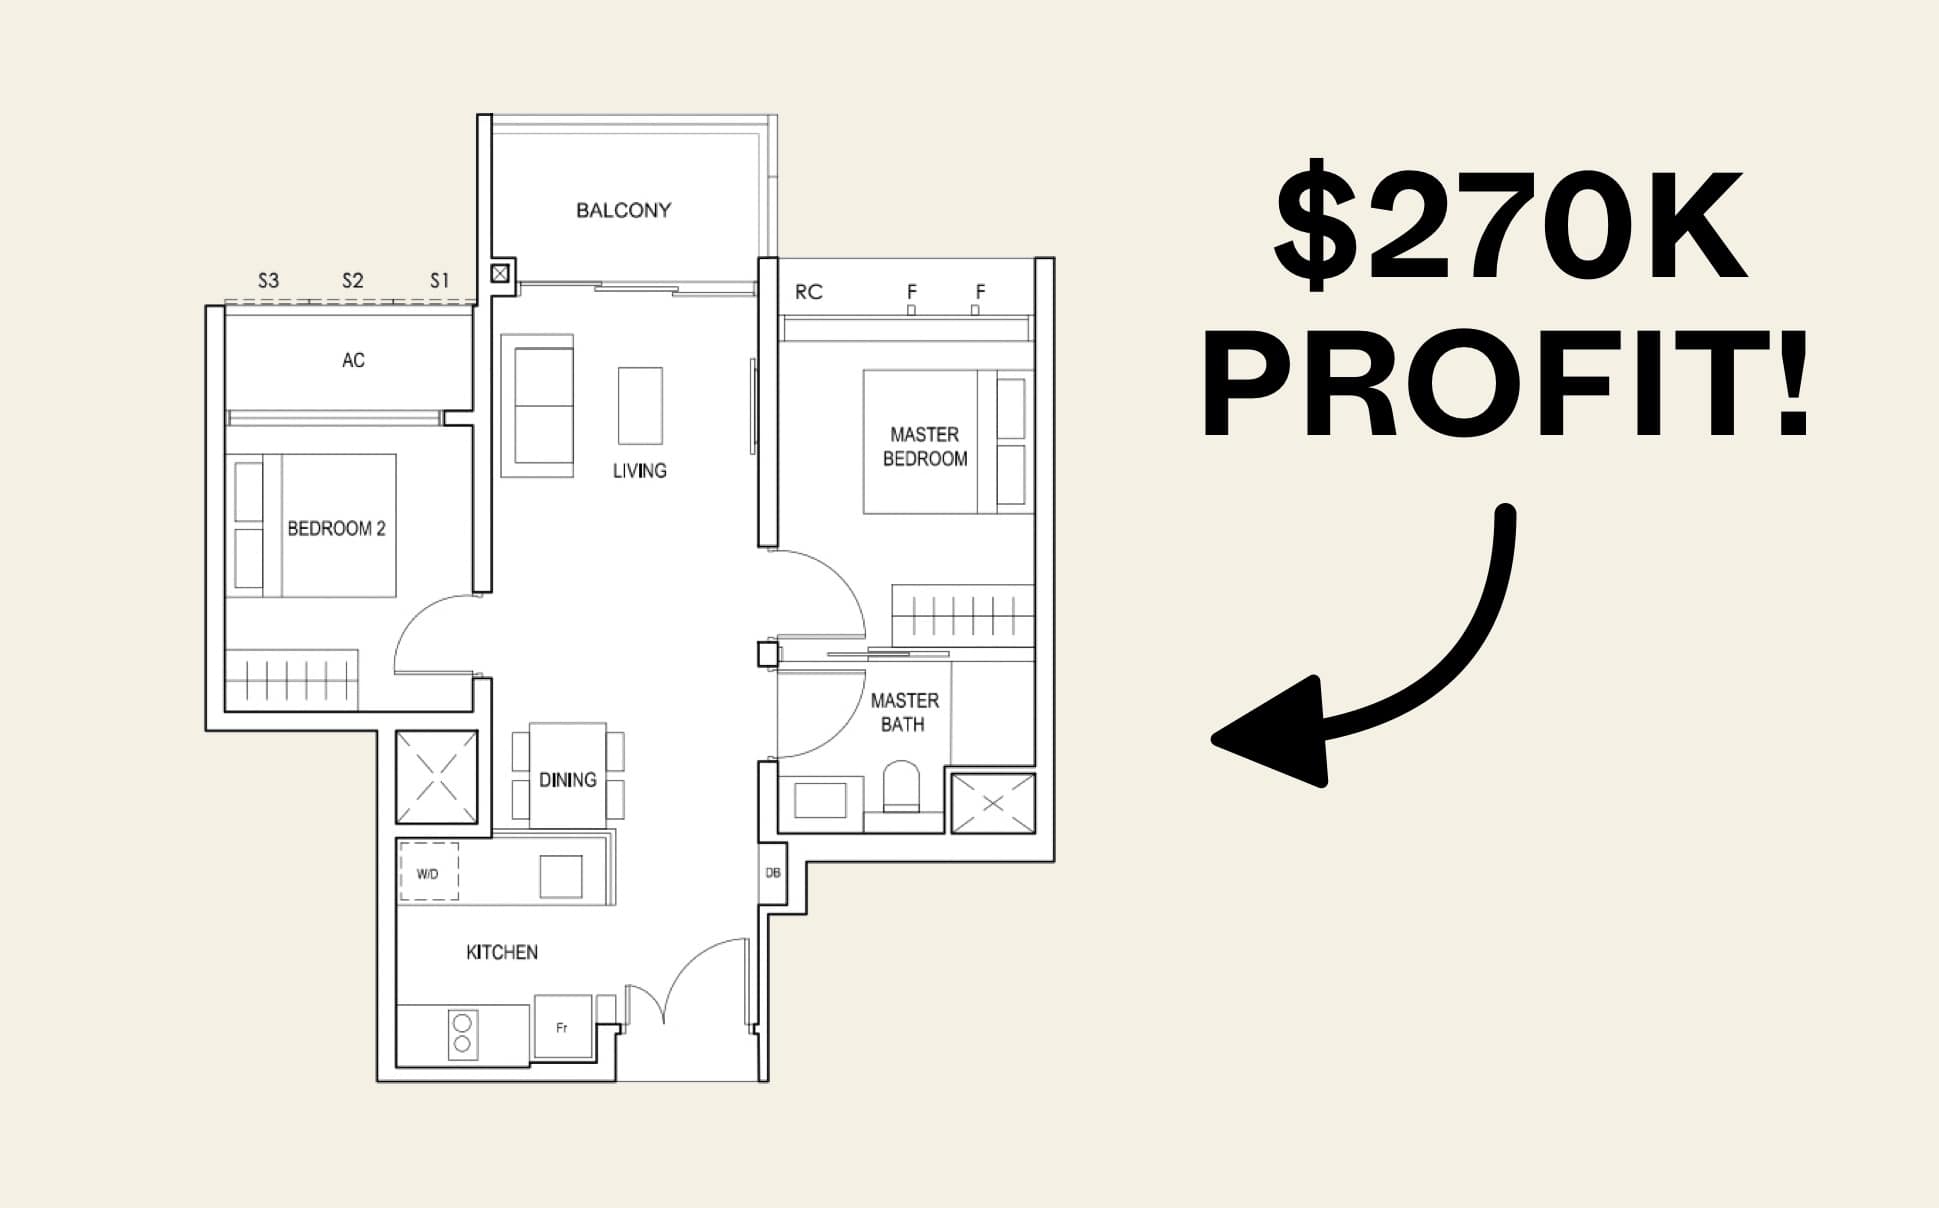
Since then, there have been 423 profitable to 0 unprofitable transactions. And each profitable transaction raked in around 4% or more in annualised returns.
This reinforces our point – when it comes to investment, it may not make sense to start off with a set of filters that could hinder your portfolio. It’s good to know what does well, in general, and what doesn’t do well. But as an investor, it’s important to stay abreast of the existing and future opportunities. This can be quite time-consuming, so having a good property agent who is on the ground and knowledgeable can really add value.
Now let’s move on to those in the RCR.
A quick search on property portals reveals a considerable number of newer 2-bedroom units available for under $1.6M in the RCR.
These are a few that are within walking distance of an MRT station:
| Project | District | Tenure | TOP year | Average 2b transacted price (Jan 2024 till date) | Average 2b rental(Jan 2024 till date) | Average rental yield* |
| The Woodleigh Residences | 13 | 99 years | 2023 | $1,453,571 | $4,494 | 3.71% |
| Stirling Residences | 03 | 99 years | 2022 | $1,489,317 | $4,642 | 3.74% |
| Queens Peak | 03 | 99 years | 2020 | $1,457,500 | $4,720 | 3.89% |
| Gem Residences | 12 | 99 years | 2019 | $1,226,625 | $3,707 | 3.63% |
| Alex Residences | 03 | 99 years | 2017 | $1,413,778 | $4,880 | 4.14% |
| Eight Riversuites | 12 | 99 years | 2016 | $1,312,725 | $3,890 | 3.56% |
*Rental yield will vary depending on the purchase price and rental
When comparing the rental yields of projects in the RCR with those in the OCR, the difference is marginal. However, buying a larger unit in the OCR may be more expensive. This is a tradeoff between putting in more cash for the property vs investing elsewhere.
Is buying in the OCR/RCR necessarily better for investment?
We assume that your interest in purchasing either a 3-bedroom unit in the OCR or a 2-bedroom unit in the RCR is based on affordability. However, since you’re considering this as an investment, it may be beneficial not to restrict yourself to these options alone.
While both the OCR and RCR have shown strong growth rates recently, there are still some developments in these regions that do not perform well. Conversely, even though the CCR has had a slower overall growth rate, there are developments there that have performed well.
| Year | Tribeca (CCR) | YoY | The Hillier (OCR) | YoY | All SGP | YoY |
| 2017 | $1,787 | – | $1,307 | – | $1,292 | – |
| 2018 | $1,931 | 8.06% | $1,358 | 3.90% | $1,325 | 2.55% |
| 2019 | $2,018 | 4.51% | $1,386 | 2.06% | $1,344 | 1.43% |
| 2020 | $2,032 | 0.69% | $1,352 | -2.45% | $1,294 | -3.72% |
| 2021 | $2,159 | 6.25% | $1,424 | 5.33% | $1,345 | 3.94% |
| 2022 | $2,218 | 2.73% | $1,488 | 4.49% | $1,455 | 8.18% |
| 2023 | $2,489 | 12.22% | $1,550 | 4.17% | $1,562 | 7.35% |
| Average | – | 5.74% | – | 2.92% | – | 3.29% |
Here, we’re merely providing an example because Tribeca and The Hillier have distinctly different characteristics, primarily their tenure – Tribeca is freehold, while The Hillier is a 99-year leasehold, making a direct comparison less equitable. Nevertheless, with a budget of $1.6M, you can afford a unit in either development, highlighting that the ultimate outcome largely depends on the specific development you choose.
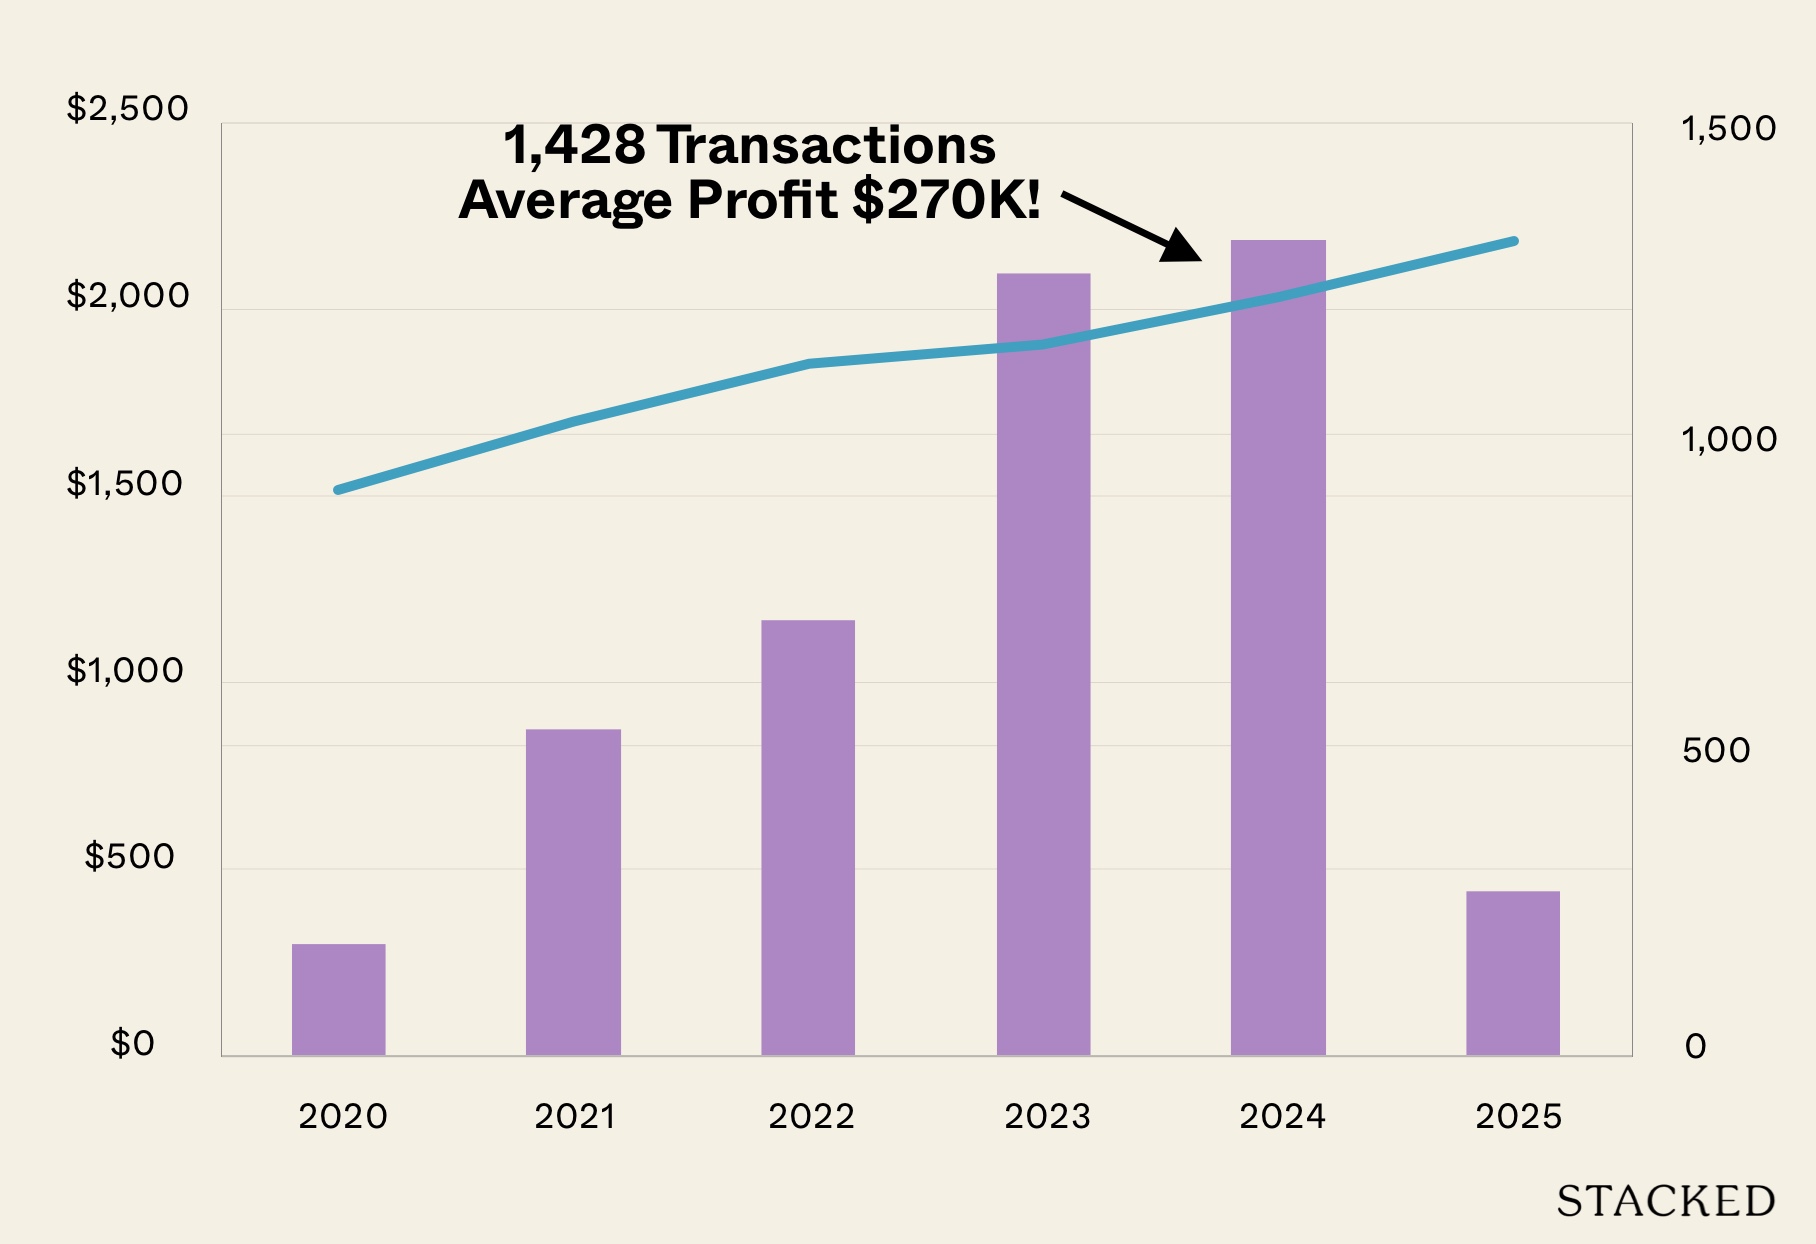
Here are some of the profitable transactions from Tribeca. The 517 sq ft unit in particular was purchased for just over $1 million dollars in 2017 and sold at an annulised return of 4.2% over 6 years:
Of course, this is just one example, and whether your investment is good or bad really depends on the project and price paid.
Additionally, you did not specify whether you’re looking at resale or new launch properties, and it could be worthwhile exploring the latter. With the progressive payment scheme, the initial financing requirement is reduced, allowing you to invest in something safer initially and potentially benefit from lower interest rates in the future.
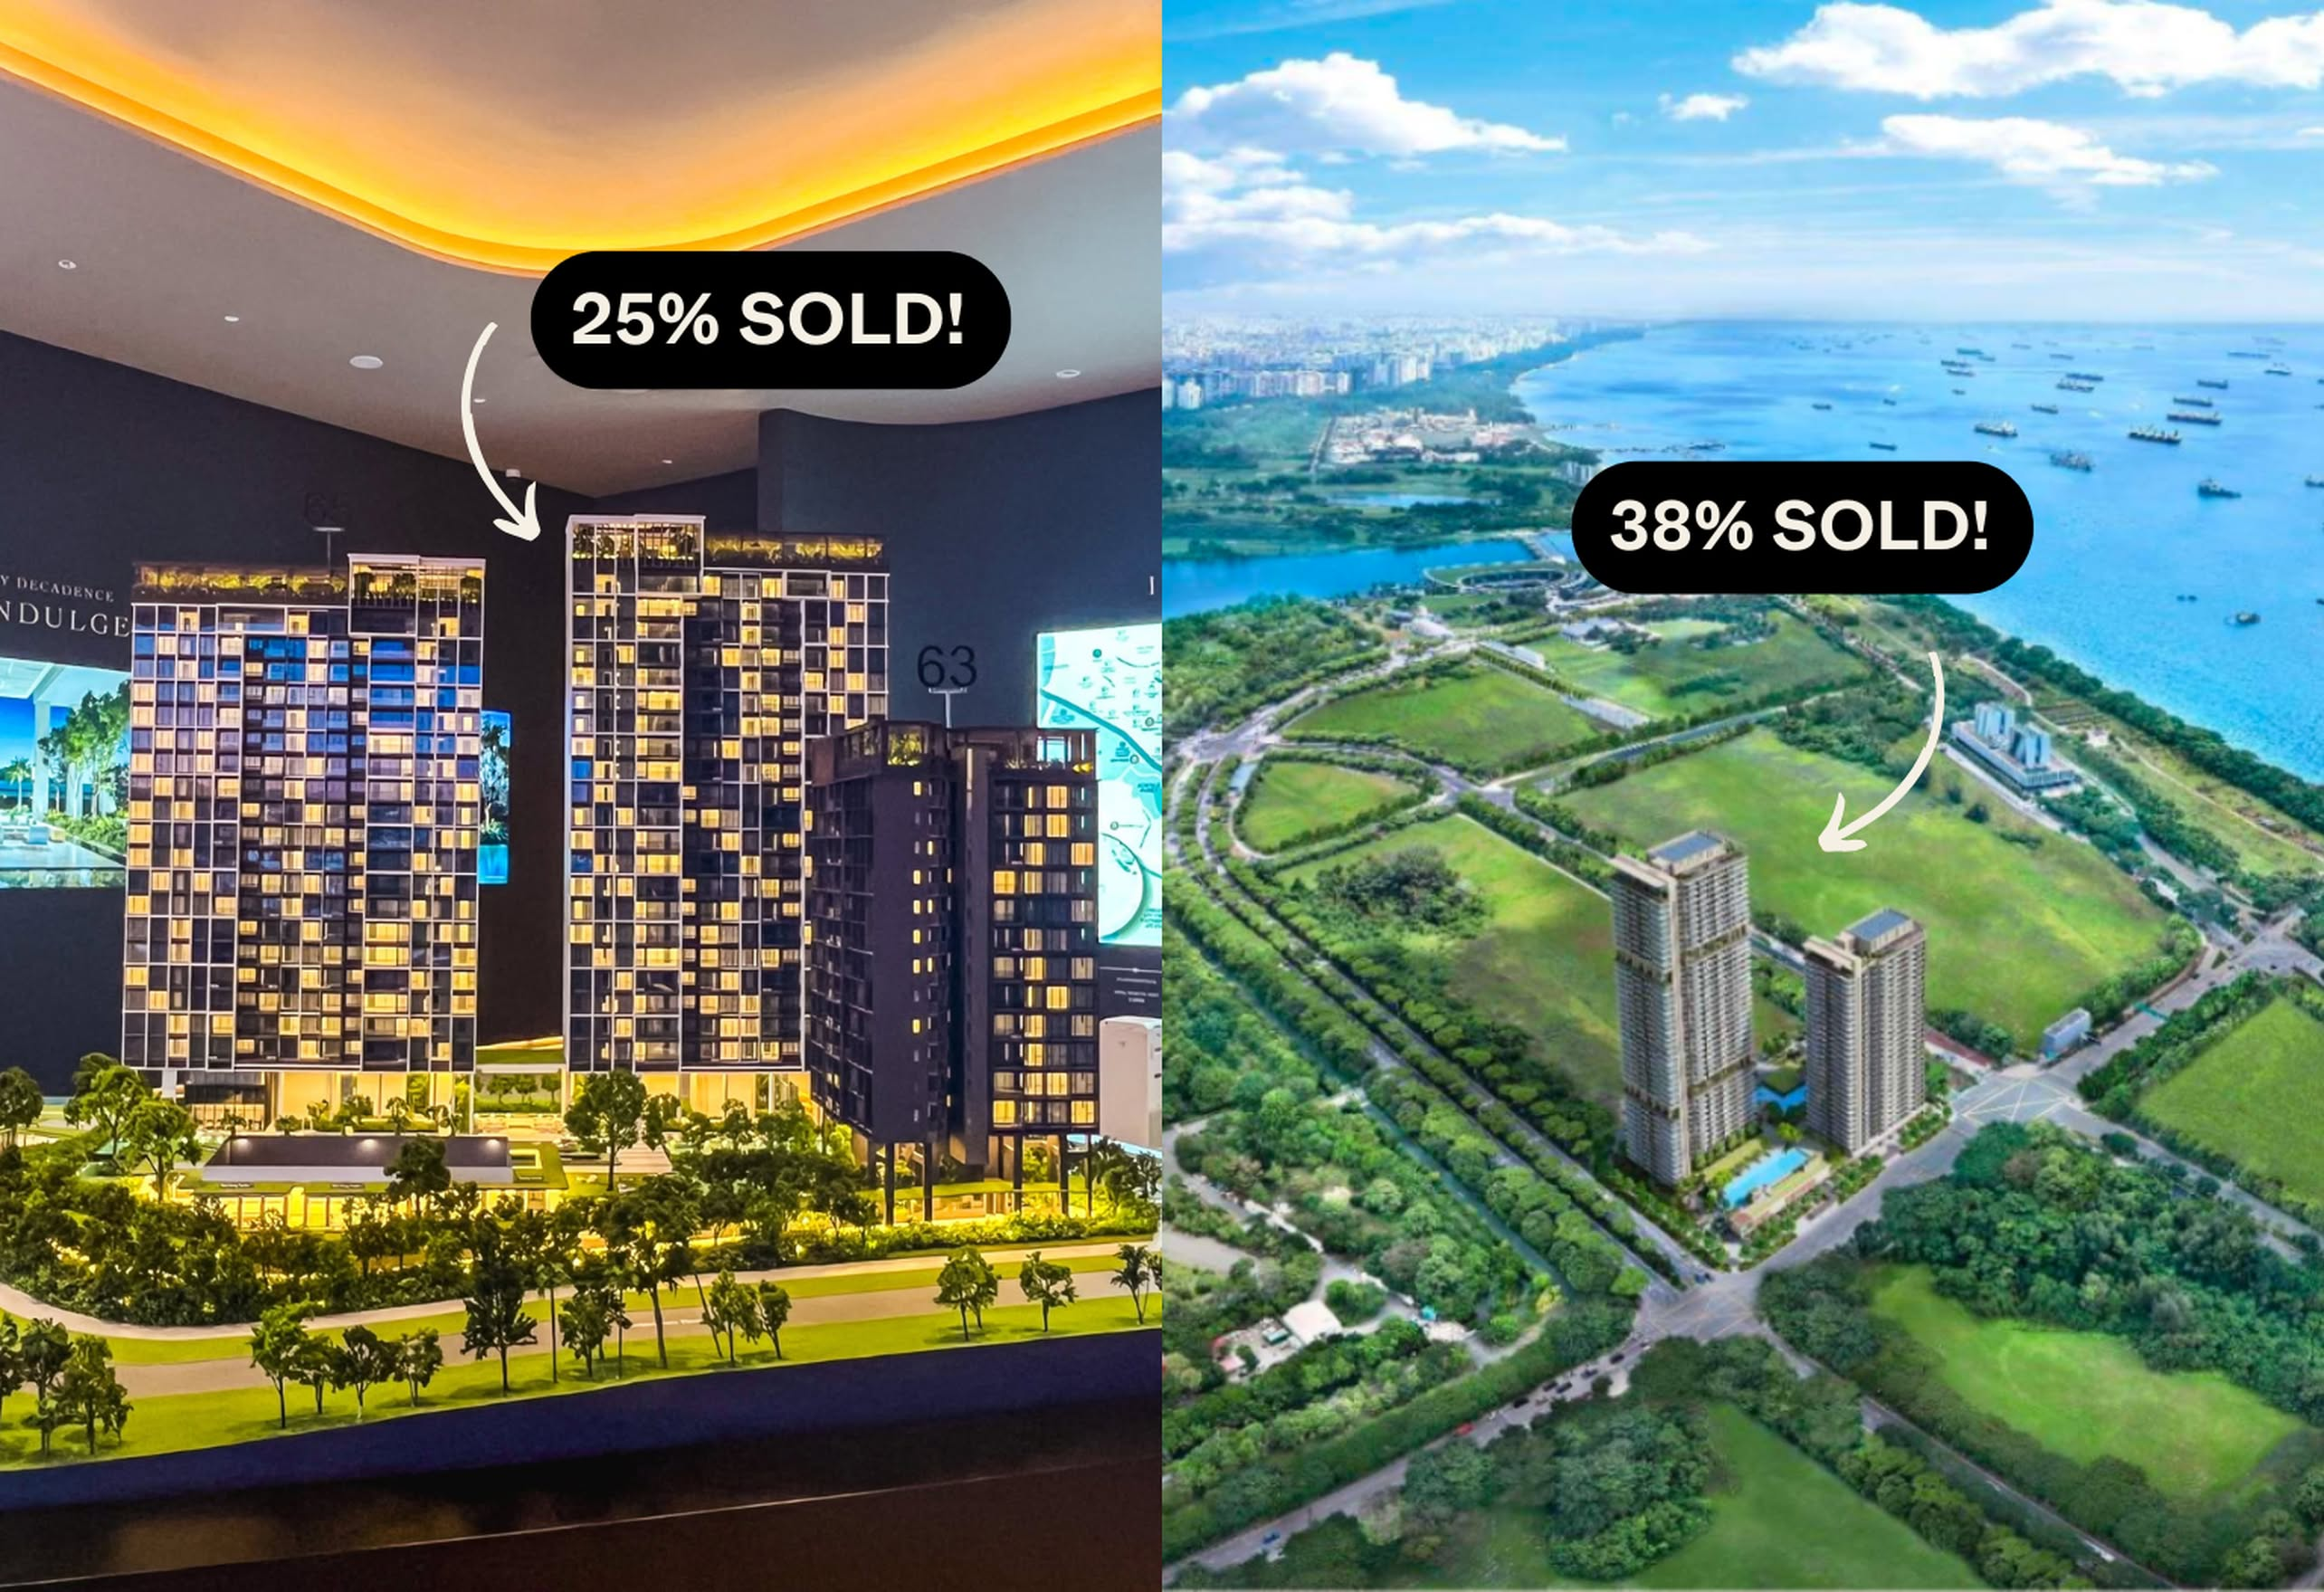
Here’s an example of a CCR condo that did well in the new launch segment for the early buyers:
The performances were mostly above 3%, depending on the unit of course. So again, making the assumption that OCR/RCR is the way forward for investment can make sense, but it’s important to keep an open mind to opportunities elsewhere too.
Now that we’ve covered the important alternative considerations you should make for investments, we’ll just run through the options that you’ve highlighted here.
We want to see how the different budgets perform based on the annualised return in the property market, in general, so that we know what the outcome could look like relative to investing your funds elsewhere. This means we’ll take into consideration the material costs involved in holding onto a property versus just letting your cash grow elsewhere.
This annualised return in the property market and your rental returns are assumed to be the average here, and performance will vary depending on your pick. But it’s still good to know what the end result could look like either way.
Next, we’ll take a look at a hypothetical purchase at a budget of $1.6M which is what you can expect for a 3-bedder in the OCR. This is purely for calculation purposes so you can see what your finances would look like at the end of 10 years as compared to investing it elsewhere.
Buying a 3-bedroom for $1.6 million
For calculation purposes, we will assume a purchase price of $1.6M, a conservative rental yield of 3% and a holding period of 10 years.
| Purchase price | $1,600,000 |
| BSD | $49,600 |
| CPF + cash | $1,250,000 |
| Loan required | $399,600 |
Costs incurred
| BSD | $49,600 |
| Interest expenses (Assuming a 4% interest and 25 year tenure) | $138,660 |
| Property tax | $74,400 |
| Maintenance fees (Assuming $350/month) | $42,000 |
| Rental income | $480,000 |
| Agency fees (Payable once every 2 years) | $21,800 |
| Total gains | $153,540 |
Using the average annual growth rate of non-landed private properties over the last 10 years of 2.9%, we will do a simple projection of the potential appreciation.
| Time period | Property price | Gains |
| Starting point | $1,600,000 | $0 |
| Year 1 | $1,646,400 | $46,400 |
| Year 2 | $1,694,146 | $94,146 |
| Year 3 | $1,743,276 | $143,276 |
| Year 4 | $1,793,831 | $193,831 |
| Year 5 | $1,845,852 | $245,852 |
| Year 6 | $1,899,382 | $299,382 |
| Year 7 | $1,954,464 | $354,464 |
| Year 8 | $2,011,143 | $411,143 |
| Year 9 | $2,069,466 | $469,466 |
| Year 10 | $2,129,481 | $529,481 |
Total gains if you were to take this pathway: $153,540 + $529,481 = $683,021
Invest the funds in other avenues
For this pathway, there are different options to consider depending on your risk tolerance. You could purchase an investment-grade bond ETF which is safer or an equities ETF which is riskier.
For calculation purposes, we will assume a 4-7% return on investment just so that you can get an idea of what each level of return would look like over a 10-year holding period.
| ROI | Investment amount | Gains |
| 4% | $850,000 | $408,208 |
| 5% | $850,000 | $534,560 |
| 6% | $850,000 | $672,221 |
| 7% | $850,000 | $822,079 |
Conclusion
Given that both scenarios are relatively safe options, the decision between investing in other avenues or investing in property will depend on your preferences.
Over 10 years, it looks like if you were to invest your funds at a 4% return, it does pale in comparison to investing in property. However, when considering costs, investing in other avenues such as stocks and shares typically involves the least expense since the primary cost is the broker’s fee. It also involves less hassle, as you won’t need to manage tenants or maintain a property.
So if the hassle of managing a property is not a factor for you, then you do have to decide on your exit strategy – as that would matter more in deciding what property would make sense for you to invest in at this point.
We hope that our analysis will help you in your decision-making. If you’d like to get in touch for a more in-depth consultation, you can do so here.





What a totally unbiased article!
Cpf of 400K is also earning interest if it is not use to buy property
It depends on your risk-reward profile, your investing time horizon and expected returns. I recommend due diligence to be done for all the products that we consider. Not overpaying is the key consideration – paying for them at fair value. there will always be risks for all assets, including bonds (just lesser risks). All the best, safe investing.
“I am semi-retired and have spare cash of $500k to invest in real estate. I currently own a landed property, and my wife co-owns a point block HDB with her parents. I also have three sons, aged 21, 20, and 18. I would like to seek your recommendation on investing in Singapore real estate