5 Condos That Lost Money Initially But Became Profitable Later On
A seasoned content strategist with over 17 years in the real estate and financial journalism sectors, Ryan has built a reputation for transforming complex industry jargon into accessible knowledge. With a track record of writing and editing for leading financial platforms and publications, Ryan's expertise has been recognised across various media outlets. His role as a former content editor for 99.co and a co-host for CNA 938's Open House programme underscores his commitment to providing valuable insights into the property market.
Sometimes, condos that had bad sales launches or were bought at price peaks look like a bad investment; but sometimes with real estate, the key is holding power. Keep it long enough, and there can be a turnaround in performance.
This can be due to various reasons. A pandemic-induced demand for housing, a change in demand for certain unit types (for example, larger units), or even changes in the area like the arrival of higher-priced new launch condos.
From the end of the last financial crisis to the recent pandemic, we’ve seen how quickly the market can take a U-turn in a year or two, and along with it the performances of various resale condos. Here are some projects that struggled in earlier years, but have since taken off in a more positive way:
Best turnarounds in performance:
1. Tree House
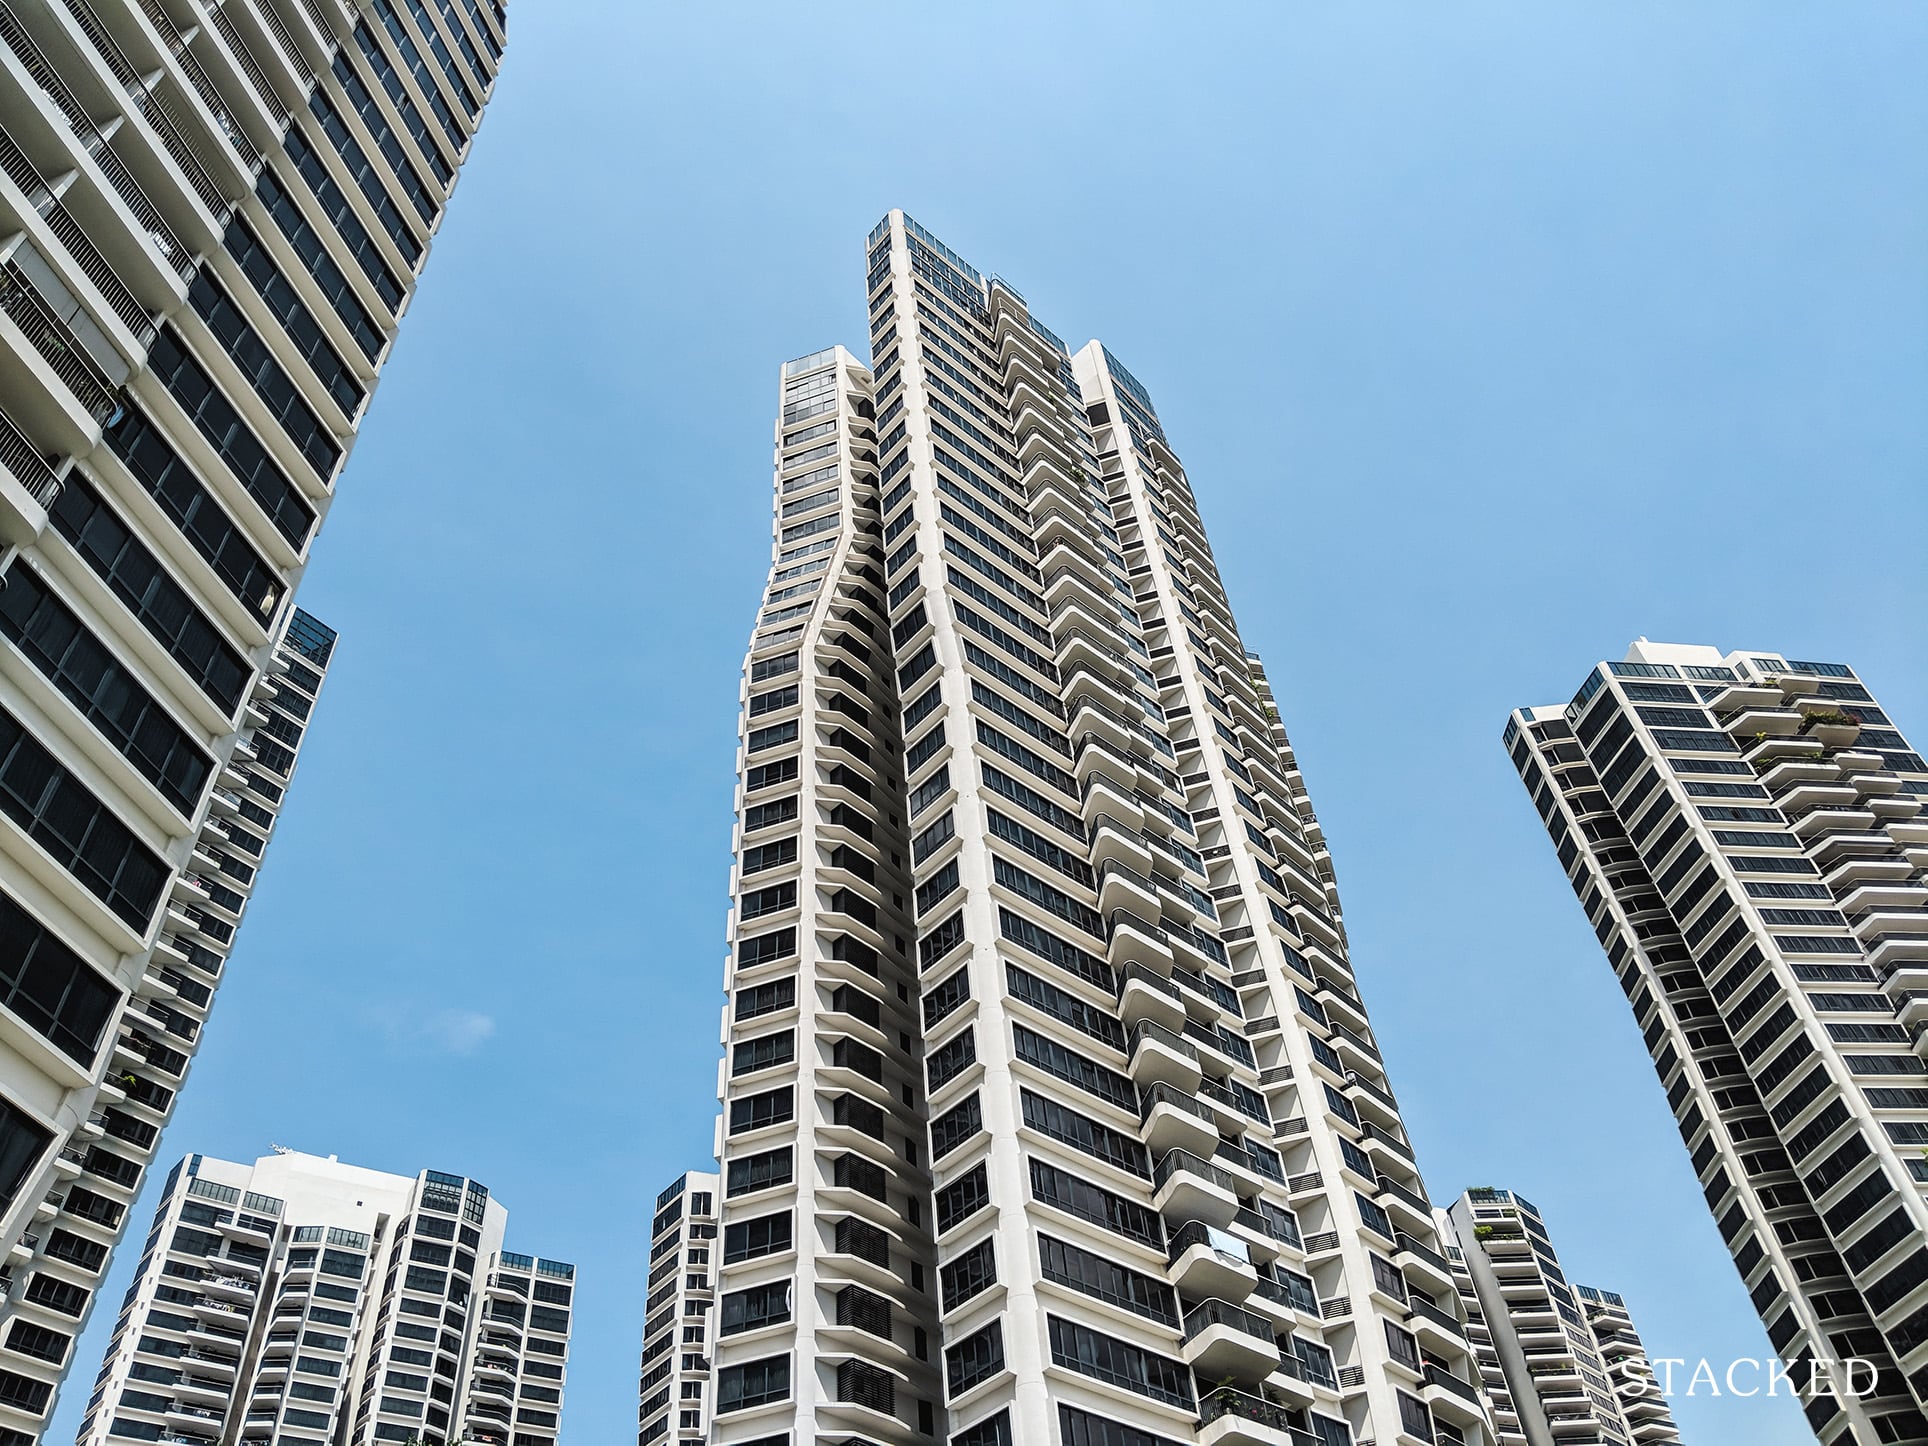
Tree House is a Guinness World Record holder: it’s the largest vertical garden (2,289 sqm of green surface) in the world. When it was launched in 2010, it was the greenest project in Singapore – it even had its preview launch on Earth Day, when it sold out 85 per cent of 350 available units. At the time, one of the unique selling points was a claim that the building saved around $500,000 a year in energy and water costs. This wasn’t just due to the vertical garden, but also because it was one of the first projects to heavily feature installations like heat-reducing windows.
This 429-unit, leasehold condo saw its biggest losses in the run-up from 2012 to 2017, which is largely due to the property market falling off its 2013 peak. A transaction in December 2014, which recorded a loss of $250,000 in a period of less than two years, skewed the average downward in that period. The situation subsequently improved, with Tree House showing 268 profitable transactions to 13 losses, and recent losses have also been less severe.
As of today, Tree House is mainly prized by nature lovers, for its location between Chestnut and Dairy Farm Nature Parks. This location can rival the greenery of Bukit Timah, but at much lower prices: an 861 sq. ft. unit at Tree House can transact for as low as around $1.2 million, well within the comfort zone of HDB upgraders and even some first-timers.
The “drawback” is the seclusion and distance from malls and MRT stations. For the demographic that Tree House targets, however, this is probably a feature, not a bug.
Transactions
| Floor | Size (Sq Ft) | Bought At | Sold At | Bought Date | Sold Date | Gain/Loss ($) | Gain/Loss (%) | Type |
| #21 | 797 | $870,000 | $1,260,000 | 17 Dec 2020 | 5 Mar 2024 | $390,000 | 44.8% | Gain |
| #21 | 797 | $960,000 | $870,000 | 15 Nov 2013 | 17 Dec 2020 | -$90,000 | -9.4% | Loss |
| #1 | 1,012 | $965,000 | $1,290,000 | 16 Apr 2019 | 9 May 2023 | $325,000 | 33.7% | Gain |
| #1 | 1,012 | $1,200,000 | $965,000 | 29 Oct 2013 | 16 Apr 2019 | -$235,000 | -19.6% | Loss |
| #22 | 797 | $855,000 | $1,200,000 | 22 Jun 2018 | 13 Apr 2023 | $345,000 | 40.4% | Gain |
| #22 | 797 | $890,000 | $855,000 | 26 Mar 2013 | 22 Jun 2018 | -$35,000 | -3.9% | Loss |
| #1 | 1,959 | $1,620,000 | $2,135,000 | 22 Aug 2016 | 16 Sep 2022 | $515,000 | 31.8% | Gain |
| #1 | 1,959 | $1,750,000 | $1,620,000 | 7 Jan 2014 | 22 Aug 2016 | -$130,000 | -7.4% | Loss |
| #8 | 1,249 | $1,260,000 | $1,560,000 | 20 Feb 2018 | 20 Aug 2021 | $300,000 | 23.8% | Gain |
| #8 | 1,249 | $1,400,000 | $1,260,000 | 5 Aug 2013 | 20 Feb 2018 | -$140,000 | -10.0% | Loss |
2. Urban Vista
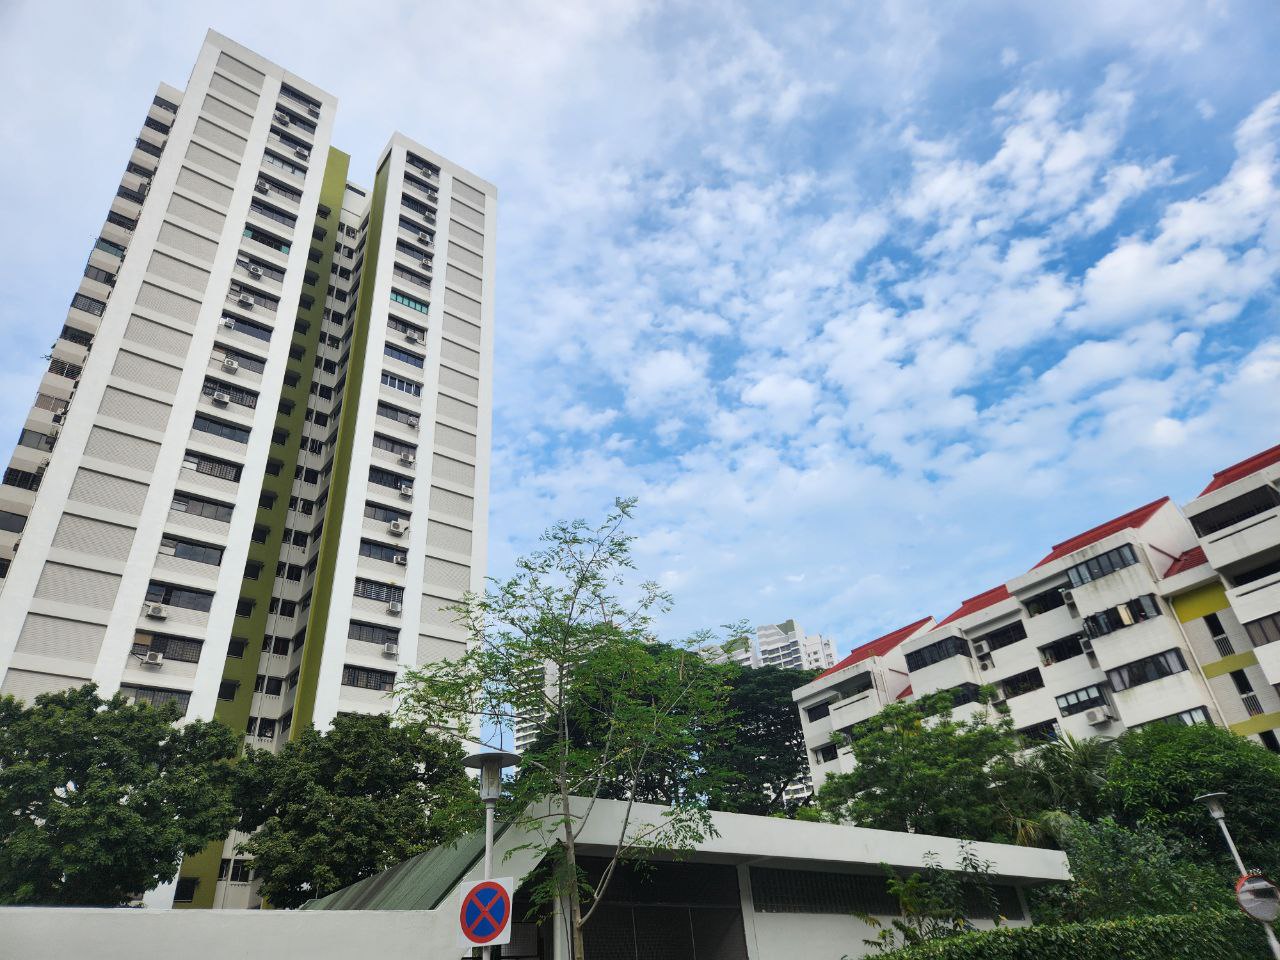
Urban Vista is still in the process of turning around. This 582-unit leasehold condo, located near the Tanah Merah MRT station (EWL), saw a confluence of several issues in its early years.
First, the decline from the 2013 peak impacted the condo even during initial developer sales:
From the Square Foot data, prices went from a median of $1,503 psf during the property peak in 2013, to just $1,217 psf at the end of developer sales in May 2014. Subsequently, Urban Vista saw a painful track record of 74 profitable transactions to 68 unprofitable ones. Losses seem to stem mainly from the buyers in the earlier buyers, who purchased too close to the peak.
The second issue that Urban Vista had was the end of the shoebox craze. The idea of buying and renting out one-bedders for investment was raging hot in the years leading up to 2013. Urban Vista, with its many small loft units, had layouts that were no longer in vogue as the market softened toward 2017.
This was also further compounded by other launches in the area, such as the attractively-priced Grandeur Park Residences.
| Year | Urban Vista | Grandeur Park Residences | PSF Comparison |
| 2017 | $1,432.00 | $1,389.31 | 3.07% |
| 2018 | $1,433.58 | $1,544.98 | -7.21% |
| 2019 | $1,405.89 | $1,535.00 | -8.41% |
| 2020 | $1,281.82 | $1,513.78 | -15.32% |
| 2021 | $1,374.03 | $1,588.49 | -13.50% |
| 2022 | $1,283.33 | $1,651.50 | -22.29% |
There is a turnaround creeping in, however, like the latest transaction in May this year, which saw a $180,000 profit after just three years. Speculatively, this could be related to interest in Tanah Merah being reignited by the new Seneca Residence. The introduction of new amenities via Sceneca Residence, coupled with Sceneca’s $2,068+ psf price point, may have caused buyers to look at neighbouring resale options with new interest. Urban Vista, along with condos like The Tanamera and Optima, may have seen a boost from this.
Transactions
| Floor | Size (Sq Ft) | Bought At | Sold At | Bought Date | Sold Date | Gain/Loss ($) | Gain/Loss (%) | Type |
| #2 | 431 | $578,000 | $680,000 | 6 Aug 2019 | 18 Apr 2024 | $102,000 | 17.6% | Gain |
| #2 | 431 | $593,312 | $578,000 | 11 Apr 2013 | 8 Jun 2019 | -$15,312 | -2.6% | Loss |
| #13 | 1,249 | $1,300,000 | $1,475,000 | 10 Feb 2020 | 5 Aug 2024 | $175,000 | 13.5% | Gain |
| #13 | 1,249 | $1,308,000 | $1,300,000 | 5 May 2014 | 2 Oct 2020 | -$8,000 | -0.6% | Loss |
| #7 | 441 | $630,000 | $650,000 | 8 Jun 2018 | 29 Apr 2022 | $20,000 | 3.2% | Gain |
| #7 | 441 | $696,409 | $630,000 | 15 Apr 2013 | 6 Aug 2018 | -$66,409 | -9.5% | Loss |
| #14 | 624 | $870,000 | $860,000 | 21 Sep 2020 | 30 Oct 2023 | -$10,000 | -1.1% | Loss |
| #14 | 624 | $966,297 | $870,000 | 5 Aug 2013 | 21 Sep 2020 | -$96,297 | -10.0% | Loss |
| #1 | 603 | $800,000 | $785,000 | 16 Oct 2018 | 24 Feb 2022 | -$15,000 | -1.9% | Loss |
| #1 | 603 | $829,094 | $800,000 | 22 Apr 2013 | 16 Oct 2018 | -$29,094 | -3.5% | Loss |
More from Stacked
Upgrading From A BTO To A 1,550 Sqft Executive Apartment: How A Couple Carefully Planned With A $50k Reno Budget
For some people, their first home may just be their forever home.
3. D’leedon
D’leedon was a rather bold move from the start: a leasehold mega-development (1,715 units) within the Farrer/Holland V area. To understand why this sticks out, you need to consider that Holland V has a lot of freehold condos (which makes leasehold look worse in contrast), and is a prime area: this is the kind of location where people usually expect exclusivity and small units counts, not a mega-development.
Also note that at the time of its launch in November 2010, D’Leedon was the largest private condo Singapore had ever seen (now surpassed by Treasure at Tampines).
This resulted in several disgruntled comments on the ground, and it was believed that investors would shun the condo due to excessive competition. By today’s standards, when we have Treasure at Tampines with over 2,200+ units, that sounds amusing – but it was taken quite seriously at the time.
This resulted in a somewhat shaky start, and among the initial buyers – who perhaps weren’t sure what sort of a price was right – there were some losses (350 profitable to 25 losing transactions). Today though, D’leedon is one of the best-known options near Holland V, and concerns over its size have mostly been handwaved.
A key part of this boils down to the strong location: you can walk to Farrer Road MRT (CCL) from D’leedon, which puts you one stop from Holland V and two stops from One-North. As the One-North tech hub continues to grow, the rising demand for nearby accommodation could balance out D’leedon’s unit count. (Let’s not forget the proximity of primary schools like Nanyang).
Also since the pandemic, there has been a clear demand for mega-developments. Whether it be because of the level of the range of facilities, or the space within the grounds, it is now a popular choice among Singaporeans – especially for families with children.
Transactions
| Floor | Size (Sq Ft) | Bought At | Sold At | Bought Date | Sold Date | Gain/Loss ($) | Gain/Loss (%) | Type |
| #25 | 1,399 | $2,050,000 | $2,850,000 | 3 Oct 2017 | 19 May 2023 | $800,000 | 39.0% | Gain |
| #25 | 1,399 | $2,315,060 | $2,050,000 | 8 Mar 2013 | 10 Mar 2017 | -$265,060 | -11.4% | Loss |
| #12 | 2,013 | $2,750,000 | $4,000,000 | 4 Apr 2017 | 15 May 2023 | $1,250,000 | 45.5% | Gain |
| #12 | 2,013 | $2,785,110 | $2,750,000 | 20 Mar 2013 | 4 Apr 2017 | -$35,110 | -1.3% | Loss |
| #23 | 1,216 | $1,850,000 | $2,300,000 | 9 Jul 2018 | 9 Nov 2023 | $450,000 | 24.3% | Gain |
| #23 | 1,216 | $1,886,320 | $1,850,000 | 26 Feb 2013 | 7 Sep 2018 | -$36,320 | -1.9% | Loss |
| #28 | 1,076 | $1,750,000 | $2,000,000 | 23 May 2018 | 14 Mar 2024 | $250,000 | 14.3% | Gain |
| #28 | 1,076 | $1,815,660 | $1,750,000 | 8 Apr 2013 | 23 May 2018 | -$65,660 | -3.6% | Loss |
4. Palm Gardens
Palm Gardens is a 694-unit, leasehold condo near Keat Hong LRT (this links up to Choa Chu Kang MRT station (NSL, JRL). This is an older condo, completed in 2000; but it is quite well maintained for its age.
Palm Gardens seems to have been under the radar for most of its existence. It’s in a convenient if not particularly exciting part of Choa Chu Kang. Keat Hong LRT provides quick access to Lot One and the CCK MRT station, so the hub of the neighbourhood is within easy reach if you don’t mind needing an LRT connection. In the future, Choa Chu Kang West on the Jurong Region line would be nearer but still require a bit of a walk. In any case, the HDB enclave at Keat Hong is well developed, with a good assortment of coffee shops, minimarts, and other heartland amenities; and the CCK Market and Hawker Centre are also within walking distance.
Note that while Palm Gardens never quite stood out, its performance is far from bad – 134 profitable transactions, with just seven losses. But while it’s been unremarkable in the past, it may be back in the limelight due to size and affordability. The three-bedders here are a generous 1,200+ sq. ft., and transact at just around $1.28 million ($1,062 psf).
Impressive for sellers, many of whom once bought at $600 to $700 psf, and impressive to buyers, who would pay about twice the price for a new three-bedder today (if they can even find one that’s as spacious). The renewed interest is likely to continue, and to keep pushing up the resale price.
Transactions
| Floor | Size (Sq Ft) | Bought At | Sold At | Bought Date | Sold Date | Gain/Loss ($) | Gain/Loss (%) | Type |
| #2 | 1,216 | $806,000 | $986,000 | 17 Jul 2017 | 2 Apr 2022 | $180,000 | 22.3% | Gain |
| #2 | 1,216 | $935,000 | $806,000 | 3 Jul 2013 | 17 Jul 2017 | -$129,000 | -13.8% | Loss |
| #10 | 1,206 | $730,000 | $885,000 | 6 Oct 2016 | 14 Jul 2021 | $155,000 | 21.2% | Gain |
| #10 | 1,206 | $760,000 | $730,000 | 4 Apr 2016 | 10 Jun 2016 | -$30,000 | -3.9% | Loss |
| #7 | 958 | $818,000 | $950,000 | 25 Apr 2019 | 22 Aug 2022 | $132,000 | 16.1% | Gain |
| #7 | 958 | $860,000 | $818,000 | 22 Jan 2013 | 25 Apr 2019 | -$42,000 | -4.9% | Loss |
| #7 | 1,206 | $870,000 | $940,000 | 26 Jul 2017 | 10 Jun 2021 | $70,000 | 8.0% | Gain |
| #7 | 1,206 | $980,000 | $870,000 | 1 Apr 2013 | 26 Jul 2017 | -$110,000 | -11.2% | Loss |
5. Q Bay Residences
Q Bay Residences, along with its neighbours Santorini and The Alps, were once considered ulu despite being in the mature Tampines area. This is mostly because most people think of Tampines Hub (the area with the MRT station, malls, and offices) when the neighbourhood is mentioned.
But Q Bay Residences is close to the point where Bedok meets Tampines (Tampines West). In stark contrast to Tampines Hub, this is a very green area. Tampines Quarry and Bedok Reservoir are nearby, making it quite an outdoorsy space.
Q Bay Residences is a leasehold, 630-unit condo that capitalises on the scenery, as well as its proximity to Temasek Polytechnic. And while it’s too far to walk to the MRT, there’s a bus stop just outside with services like 23, which go to Tampines MRT (DTL, EWL) and the hub. So if you don’t mind needing a bus connection, this is a much more convenient place than it appears on paper.
Earlier losses at this condo are likely due to its launching at a market peak. This was visible even from developer launch prices:
Prices were at $1,012 psf during the high point of 2013, tapering off to $900 psf at the end of developer sales in 2014. Subsequently, prices took a while to recover. Nonetheless, Q Bay now has 153 profitable transactions to just 14 losses.
Q Bay is on the uptick though, and there was a notable transaction in April this year with a $295,000 profit over just 3.4 years. As the Tampines West area sees more development, and homeowners start to associate Tampines with more than just the hub, resale condos here will likely start to draw more interest.
Transactions
| Floor | Size (Sq Ft) | Bought At | Sold At | Bought Date | Sold Date | Gain/Loss ($) | Gain/Loss (%) | Type |
| #14 | 517 | $590,000 | $770,000 | 7 Oct 2019 | 2 Aug 2024 | $180,000 | 30.5% | Gain |
| #14 | 517 | $629,630 | $590,000 | 19 Feb 2013 | 10 Jul 2019 | -$39,630 | -6.3% | Loss |
| #2 | 764 | $678,999 | $795,000 | 25 Aug 2017 | 8 Oct 2021 | $116,001 | 17.1% | Gain |
| #2 | 764 | $733,910 | $678,999 | 8 Feb 2013 | 25 Aug 2017 | -$54,911 | -7.5% | Loss |
| #16 | 1,292 | $1,250,000 | $1,450,000 | 14 Jun 2018 | 23 Dec 2021 | $200,000 | 16.0% | Gain |
| #16 | 1,292 | $1,351,690 | $1,250,000 | 8 Mar 2013 | 14 Jun 2018 | -$101,690 | -7.5% | Loss |
| #12 | 1,119 | $1,190,000 | $1,350,000 | 14 Aug 2017 | 6 Sep 2021 | $160,000 | 13.4% | Gain |
| #12 | 1,119 | $1,230,390 | $1,190,000 | 5 Apr 2013 | 14 Aug 2017 | -$40,390 | -3.3% | Loss |
For more on the Singapore private property market, as well as reviews of new and resale projects alike, follow us on Stacked. If you’d like to get in touch for a more in-depth consultation, you can do so here.
Ryan J
A seasoned content strategist with over 17 years in the real estate and financial journalism sectors, Ryan has built a reputation for transforming complex industry jargon into accessible knowledge. With a track record of writing and editing for leading financial platforms and publications, Ryan's expertise has been recognised across various media outlets. His role as a former content editor for 99.co and a co-host for CNA 938's Open House programme underscores his commitment to providing valuable insights into the property market.Read next from Property Market Commentary
Property Market Commentary I Reviewed HDB’s Showroom For 4 And 5-Room Flats. Here’s What Future Homeowners Should Know
Property Market Commentary The Biggest Misconceptions About Buying Property In Singapore’s CCR In 2025
Property Market Commentary 4 Potential Residential En Bloc Sites That Could Be Worth Watching In 2025
Property Market Commentary Can Singapore’s Housing Market Handle A Rapidly Ageing Population?
Latest Posts

New Launch Condo Analysis Is Arina East Residences Worth A Look? A Detailed Pricing Review Against District 15 Alternatives
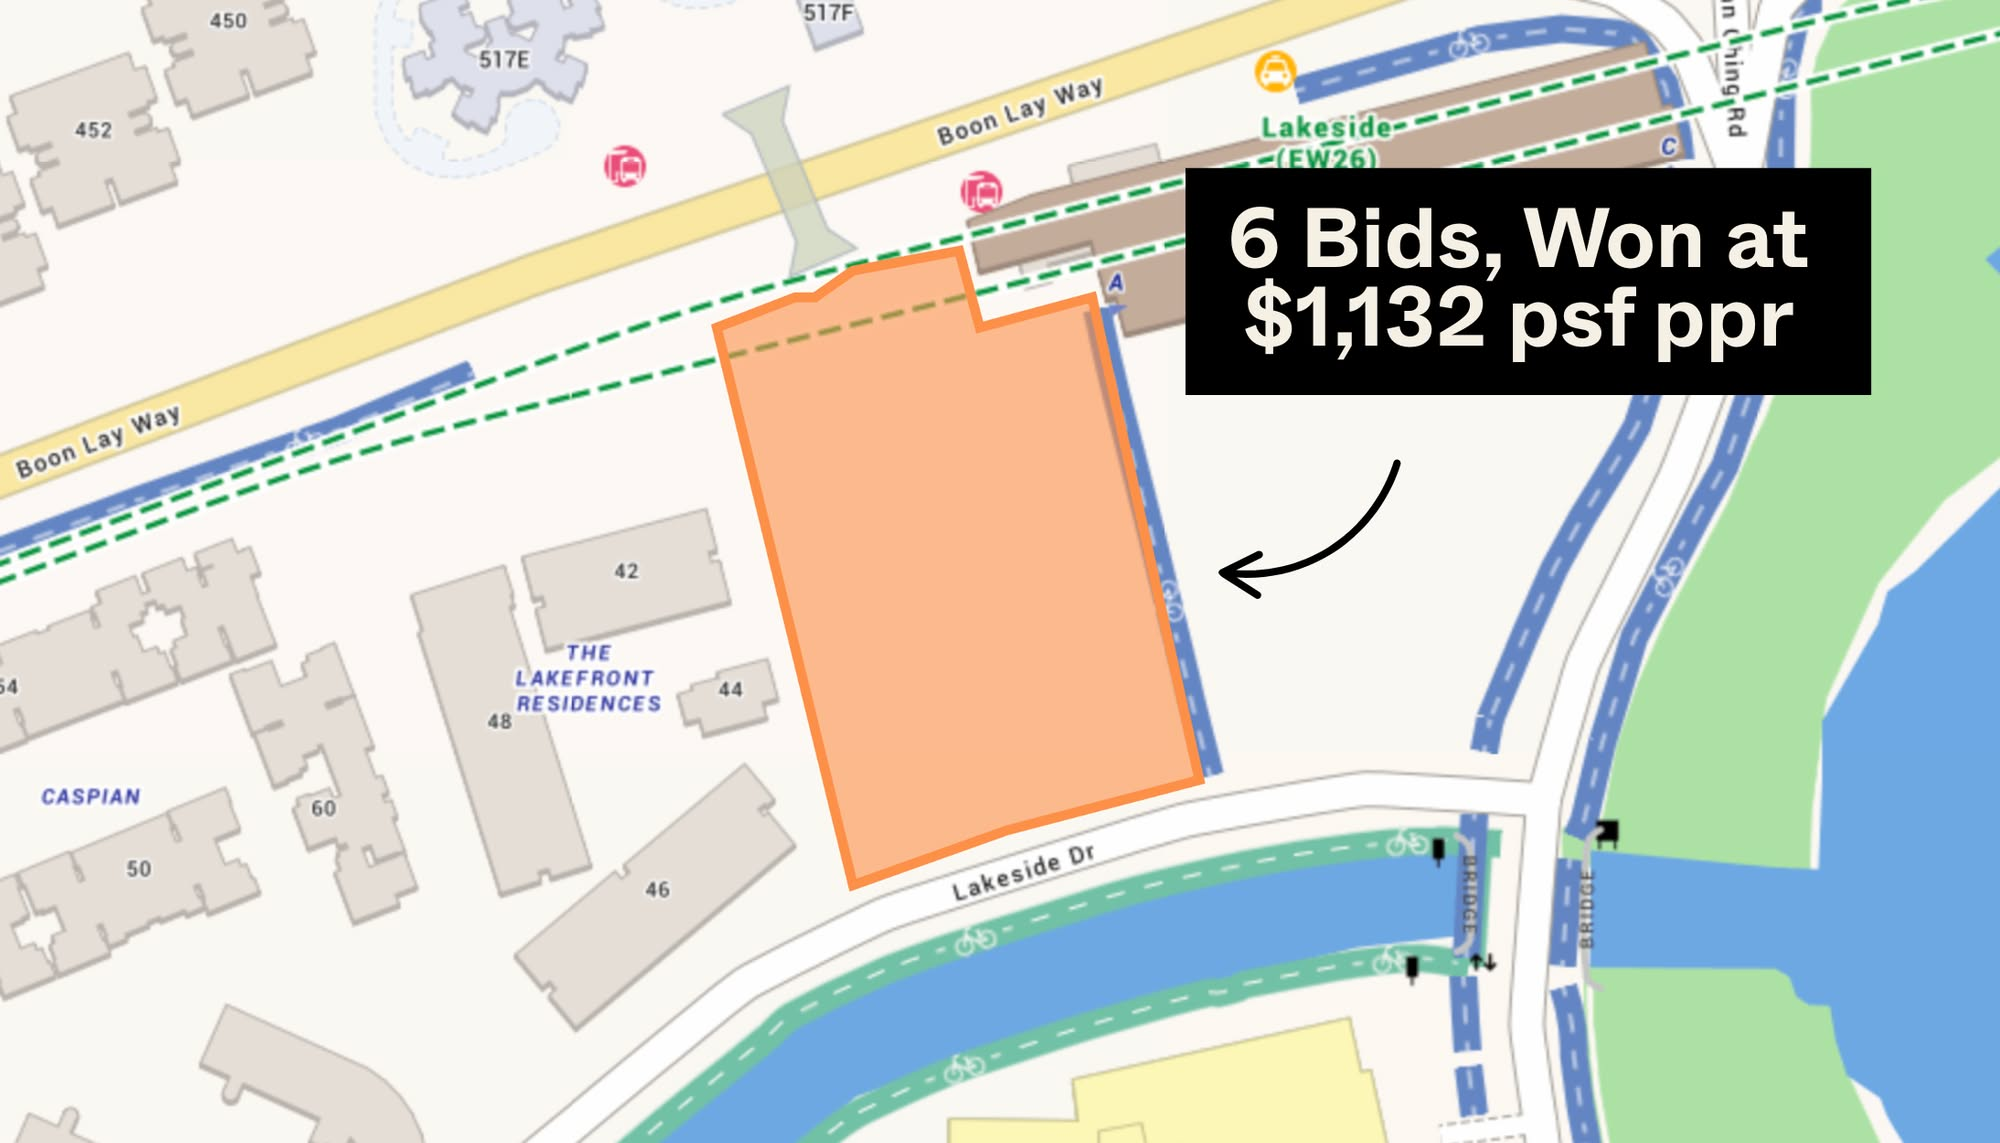
Singapore Property News This West-Side GLS Plot Just Got A $608M Bid And 6 Bidders: Why Lakeside Drive Bucked The Trend
Landed Home Tours Touring A Rare Stretch of Original 2-Storey Freehold Terrace Homes At Joo Chiat Place From $3.02m
Singapore Property News The 1KM Primary School Rule In Singapore: Fair Game Or Property Power Play?
Singapore Property News 1,765 Punggol Northshore HDB Flats Reaching MOP: Should You Sell Quickly or Wait?

Overseas Property Investing Love Without A BTO Flat: The Tough Housing Choices Facing Mixed-Nationality Couples In Singapore
Pro Can 30+ Year-Old Leasehold Condos Still Perform? The Arcadia’s Surprising Case Study

Singapore Property News $1.658 Million For 5-Room HDB Loft In Queenstown Sets New Record
On The Market 5 Lesser-Known Freehold 3-Bedroom Units Priced Under $2 Million
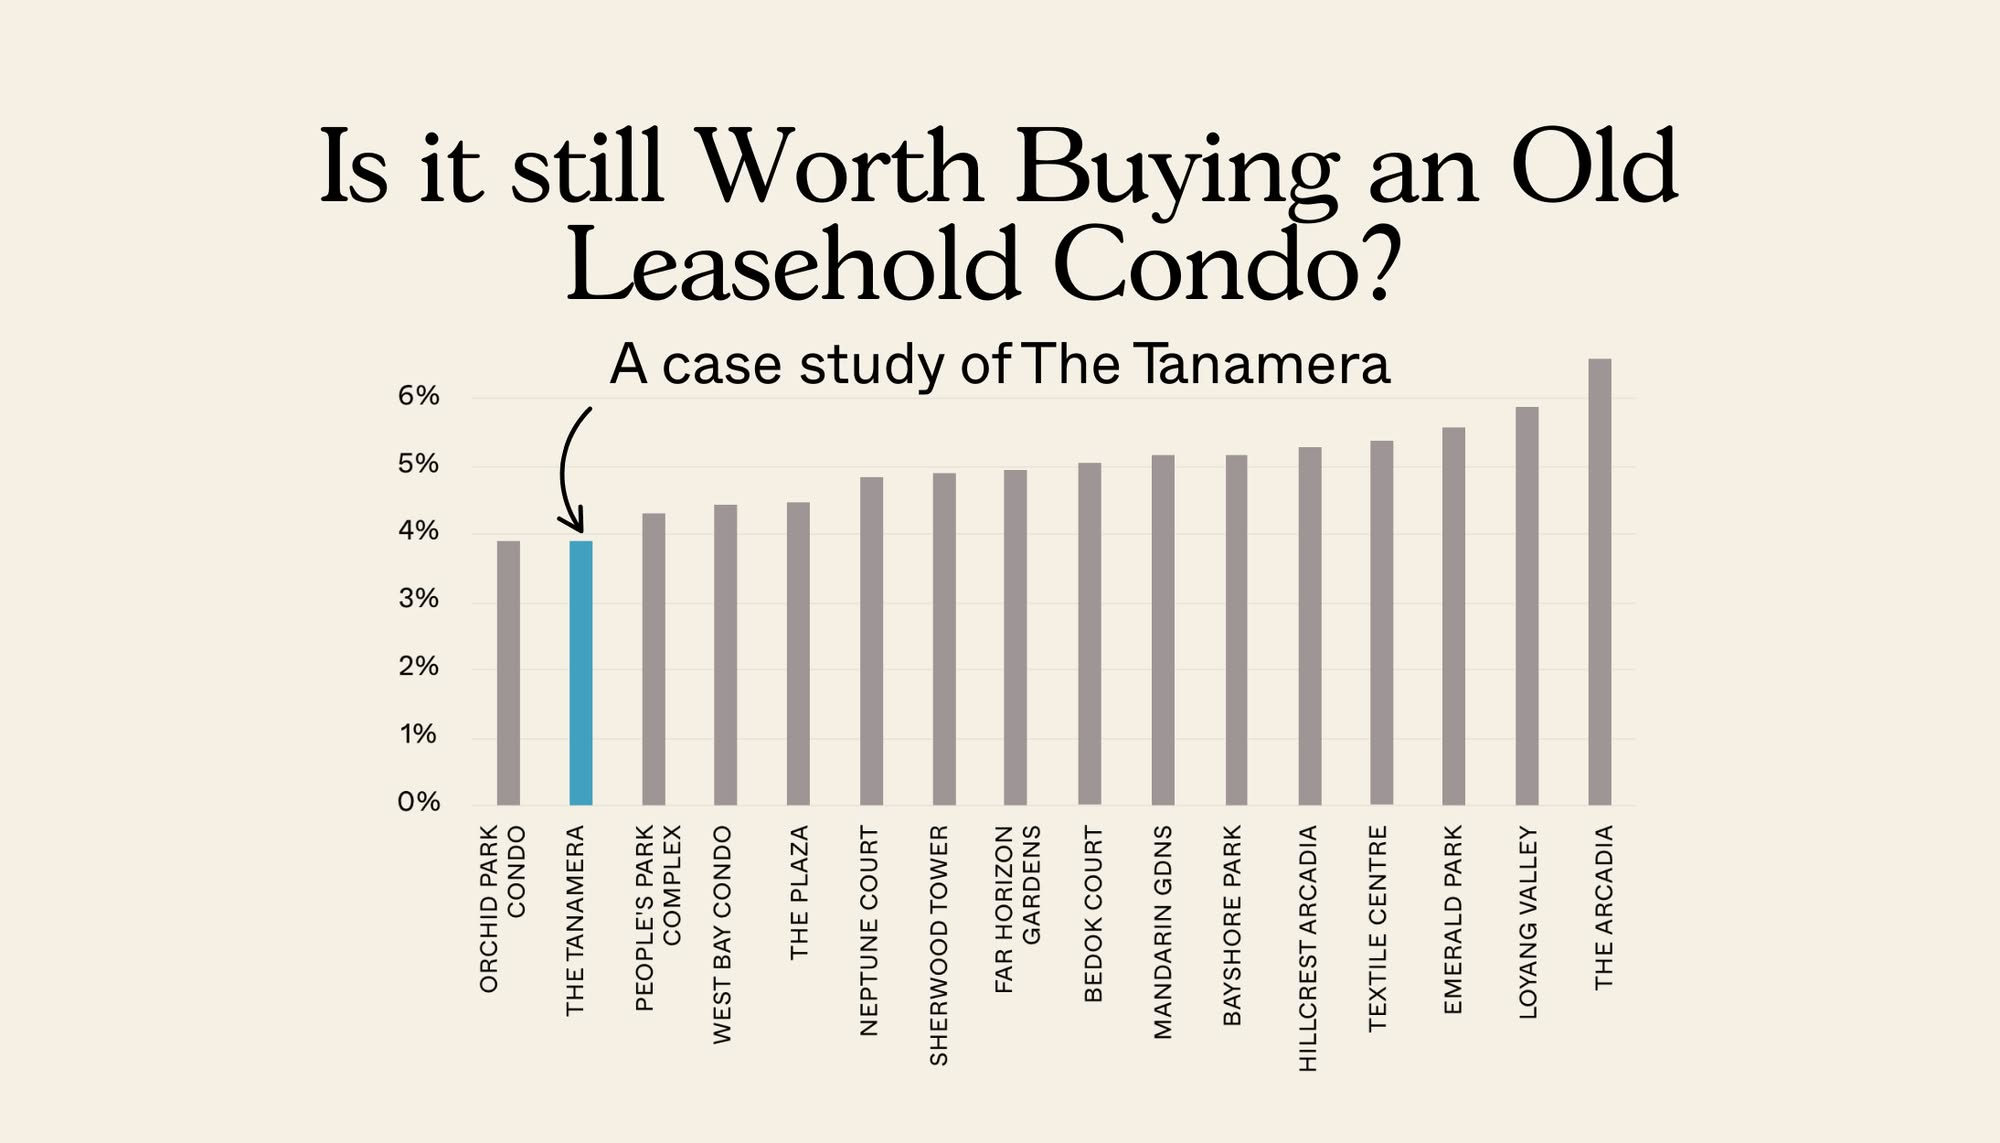
Pro How Have Older Leasehold Condos Performed Compared To Newer Ones? A Case Study Of The Tanamera
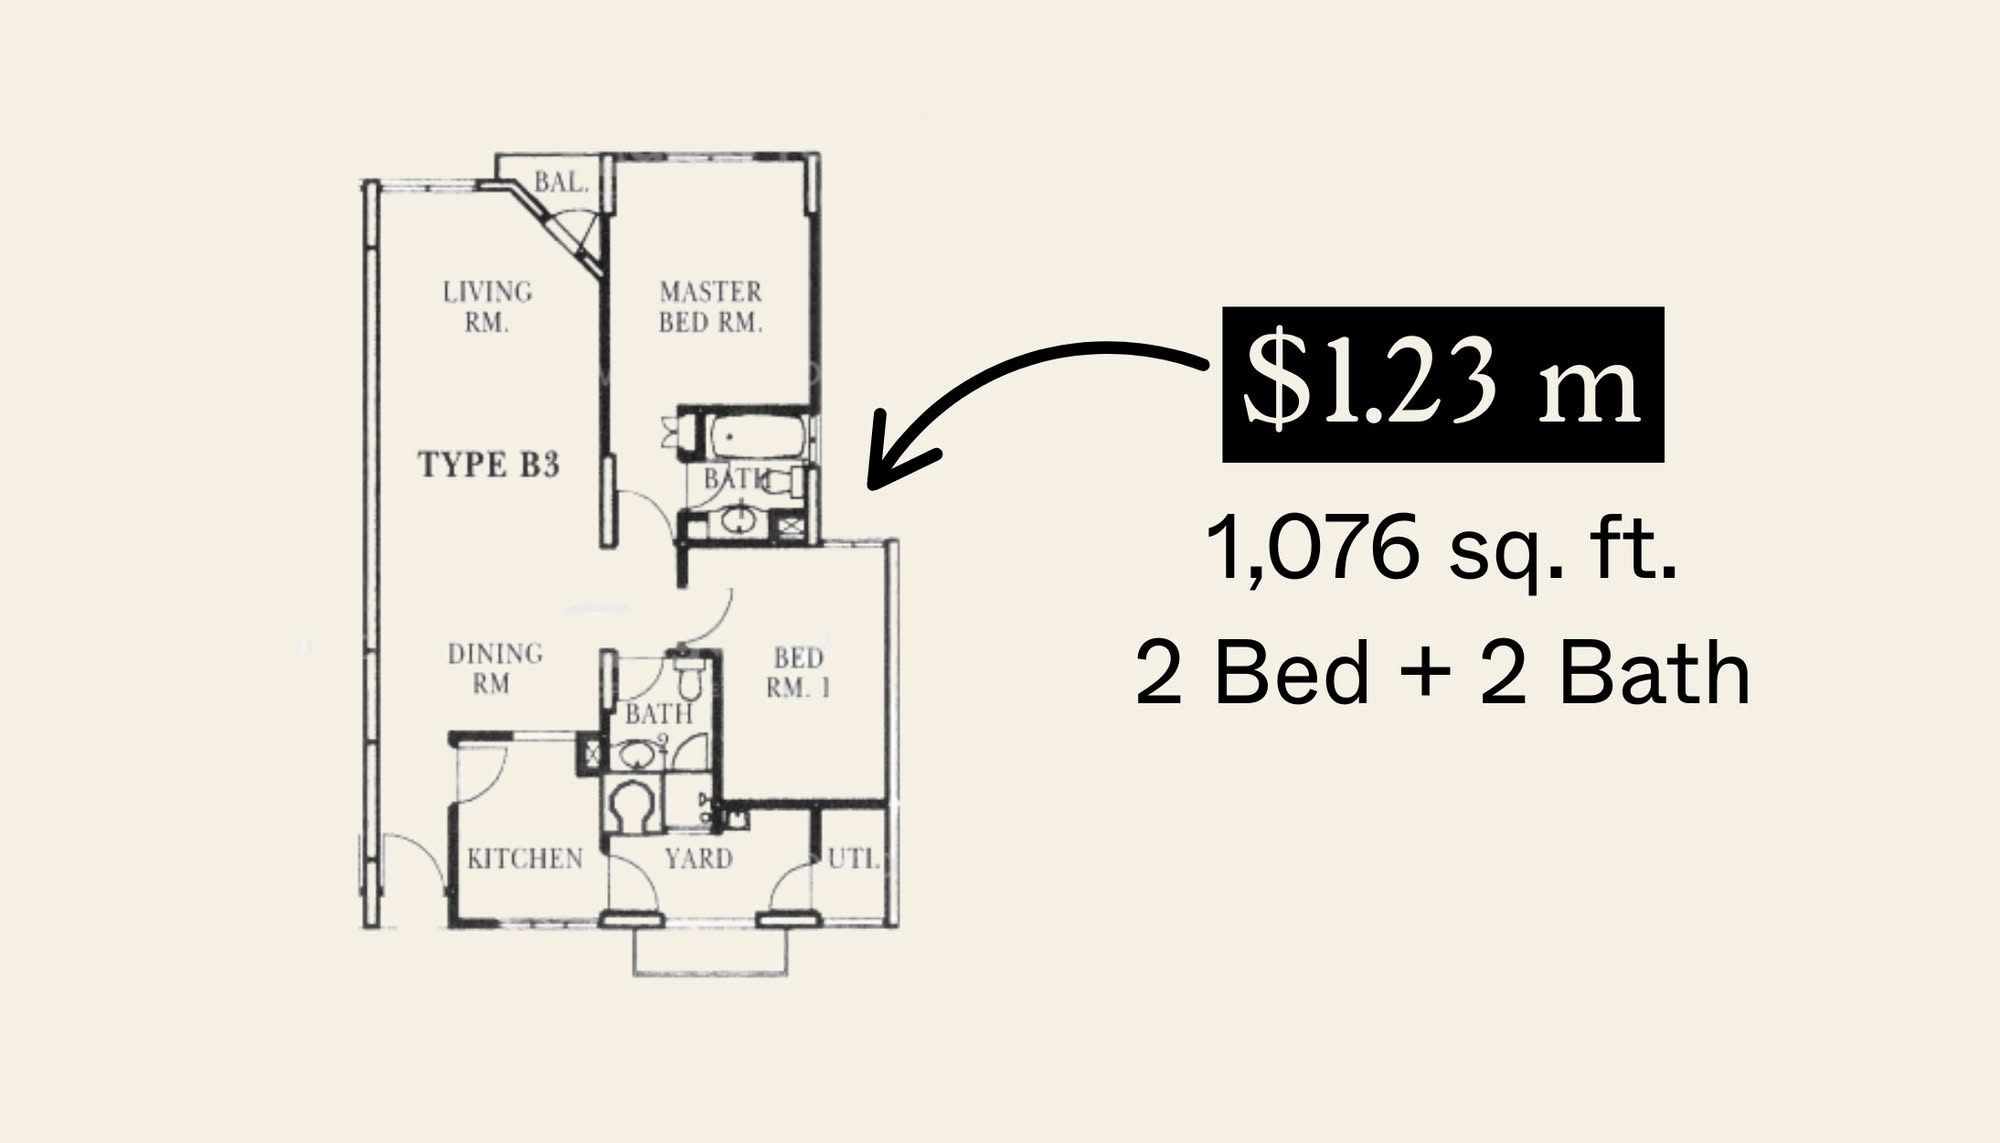
Editor's Pick Why We Chose A $1.23 Million 2-Bedroom Unit At Parc Vista Over An HDB: A Buyer’s Case Study

Property Advice The Surprising Reasons Some Singaporean Buyers Are Choosing Smaller Condo Units (Even When They Can Afford More)
Editor's Pick Touring Onan Road, A Freehold Landed Estate With A “Hidden” Enclave Of Shophouses

Singapore Property News In a Weak Economy, This Policy Hurts Singaporean Homeowners Most
Editor's Pick I’m A Singaporean House-Hunting In Mexico City: Here’s What 2 Weeks On The Ground Taught Me
